The Kano Model - guest post by Michael D. Lieberman
I was attending a conference at a resort hotel in Orlando, Florida, standing in the lobby trying in vain to connect to a client who needed to discuss the results of a range of multivariate output. To my chagrin, my cell would not pick up a signal. Imagine my surprise when the nearby concierge, viewing my angst, permitted me to use his phone to complete the call. He even dialed the number for me.
When I phoned room service, I was greeted with a polite, “Good evening, Mr. Lieberman,” The room was immaculate and comfortable, and upon check-out I received a small, handwritten note of thanks from the clerk for staying with this resort and wishing me well on my travels.
Needless to say, I was delighted by the excellent service and wonderful room, and when I return to Orlando (hopefully with my wife and daughter), we will certainly beat a path to this resort, not only for its proximity to Disney World, but for the excellent service and warm, welcoming atmosphere.
This example provides an excellent opportunity to examine my hotel experience through the lens of the much used Kano Model of customer satisfaction. The model, developed by Japanese quality expert Dr. Noriaki Kano, describes the complexities of customer needs and their relationship to customer satisfaction.
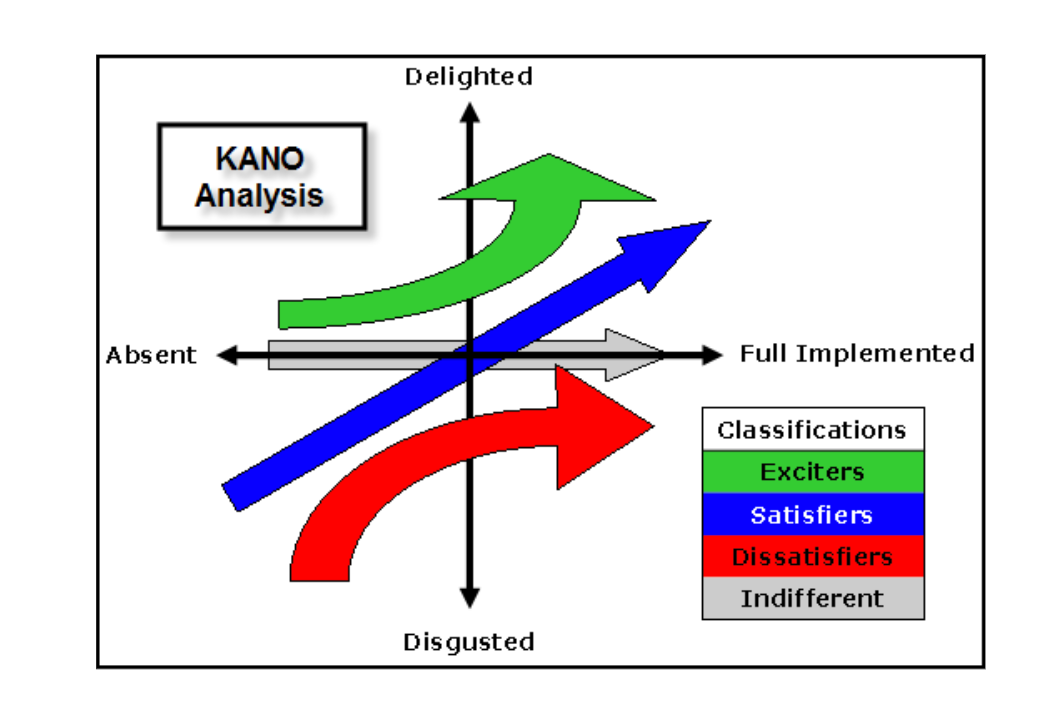
4 types of product features relating to customer needs
Dr. Kano identified four basic types of product features relating to customer needs:
- Exciters. An unexpected service, such as the concierge offering me her phone or the personal note from the check-out clerk. For consumer goods, these attributes can be difficult to discover, or must be somehow unique.
- Satisfiers. These are the ‘The More the Better.’ For example, a restaurant that offers excellent food at a slightly lower price than the competition. These performance attributes drive satisfaction. When they are high, so is satisfaction. When they are low, satisfaction suffers.
- Dissatisfiers. These are factors which cause the customer to dislike the product, but do not necessarily raise satisfaction levels if met. A good example would be a hotel room with no toilet paper or a business hotel that does not offer wireless internet. One wouldn’t say, ‘Wow, that was a great bathroom, it had toilet paper!’ But if there is no toilet paper the lavatory experience is negatively affected.
- Indifference. These don’t make any impact one way or another. For example, a differential gear in a rental car has no effect because most customers don’t feel any benefit from a better distribution ratio and response.
The format is surprisingly easy to measure and illustrate (Figure 1).
Features tend to migrate between classifications over time. Yesterday’s Exciter is frequently today’s Satisfier and tomorrows Dissatisfier.
Car features such as electronic doorlocks and cup holders were at one time an exciting feature, then became a good plus, and now customers expect them and would be annoyed if they weren’t standard.
The Kano Model is particularly useful as a precursor to choice exercises, such as conjoint analysis, when developing a product or brand communication strategy.
Conjoint allows the researcher to explore more fully the interaction of various levels or attributes, whereas Kano analysis is largely one-dimensional. However, Kano is far more simple to administer, and can be used to winnow out insignificant attributes.
A precise technique for assessing the role of new product features
Kano is also closely related to customer value management (CVM). By constructing a visual critical path the Kano Model can serve as an organization’s strategic navigation.
As we said, attributes migrate from Kano categories, almost always in a downward direction. The Kano method becomes a precise technique for assessing the role of new product features and predicting how they will migrate, and gives a map of the strategic directions of the product or corporate communication.
In my resort example, the hotel managed to delight and surprise me with the little extras that make up great service, such as opening my presentation room an hour earlier than ‘allowed’ so that I could set up my presentation and still attend the important keynote speaker.
In the Satisfiers category, the room was comfortable and functional. I was pleased, but expected to be. There was one ‘Dissatisfier’ – wireless internet was included in the room, though I would have preferred that it not be part of standard, extra twelve dollar a day ‘resort tax’ on the bill. As for Indifference, I didn’t benefit from the live piano evening program in the lounge – I hit the sack early.
Measuring Kano analysis – satisfaction and loyalty
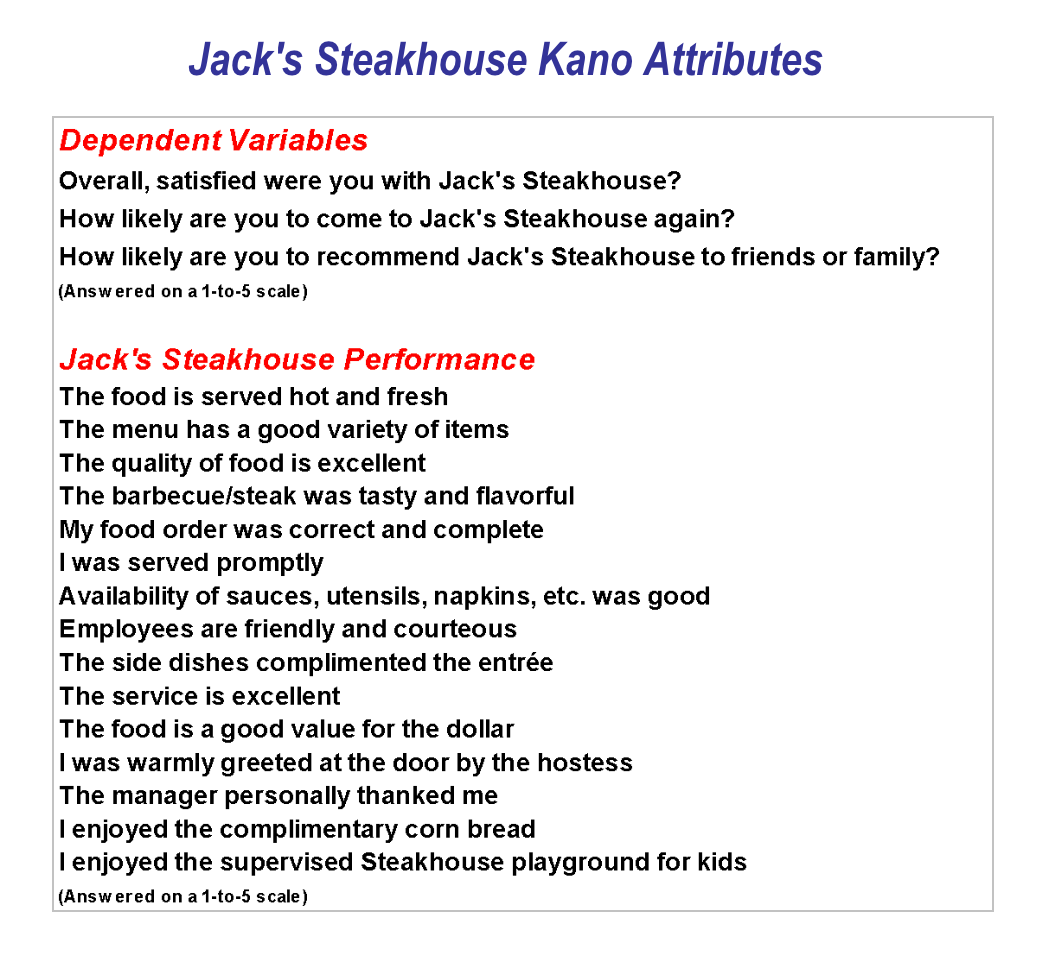
The easiest way to illustrate a direct application of the Kano process is to walk through a sample study. Let’s say Jack’s Steakhouse is a casual dining restaurant featuring barbecue and steakhouse cuisine, one of several chains owned by Colossal Restaurants.
Jack’s Steakhouse wants to conduct a customer satisfaction survey in order to quantify customer loyalty and ascertain their market position vis-à-vis the increasingly competitive casual dining segment. In addition, they request that we conduct a Kano analysis to assess what sets them apart.
Kano Analysis is, in essence, a measure of importance of the features to the customer and performance of the business. Often a standard Importance question is asked in addition to Performance ratings and a dependent variable, such as overall satisfaction or purchase intent. The top of the scale, whether 5, 7, or 10, is ‘Very important,’ and the bottom value is ‘Not at all important’.
For Jack’s Steakhouse, we are looking to establish Kano points that drive satisfaction, but also distinguish the brand. Below is an illustration of how the survey questions are worded. Each of these performance attributes was also analyzed under Stated Importance.
If the project is geared specifically for a Kano measurement, it is recommended that the wording of the questionnaire be as follows for performance attributes:
- Much better than expected
- Better than expected
- As expected
- Worse than expected
- Much worse than expected
Kano’s initial procedure is to determine inferred importance by testing the effect of variable performance measurements against a dependent variable. The dependent variable could be one of several commonly measured, such as “overall satisfaction,” “likelihood to return to the establishment,” or “likelihood to recommend Jack’s Steakhouse to friends or family.”
In Kano and other analyses, we often find that a combination of these dependent variables can be calculated to create a more flexible loyalty score.
This loyalty measure can serve a dual use. For example, if a patron of Jack’s Steakhouse has top box (5) scores for all three of the dependent variables in the survey, we can create a 1/0 measure called ‘Loyalty’.
Or, we can leave the loyalty measure a discrete value, with a range of 1-to-15 (the sum of all three dependent variables). Either of these two can be used in a correlation with performance scores.
Alongside the derived importance score is the mean stated importance:
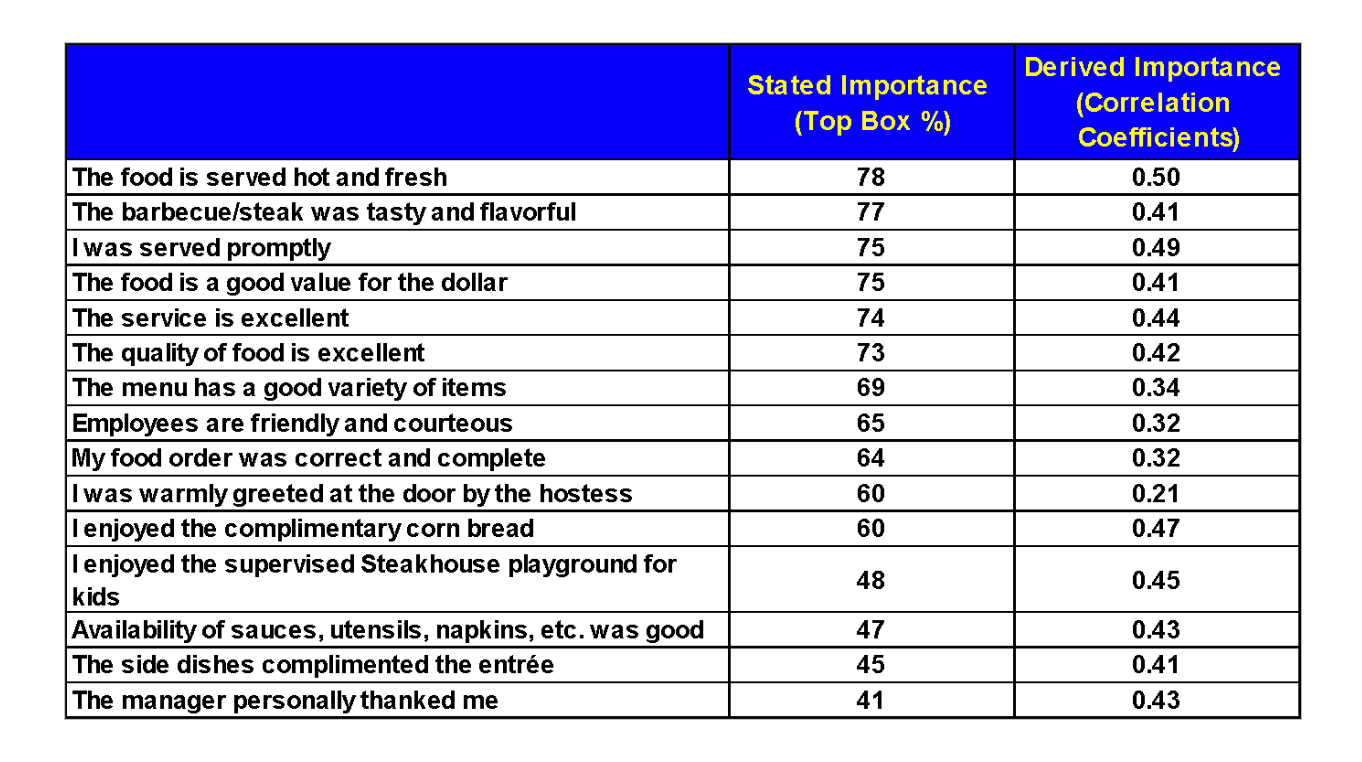
When graphed, with derived and stated importance centered and normalized, a Kano visual illustrates more clearly the Kano quadrants and how Jack’s Steakhouse is perceived by its patrons.
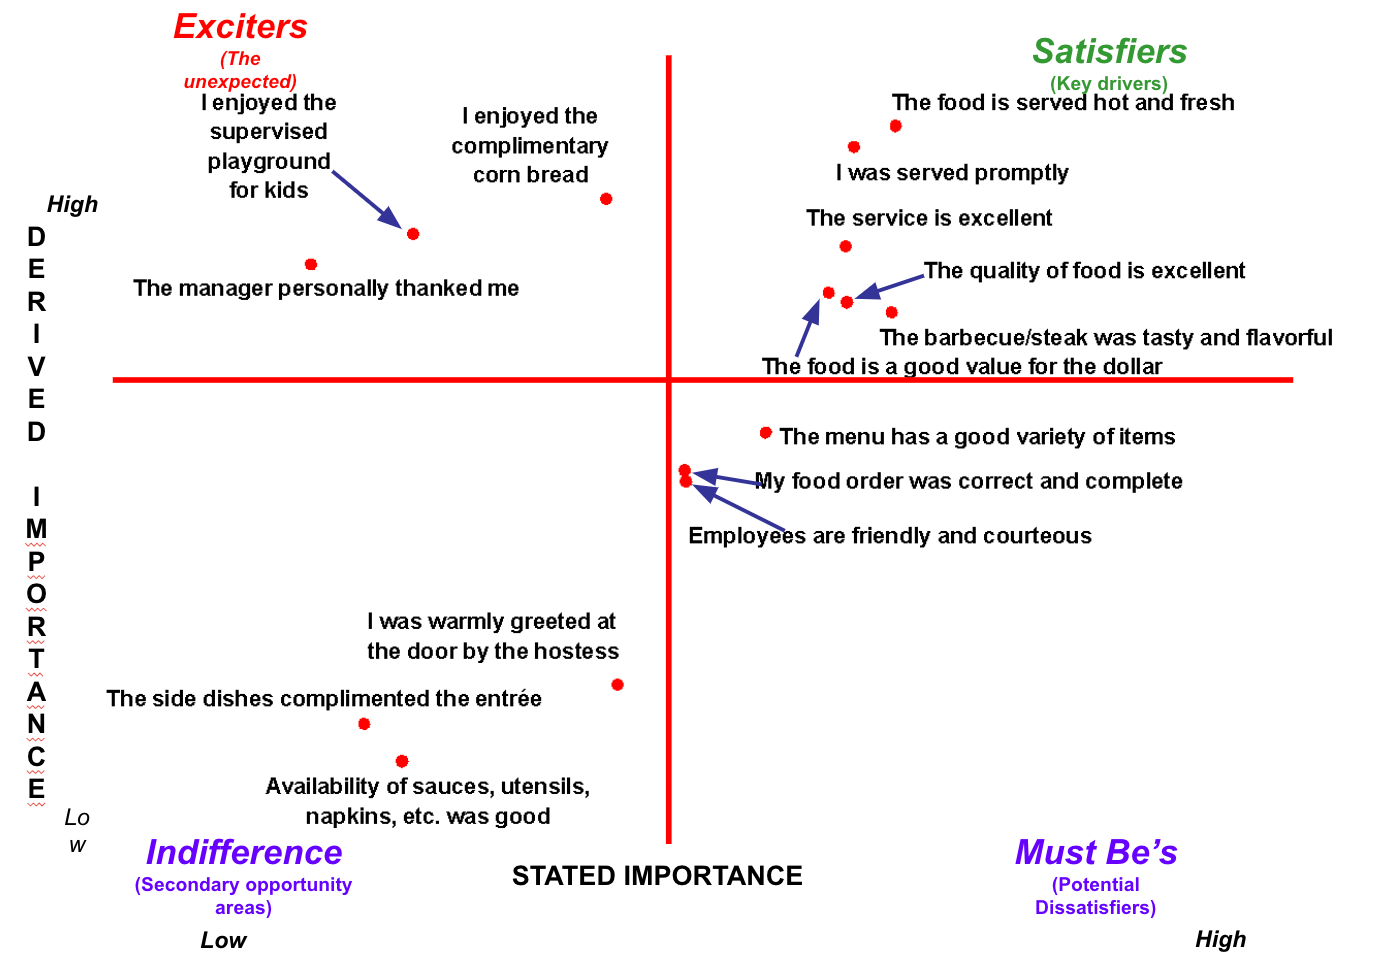
Of course, many of the expected restaurant drivers do, in fact, place in the Satisfiers key drivers quadrant in the upper right hand corner – good food, fast service, good value for the money.
It is the upper left hand quadrant, though, that provides the most insight for Jack’s Steakhouse and differentiates it from other casual dining steak establishments.
One compelling finding is that, although patrons do not say so directly, a greeting from the manager does, in fact, have a serious impact on their overall enjoyment of the restaurant. This small extra effort by local managers could be a key catalyst to drive up dining occasions and sales.
In addition, the Kano process shows that two other attributes help Jack’s Steakhouse to stand out. Most barbecue steak casual dining restaurants do not offer ‘all you can eat’ cornbread. In the competitive, ‘fill up the tank’ culture of American dining, ‘all you can eat’ is a powerful subliminal pleaser. Even though portions at Jack’s Steakhouse are huge, patrons being able to eat all the cornbread they want is a distinguishing feature.
The second distinguishing feature of the study finds that Jack’s supervised, themed play areas are a hit – and not just with the kids. In follow-up interviews, Jack’s Steakhouse learned that parents find the area fun as well, and that they can place their children safely within sight at a supervised fun house. When the food arrives, they saunter over, scoop up the kid, feed him, then place him back in the fun house so that they, the parents, can enjoy the remainder of their meal while the children rumble.
Interesting extensions to Kano analysis
The magic of multivariate analysis and of well-thought out surveys is that more information can be mined and more value added to the key deliverables without lengthening the duration or complexity of the data collection process.
Time is money in market research. There is certainly true for the Kano Model. Below is the outline of a useful addition which expands the informational ‘take’.
Kano Weighting: When analyzing attributes at the aggregate level, some companies develop a weighting scheme based on the results of the Kano analysis.
For example, when combining performance scores into one single satisfaction measure, a company might feel that a ‘must-be’ potential Dissatisfier might be twice as important as an indifferent attribute. Or they might want to give an Exciter a weight higher than a Key Driver.
The utility of such an approach is that the client might want to create a cross-company measure of effectiveness which can be filtered by market, state, region, restaurant, or even which manager is on duty during data collection. We’ll call this measure the ‘utility satisfaction score’.
This newly created Kano performance utility score, combined with the loyalty measure created above (the three depend scores) now gives us the ability to cluster respondents based on their utility satisfaction score and loyalty measurements. The two measures are then plotted on a graph:
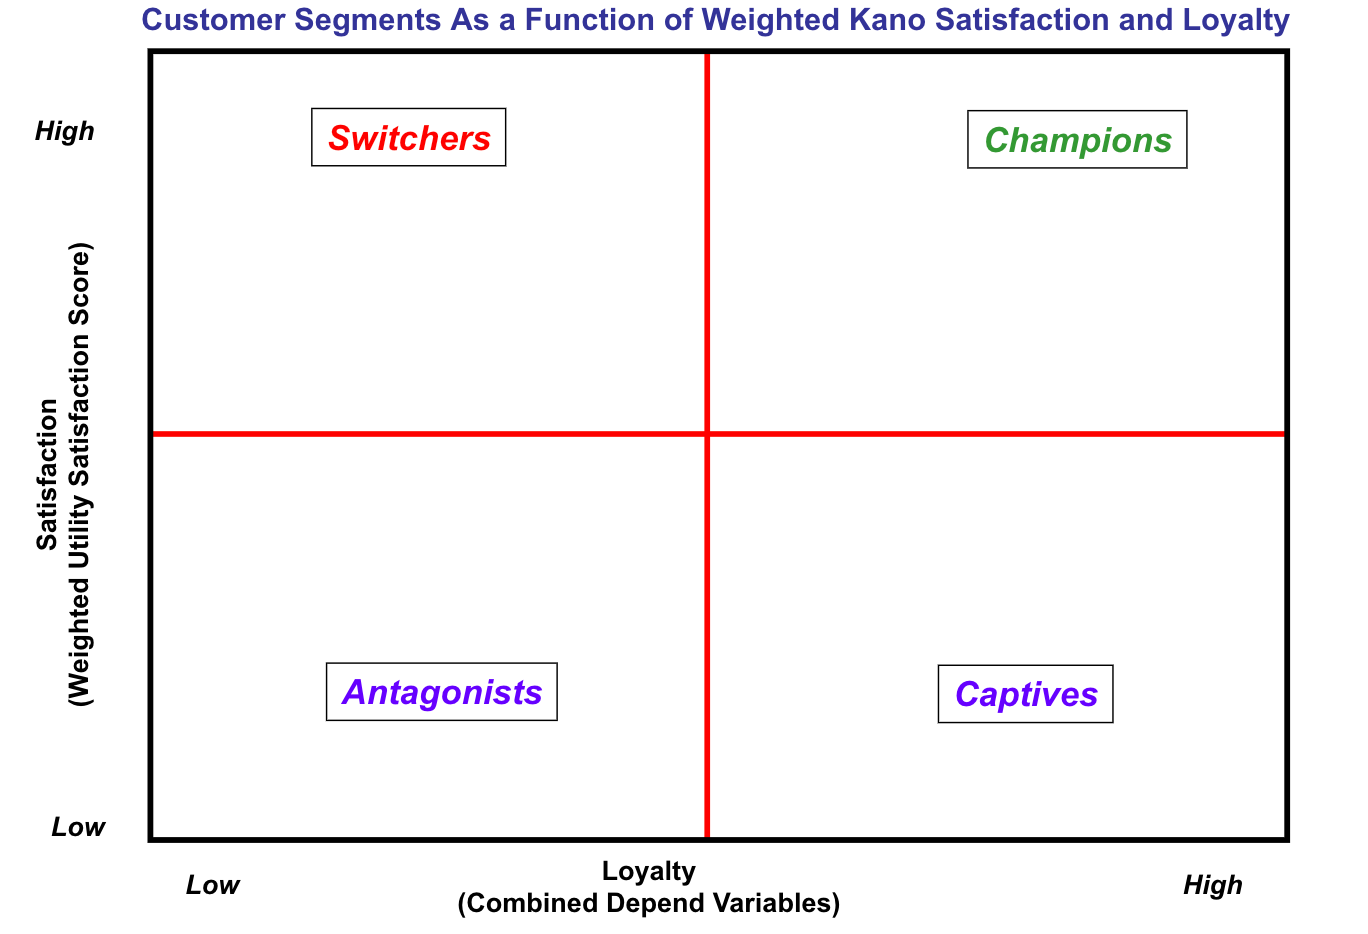
Jack’s Steakhouse Champions are at the top right hand of this graph. Highly satisfied and loyal, these customers are very likely to return often to the restaurant. Continuing research on corporate communications could be a useful follow-up, possibly with customer value modeling to determine different lifetime values for these customers within age ranges.
Switchers, in the upper left hand corner, are frequent casual dining customers – they like Jack’s Steakhouse, but they as equally likely to visit a competitor that provides a similar dining experience, perhaps with better value. Further research can determine how to appeal directly to these people, and perhaps move them to the Champions category.
Captives are the most puzzling of the customer for the executives to grip. They have lower than average utility satisfaction score, but are highly loyal to Jack’s Steakhouse. Are they a flight risk in the highly competitive casual dining market?
Captive customers are not a worry if, say, if they are residents of central Alaska and are unhappy with their local airport. Where else can they go? However, within the realm of Jack’s Steakhouse, they can just drive down the block. How many exist in the market? The question is how many marketing resources should be dedicated to moving these people from captivity to champions.
Finally, there are Jack’s Steakhouse antagonists. These people probably had a bad experience at Jack’s Steakhouse – possibly as a result of being dragged there by friends or family. With these types the restaurant should incorporate the services of an active complaint line, which is known to improve repeat patronage, particularly if they receive a freebee from Jack’s.
Conclusion
Our steakhouse example demonstrates how the simple but powerful the Kano model is useful for understanding the difference between Basic, Performance, and Delighter features.
By designing in and focusing improvement efforts on those features, create customer delight, there is a much greater chance of retaining your current customers and gaining new ones.
Michael Lieberman is founder and president of Multivariate Solutions, a statistical and marketing research consulting firm that works with major advertising, public relations, and political strategy firms. He can be reached at (US) 1.646.257.3794, or at michael@mvsolution.com.