Have you ever left feedback as a customer yourself? Your star rating or a satisfaction score will tell how you feel, but it's your comment that will explain why.
Unfortunately, while most businesses collect feedback, they do not analyze text comments. It’s too hard to read through all those answers to find those that can inform strategy.
In this blog post, we’ll break down the task of analyzing open-ended customer feedback. How can you draw meaningful insights from the text feedback without losing hours of your life to it?
We will also share a spreadsheet template you can use today to analyze your customer feedback.
So read on!
1. Why analyzing customer feedback is difficult
If you ever tried to summarize what people want based on their feedback, you’ll know that it’s a difficult task.
Read 50 to 100 pieces of feedback, and it already feels like Big Data!
You can write a generic summary quickly. But creating a detailed report that inspires others is a job of many days, if not weeks.
There are two key reasons why this task takes a long time:
1. Our language is complex:
People use many different words and phrases to describe the same thing. For example, in a cable TV company's survey, people used 800 different ways to say that the program guide was difficult to read:
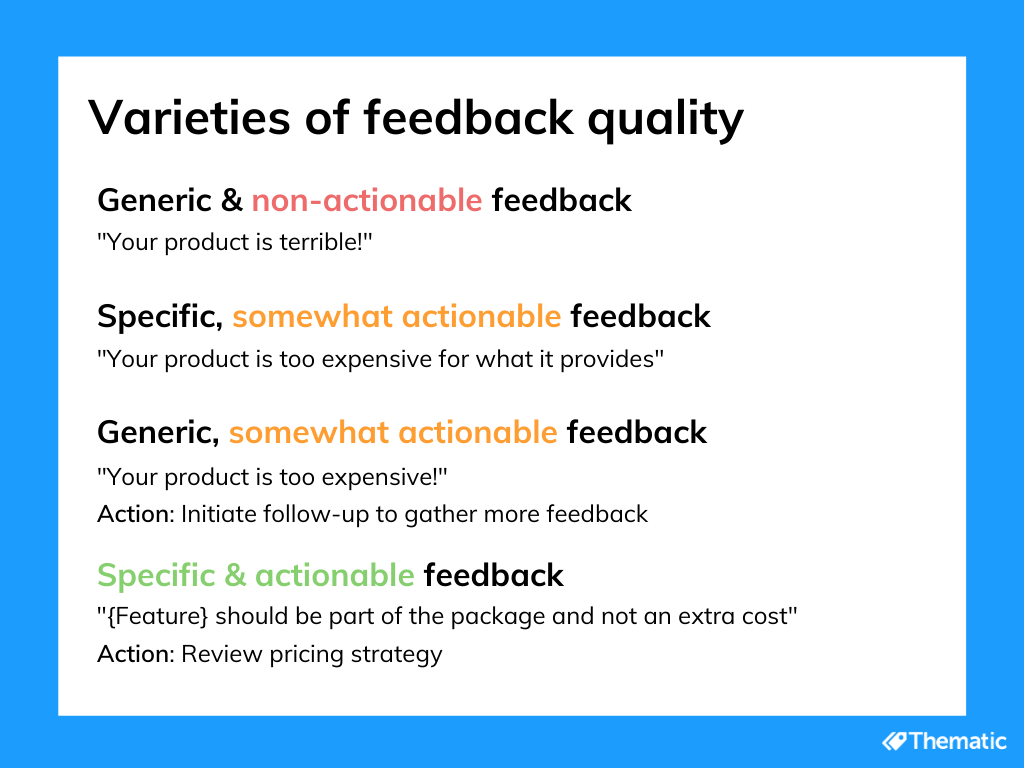
2. Quality of feedback varies:
Feedback might be specific and actionable, or generic and not helpful.
Varieties of customer feedback quality
It comes down to the lack of easy to use tools that automate the understanding of our complex language. You want a perfect mix of automation and ease of use, when it comes to actionable feedback analysis.
Let’s review how to think about analyzing feedback, whether manually or automatically. And then, we’ll dig into the tools.
2. How to ensure customer feedback analysis is accurate and inspires people to take action
Analyzing customer feedback properly is complex. People resort to workarounds such as reading samples or creating word clouds. This gives a high-level overview at best or a scattered feeling for words people use at worst. But it won’t give you the actual data to base decisions on.
Here is how you can deliver analysis that's complete, unbiased, includes language nuance and is actionable:
Use inductive coding.
Don't use a predefined set of themes you’d like to find in feedback. Instead, discover themes as you analyze the feedback. In our qualitative coding blog post, we describe how you can do this in the right way.
Don’t put comments into one bucket.
Most people will have several themes in their feedback. Each theme might have a different sentiment. Make sure your analysis can capture every theme mentioned in each comment.
Use a hierarchy of themes, or a taxonomy.
You can start with some generic themes like “usability issues” at first. Then break them down into more specific themes, since they will be more actionable, e.g. “in-app chat doesn’t work”. If several people mentioned this issue, many more are likely to have it, and it’s worth addressing. A hierarchy will help navigate the themes when reviewing feedback.
Ensure a good balance of themes.
You don’t want to end up with a long-tail of themes, keep the top level of your hierarchy under 20. If it's longer than that, you'll get analysis paralysis.
Make accuracy a priority.
If you are analyzing feedback manually, get a colleague to verify the accuracy of a sample of comments. If you are automating the analysis, compare the top themes picked up automatically vs. manually on a sample. You may find our quick guide on measuring feedback analysis accuracy helpful.
These tips will help you to get comprehensive and accurate analysis. Explain your approach to others. They'll know that your findings are based on data and they'll be more likely to act on the insights.
3. How to analyze customer feedback
Before analyzing feedback, gather all your feedback into one place.
3.1 How to collate feedback in one place
First think: Where is your customer feedback? Here are some possible sources:
Surveys, e.g. CSAT or NPS
Chat interactions
Call center notes
Online reviews
CRM notes
For some of these, you’ll know who the customer was who left the feedback, for others you might not. Capture as much data as possible and link it to each piece of feedback.
For low volume feedback, you can use our free Feedback Collector tool, which you can install in your Chrome or Brave browser. Your team members can highlight a piece of feedback and send it to a single spreadsheet. This works particularly well for capturing feedback your sales & customer success team capture in the CRM.
You can also setup workflows and Zapier integrations. They can funnel feedback from many tools into a database or a third-party solution like Thematic.
But remember, context matters. A comment “Pricing” could mean either “issues with pricing” or "pricing is great" depending on the context. Collate with care.
3.2 How to analyze customer feedback manually
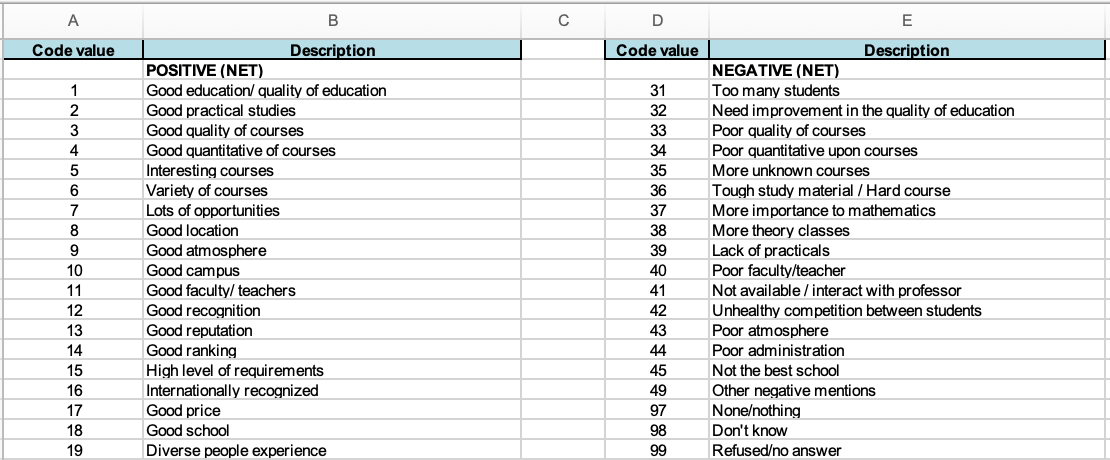
This is how professional coders analyze data manually. You’ll need two spreadsheets. One for keeping your code frame of themes and subthemes. Another for coding each piece of feedback according to that code frame. Use two screens for efficiency.
In this example, a 2-level hierarchy that’s based on sentiment, rather than themes. It gives an idea on how to structure both spreadsheets:
1. Code frame that separates positive and negative themes.
2. Coding each piece of feedback (column E) according to several codes from the code frame.
Another method for manual coding of feedback is described in the article by Intercom. They suggest to use Feedback Type as one of the hierarchy levels, e.g. usability issue, bug, new feature request.
3.3 How to automate customer feedback analysis using a script
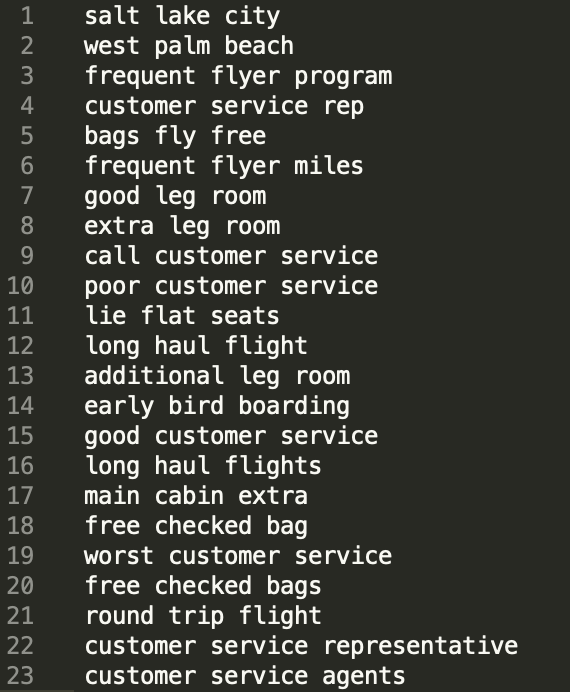
You can automate customer feedback analysis using a DIY script. We’ve already tested different DIY methods on the feedback analysis task. Text categorization libraries, topic modeling libraries and NLP APIs won't take you far. The most effective method is keyword extraction. It can discover meaningful keywords in your data.
You can adopt an existing keyword extraction script such as Kea or Rake to your needs. Here is a tutorial on this topic to help you get started.
On our test dataset, the phrases that this approach returned looked significantly more useful, compared to other DIY solutions:
One issue is that these are key phrases and not themes. You want to merge and organize them further. You would need to expand the script to do this, which requires help from an expert.
3.4 How to automate customer feedback analysis using third-party software
There are many specialized solutions for automating customer feedback analysis. Some are more DIY than others. This includes:
Voice of Customer platforms like Qualtrics, Medallia and Clarabridge.
Feedback analysis solutions like Thematic.
For example, Nvivo has both manual and automated methods for coding feedback. It’s targeted at researchers.
A solution like Clarabridge has specific industry taxonomies for different industries. It’s targeted at large enterprises.
Thematic is a solution that sits in the middle. Built specifically for customer feedback analysis it’s made for teams at data-driven companies.
Thematic’s AI discovers themes (not just keywords) bottom up in your feedback and then you can edit them easily:
Thematic ensures consistency of themes over time. But at any point you can change them and re-analyze the data to suit your team’s purposes.
Unlike Voice of Customer platforms Thematic doesn't have survey capabilities. Instead, it helps unify data regardless of feedback channel. It's key benefit is deep analytics. Thematic visualizes feedback in a way that answers key business questions.
3.5 How to present the results to drive actions
Want to drive results based on insights from customer feedback? You need to treat qualitative feedback like any other hard data. If you’ve followed the instructions above, you have converted your text into numbers. You can now visualize them with ease.
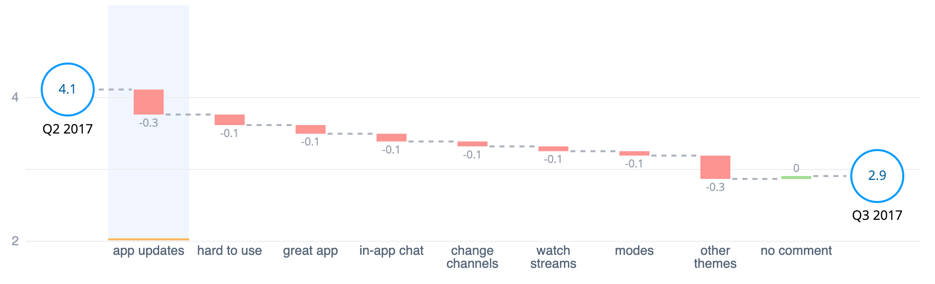
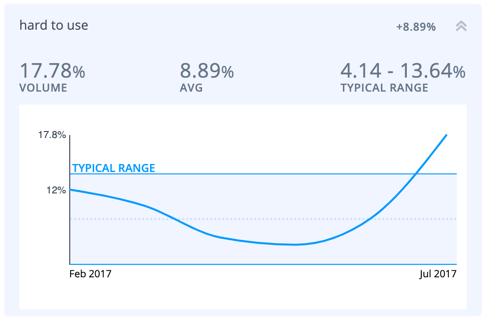
Here is how we visualize feedback at Thematic:
Why did my score drop?
What are our emerging negative themes?
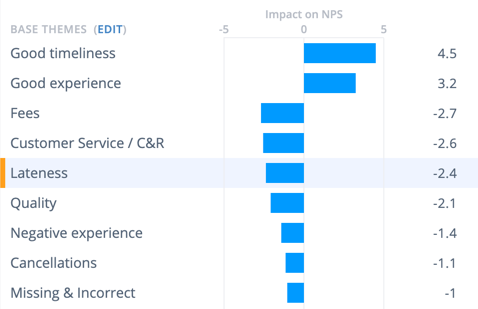
What should I work on next? Theme impact on NPS score.
As you can see, each visualization is purposefully designed to answer specific questions.
If you opt for a DIY solution, you’ll find most of these charts in Excel: a bar chart, a line chart, and yes, even a waterfall chart. You can and should analyze feedback consistently, accurately, and visualize it meaningfully!
In fact, to make things super simple for you, we’ve built a DIY spreadsheet template. You can use it to analyze your customer feedback for a typical NPS survey. You can also use it to implement the whole process (manual or semi-automated) of feedback analysis and visualizing the results.
Conclusion
You might now want to start analyzing feedback manually. Then try out a script. Or test out a third-party solution.
In any case getting actionable and accurate insights is key. Keep this in mind!
And if you are interested in automating your customer feedback analysis, you can get started with Thematic for free.
Share
Link Copied!
Request a demo of Thematic's Customer Intelligence Platform
Thematic turns fragmented feedback into one consistent source of customer truth — so every team acts on the same customer story. Up and running in days, not quarters.
Thank you! Your submission has been received!
Oops! Something went wrong while submitting the form.