Open-ended survey questions often provide the most useful insights, but if you are dealing with hundreds or thousands of answers, summarising them will give you the biggest headache. The answer lies in coding open-ended questions. This means assigning one or more categories (also called codes) to each response. But how to go about it?
Two Key Approaches to Coding Open-Ended Responses
Key Approach #1: Manual Coding
Manual coding has been invented many years ago in qualitative research. Here, a person codes each free-text response with one or more category. If you are dealing with hundreds or fewer responses, you can do it yourself, or you can hire an agency.
Read our guide on the manual coding of open-ended responses to a survey.
Key Approach #2: Automated Coding
Automated coding has become popular in recent years. This is an area of text analytics, where algorithms are used to do this task. Data scientists could use a generic NLP library, but tuning such libraries is hard, and the results are often difficult to interpret.
Solutions like Thematic use algorithms designed specifically for coding people’s responses. We recently published a white paper explaining the reliability of automated coding and ways of measuring it objectively.
3 Best Practices for Open-Ended Coding
Whether you go for the manual or automated approach, it’s a good idea to learn best practices from people who have been dealing with text for decades.
The main recommendations for open-ended coding are:
Fight Bias
Don’t start with a conceived notion of what you are hoping to find. Make sure categories or themes emerge from data rather than are pre-defined in advanced.
Provide Coverage
Make sure that the code frame covers a wide range of contrasting categories. For example, a technology company may have categories related to the UI of the product, customer service, the brand itself, stability, specific features and so on.
Ensure Consistency
If new categories emerge over time, all previously coded responses need to be re-analyzed. Keep iterating until each customer response is tagged with all themes present in the dataset.
Making Sense of Customer Comments in Surveys
How to use coding results to make sense of customer comments in surveys?
Either you will use an existing dashboard, or you create one yourself using Excel, Numbers or Tableau.
(Still undecided whether to use Power BI or Tableau? Read: Power BI vs Tableau)
Here are the key things you need to capture:
- What is the overall importance of each category in your code frame?
- How do these changes depend on the segments of data?
The best chart to capture this is the old good bar chart. Here is an example of what it could look like in a custom dashboard:
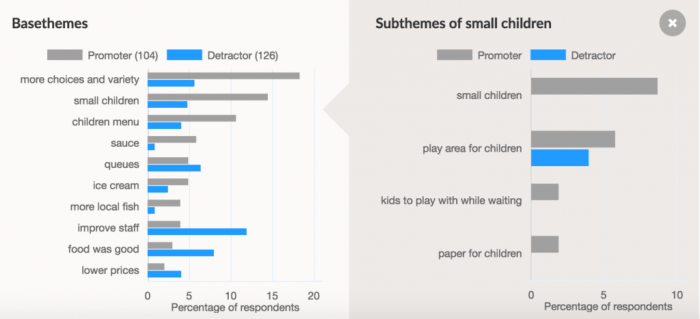
Example of comparing themes of Promoters and Detractors
And here is an example of how it could look in Excel or Numbers:
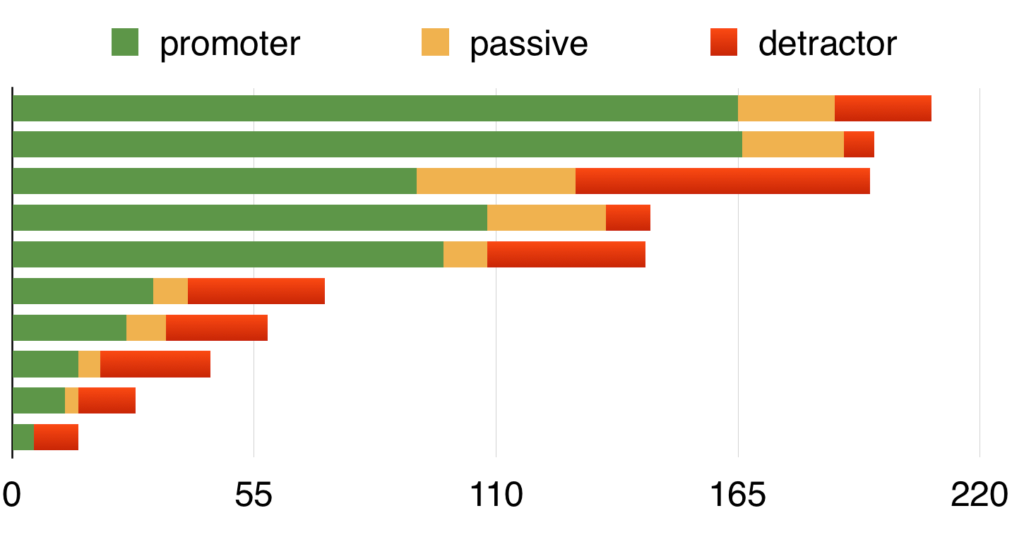
Comparing theme distribution for Promoters, Passives, and Detractors using Numbers.
Conclusion
Of course, what it looks like is not as important as whether the analysis is accurate and useful.
For more ideas, check out our article on effective Net Promoter Score analysis. The lessons will apply to other types of customer satisfaction surveys.


.webp)


