In this article, we explain how to evaluate the accuracy of coding survey responses. Whether coding is manual or automated, we recommend using the same method and explain here how it works in practice.
Why measuring the accuracy of coding matters
Responses to open-ended questions in surveys are full of valuable insight, but they need to be coded because of how diverse our language is. Traditionally coding is done by people, which has several disadvantages:
1. People are inconsistent in their choice of codes
2. People bring their personal bias into what matters and how they interpret responses
3. Human coding doesn’t scale well
Automated coding, on the other hand, has one key disadvantage: lack of accuracy! If only we can prove that automated coding can be as accurate as human coding, this would be a huge step forward.
The Coding Consistency
Since people’s interpretations differ and coding is subjective, not all people are equally accurate and consistent. We should start by measuring human accuracy by comparing people’s coding results with those produced by other humans. In Information Science human performance is captured by measuring the inter-indexer consistency using a formula like Rolling’s consistency [1].
Given two sets of items A and B, for example, two code frames, or two sets of codes for a given piece of customer feedback, Rolling calculates the agreement as 2C/(A + B).
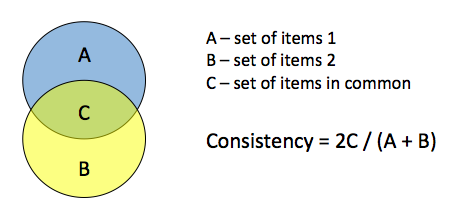
This formula returns 0 if the two sets have no overlap, and 1 if they are identical [2].
For example, let’s say a piece of customer feedback is represented in this survey comment:
“I was impressed by how friendly the person on the other end of the line was. They resolved my problem fast and efficiently and made sure I received a refund. But I’m disappointed that I had to wait for two weeks for the refund”
One coder decided to code this as friendliness, call center, refund. The second coder decided to code this as friendliness, efficiency, customer service, and refund.[3] So we have, C = 2 (friendliness and refund), A = 3 and B = 4. The Rolling consistency of these two coders on this comment is:
2 * 2/(3 + 4) = 4/7 = 0.57
Three Approaches to Measuring Consistency
There are three different ways of measuring accuracy using consistency:
1. Consistency of applying codes from a given code frame.
As in the above example, if you have a pre-defined code frame, for each survey response you can compare the two sets of codes. The consistency will depend on the size of the frame. If there are only 5 or 10 codes, higher consistency is easier to achieve. If there are dozens or even hundreds, expect much lower consistency values.
2. Consistency of the code frame.
If you have a set of responses to an open-ended question in a survey, what would be a meaningful set of codes? It can be a flat set or a hierarchy. Here, the consistency will depend on the clarity of the instructions for this task.
3. Consistency of the most popular codes.
If you have a set of responses to an open-ended question in a survey, what are the most popular codes? Not all codes matter when it comes to determining insights in customer feedback. The consistency in determining which do depends on the personal experience of the coders: how familiar are they with the subject of the survey, and what are their personal views.
The first approach is granular and accurate but difficult to implement. The third approach is the easiest to implement but is more error-prone. Given the first approach, one can always calculate the most popular codes and their relative importance, which will provide a more complete and accurate picture.
So, how does one evaluate the accuracy of an automated solution?
In our view, when it comes to measuring the accuracy of an automated solution, one should treat an algorithm just as one would treat a human coder. First, make sure to use 3 or more coders in order to use their consistency as the baseline (or as an ideal scenario). Second, for each coder and the algorithm, calculate the consistency with each other coder individually, then average the numbers across all responses. The result can be a ranked list showing just how accurate are people among each other and how algorithm stacks up against human coding.
At Thematic, we care deeply about providing accurate results and are constantly testing ourselves against human coders. Recently, we reported how accurate our results are compared to four people on the same NPS survey of university students.
[1] We use the original paper on indexing consistency by L. Rolling. There are also other ways of measuring human agreement, such as the Cohen’s Kappa and the Krippendorff’s Alpha. However, they are not suitable for coding survey responses, where each response can have multiple codes.
[2] For other ways of measuring consistency and how they are related to each other, and the F-Measure popularly used in evaluating search engine performance, see Medelyan and Witten (2016).
[3] In this example we assume that coders used a fixed code frame and it was impossible to choose a similar but different code, e.g. customer support instead of customer service.


.webp)


