Accuracy study - coding open-ended questions in a Net Promoter Score survey
Four students and several algorithms attempted to make sense of responses to open-ended questions in an NPS survey. How well did they do?
Four people and several automated solutions were tested on a task of coding open-ended questions in a Net Promoter Score (NPS) survey. Their task: figure out the five key reasons behind an NPS survey and the five areas that could be improved. Here, we compare their performance using an academic metric of consistency.
250 students at a Swiss business school responded to a classical NPS survey with a scale question How likely are you to recommend the business school to someone choosing their third-level studies? and two open-ended questions Why? and What should the business school improve?
An accuracy study was set up to test the ability of people and algorithms to make sense of answers to open-ended questions. Four students have read the comments and created a list of the five most popular answer categories (or codes). First, we test people’s accuracy by comparing each person’s codes with those suggested by their peers. Second, we compare Thematic with each of the four people and test its accuracy using the same metric. We use the Rolling consistency, a popular Information Science metric. This metric can be applied to evaluate coding of survey responses. [1]
How accurate are people when it comes to making sense of answers to open-ended questions?
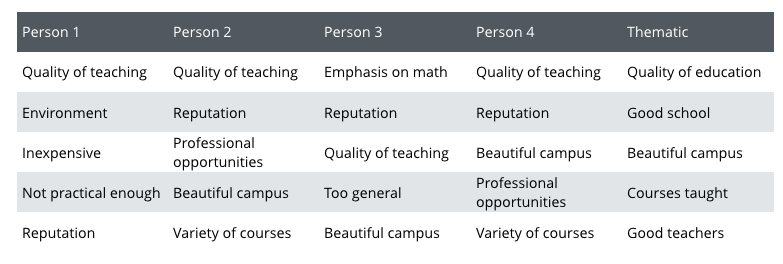
For Question 1. Why did you give us this score? people came up with these five codes:
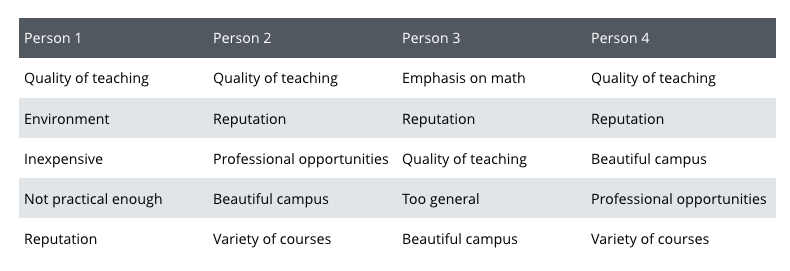
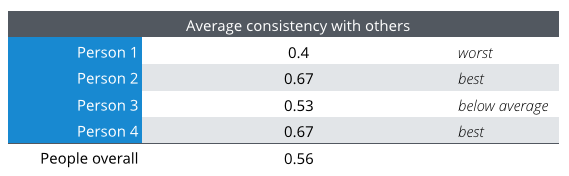
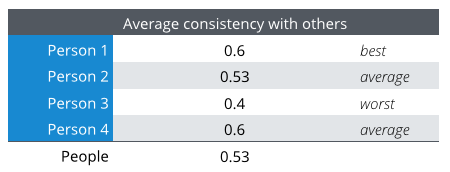
To show how the scoring works, let’s test the answers of Person 2. Following the consistency metric, Person2 and Person1 get a score of 0.4, because they have a total of two codes in common (Quality of teaching and Reputation): 2 x 2 / (5 + 5). Person 2 and Person 3 have three codes in common and get a score of 0.6. Person 2 and Person 4 chose the same five codes and get a score of 1. If we average this, Person 2 is 0.8 consistent with the peers. After testing each person in the same manner, we get the following ranking:
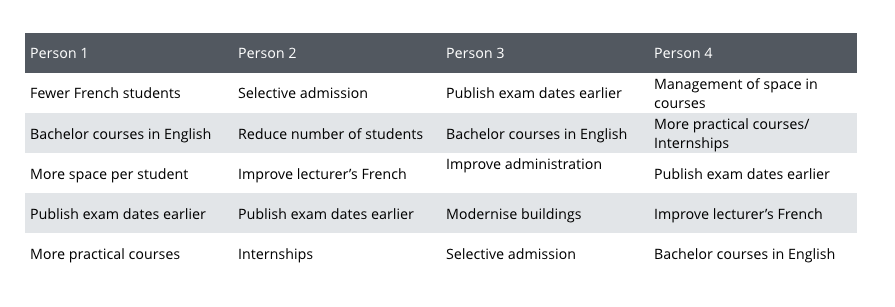
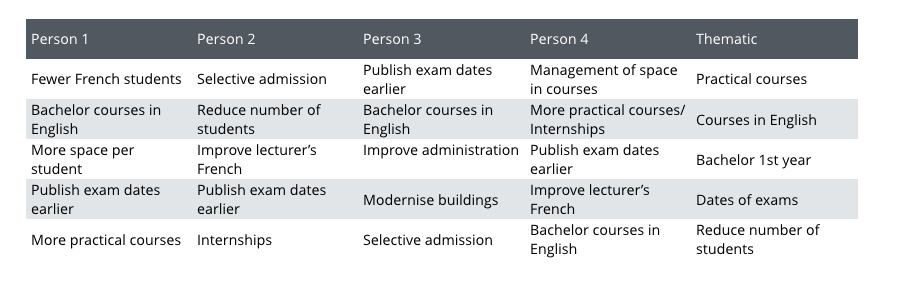
For the Question 2. What should we improve? people’s answers were more diverse and the consistency scores are slightly lower:
Here are some observations that we made from this experiment:
1. The consistency of some people is remarkably high given that they could have chosen any category (there was no fixed code frame). Person 2 and Person 4 selected exactly the same categories for Question 1.
2. The consistency varies significantly, showing just how much subjectivity and bias there is in people’s choices.
3. The bias is not a personality trait. It is situational: Person 1, who had the lowest consistency with peers on Question 1, has the highest consistency on Question 2.
In conclusion, people’s summary of the most important categories in survey answers need to be taken with caution. The element of human error can be considerable.
How accurate is Thematic when coding answers to the same survey?
Before we start testing Thematic, let’s briefly review how it was used.
Thematic’s solution is unsupervised. This means, just like the people participating in this study, Thematic algorithms were not instructed to look for specific themes. However, thresholds that capture the limitations of the language model were adjusted once we could see Thematic’s first attempts to code. Thematic automatically suggests a two-level hierarchy of categories (a code frame). It then codes each response with one or more categories from the final code frame. The most frequent five base categories were used to compare with people’s categories.
For Question 1, Thematic chose: Good teachers, Good level, Quality of education, Beautiful campus and Good training. These top 5 capture two of the themes that most people selected: Quality of education and Beautiful campus and the average consistency that Thematic achieves with the four people is 0.4 — the same as that of Person 1.
For Question 2, Thematic chose: Courses in English, Dates of exam, Practical courses, 1st year and Teachers teaching. These top 5 capture three of the themes that most people selected: Courses in English, Dates of exam, and Practical courses and the average consistency that Thematic achieves with the four people is 0.53 — better than that of Person 3, and almost as good as that of people on average (0.5).
Introducing Manual Refinements
Unlike many black box solutions, Thematic is a transparent system which means that a person can easily adjust the results. In order to remove the redundancy from the top 5, a human reviewer spent 30 min merging some of the themes (e.g. Good teachers and Good training became sub-themes of Good education) in a drag-and-drop Thematic Themes Explorer UI, before being exposed to other people’s themes. Here are Thematic’s categories post review, side by side with people’s categories for Question 1:
And for Question 2:
Now we can test Thematic just like we tested people, using the same consistency metric. People’s category names were normalized before matching, and we did the same for Thematic. Similar names were treated as the same: Quality of teaching = Quality of education, Good school = Reputation, and Courses taught = Variety of courses.
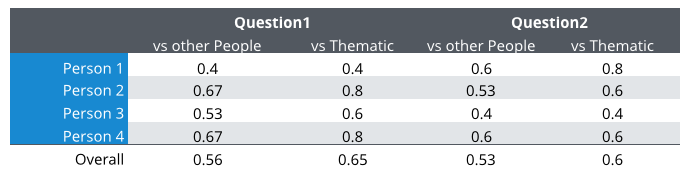
On Question 1, Thematic’s consistency with people increased from 0.4 to 0.56. Now, it’s better than both Person 1 and Person 3. On Question 2, Thematic’s consistency with people increased from 0.5 to 0.6. It’s better than three out of four people. Overall, Thematic is more consistent with people than they are as a group: 0.65 vs 0.56 on Question 1, and 0.6 vs 0.53 on Question 2. A truly remarkable result.
Let’s look at all categories that people thought were important. For each category, we show whether Thematic chose it among its top 10. If yes, we show which sub-themes it grouped under this category:
Question 1: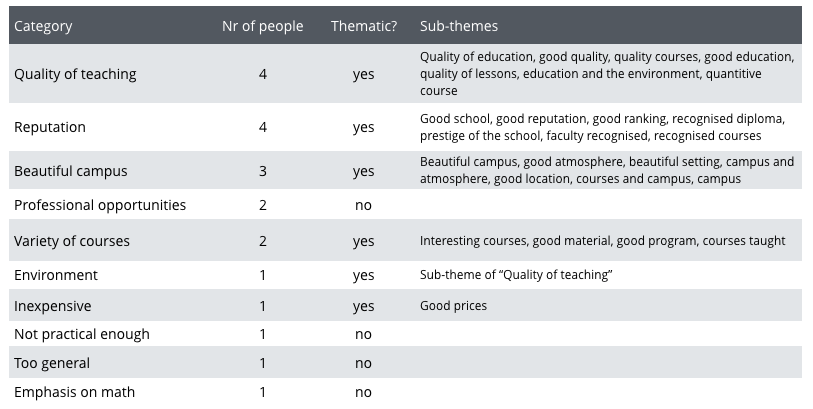
Question 2:
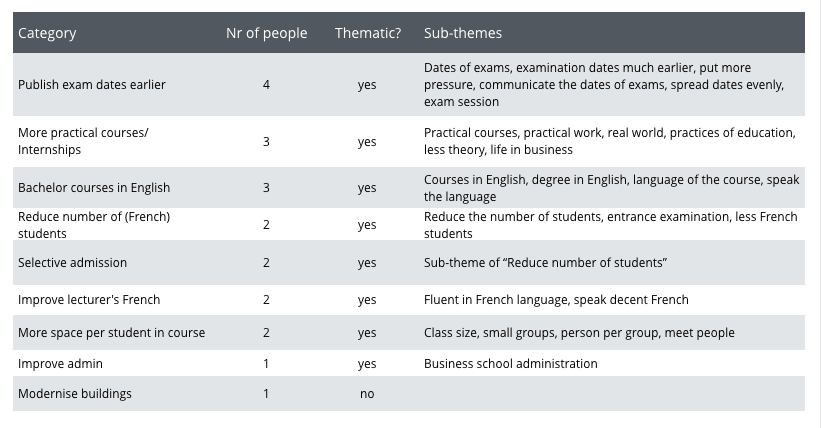
Thematic correctly selected all categories that were suggested by at least two people, apart from one. It missed Professional opportunities which was chosen by two out of four people.
In addition, other interesting insights emerged from Thematic’s groupings. Students suggested to not only publish exam dates earlier, and communicate them well, but also to spread the exam dates evenly. We will discuss other insights found using Thematic in a separate post.
How accurate are competitive products when coding answers to the same survey?
We are lucky that we did not have to test other competitors on this data. Maurice FitzGerald has already compared them in his excellent post which also outlines criteria for the evaluation of text analytics solutions. He compared the same group of four people to DataCracker, WordyUp, Wordclouds.com, Sift Keatext, SurveyTagger, SPSS, Lexalytics, MeaningCloud, Text2Data and HP’s HavenOnDemand. Maurice is a former VP of Customer Experience at HP. Here is a summary of his findings relevant to this study:
- Most systems performed poorly because they can only extract the most relevant single words.
- Best performing systems were Lexalytics and HavenOnDemand. However they both missed Publish exam dates earlier, the most important improvement suggestion (which Thematic did find without manual intervention).
- People were by far better than any of the tools. This demonstrates that Thematic would beat any competitor on this task, even pre-review.
Why is Thematic so accurate?
NLP experts built Thematic specifically for the analysis of survey responses, unlike other solutions. And when we say experts, we mean it. Dr. Alyona Medelyan has a Ph.D. in keyword extraction. Plus her thesis has proven that algorithms can be as good as people [2] when it comes to identifying the most important topics in documents. With the latest advances in Deep Learning and AI now this is also possible for survey responses.
Accuracy is also ensured by allowing a person to refine Thematic’s original choices: themes can be regrouped, renamed and deleted. This refinement is optional because even without help Thematic gets 80-90% of the way.
Thematic has also other advantages compared to traditional text analytics solutions: It learns the use of language from all of the survey responses it processes over time and it does not require pre-defined categories or annotated data. Want to see how accurate Thematic is on your survey results?
[1] Metrics that simply calculate the number of answers in common have been criticised in the literature on inter-coder accuracy. This is because they do not take into account the number of times coders would have agreed by chance. This reason does not apply here. There was no fixed code frame in this particular study. This means that coders could have chosen anything mentioned in the 250 survey responses. The agreement by chance is extremely low, which means that the Rolling consistency is an appropriate metric.
[2] In her Ph.D. thesis Human-competitive automatic topic indexing, Medelyan has shown that choosing the most important topics in a document, whether as free-text keywords or terms from a controlled vocabulary, can be done as well as, or better, as people by combining advanced linguistic analysis with Machine Learning.

Stay up to date with the latest
Join the newsletter to receive the latest updates in your inbox.