This post contains (almost) everything you need to know about customer survey design. When designing a customer survey, as with anything, planning is key. As the saying goes, if you don’t plan, you plan to fail.
It can be useful to think of the end-point and going backward when planning. What insights do you want to get? And how to design our survey questions so that we can achieve those outcomes?
To best design a successful survey, I want to introduce you to the 4 steps for a successful survey design. I hosted a webinar with Dr. Jenine Beekhuyzen, author and Director of Adroit Research, on this exact subject, and here are the learnings:
4 Steps to Customer Survey Design
We'll go into detail for each step - this is a very thorough guide, so I've provided a quick overview / TL;DR at the end of the piece, as well as a handy FAQs section.
Need to focus on a particular survey design step? Jump ahead with these links: Plan, Design, Collect, Analyze.
1. Plan for Customer Survey Design Success
There’s no better time than now to start thinking about how happy your customers, clients, or your staff (or whoever you’re surveying) really are.
What you usually want to pinpoint are their positive versus negative experiences.
What is it that they actually want rather than what you want? We need to find somewhere in the middle.
Often, we go with certain assumptions about what we want to learn, but it's also important to think about whether that’s all we want to know.
Do you want to give your survey participants the opportunity to share their ideas?
You need to get to know them as much as possible. Some people are shy, while others are forward with sharing their ideas. Ideally we need to create an environment where everyone feels comfortable.
Things you can investigate:
How happy are your customers/clients/staff?
What do they want?
Get to know them and their needs.
What do you want to know?
Will your questions confirm your assumptions or explore new ideas?
Top 7 tips on planning your survey
1. Keep it short!
If there’s one top tip when designing your survey, it’s this: remember to keep your surveys short. Only include questions that you are actually going to use.
Lots of questions seem useful, but they can actually negatively affect your survey results. Often we include redundant questions that don’t contribute to the main problem we want to solve. The survey can be as short as three questions, and that’s fine.
2. Use open-ended questions first
To avoid enforcing your own assumptions, use open-ended questions first. It's common to start a survey with checkboxes or lists, but these can be intimidating for survey respondents. An open-ended question feels more inviting and warm – it makes people feel like you want to hear what they want to say and actually start a conversation.
3. Ask questions to reveal main problems
Pretty straightforward, your surveys will reveal what areas in your business need extra support or create bottlenecks in your service.
4. Use surveys as a way to present solutions
Think about using surveys as a way of presenting solutions to your audience and getting direct feedback on those solutions in a more consultative way.
5. When to send your surveys?
It’s important to think about the timing of your survey. Are you sending your survey at 8 in the morning when staff arrive, just about to start their working week?
Or are you sending it Friday afternoon, when people find they have less to do and perhaps are more inclined to respond? Consider when your audience is most likely to respond to your survey and give them the opportunity to do it at their leisure, at the time that suits them.
6. Incentives drive 5-20% increase in responses
Oh yes, the big question – to incentivize or not? There’s a lot of discussion around this. If incentives are done well, they shouldn’t skew the accuracy of the survey results.
Can prizes skew satisfaction scores? As long as your survey is consistent and the focus is not on the score itself, but on the open-ended question, including prizes should work.
It comes back to what’s in it for them (your respondents). What incentives would motivate your participants? Is this monetary, or is it having their say and being part of the conversation? Sometimes, that's enough.
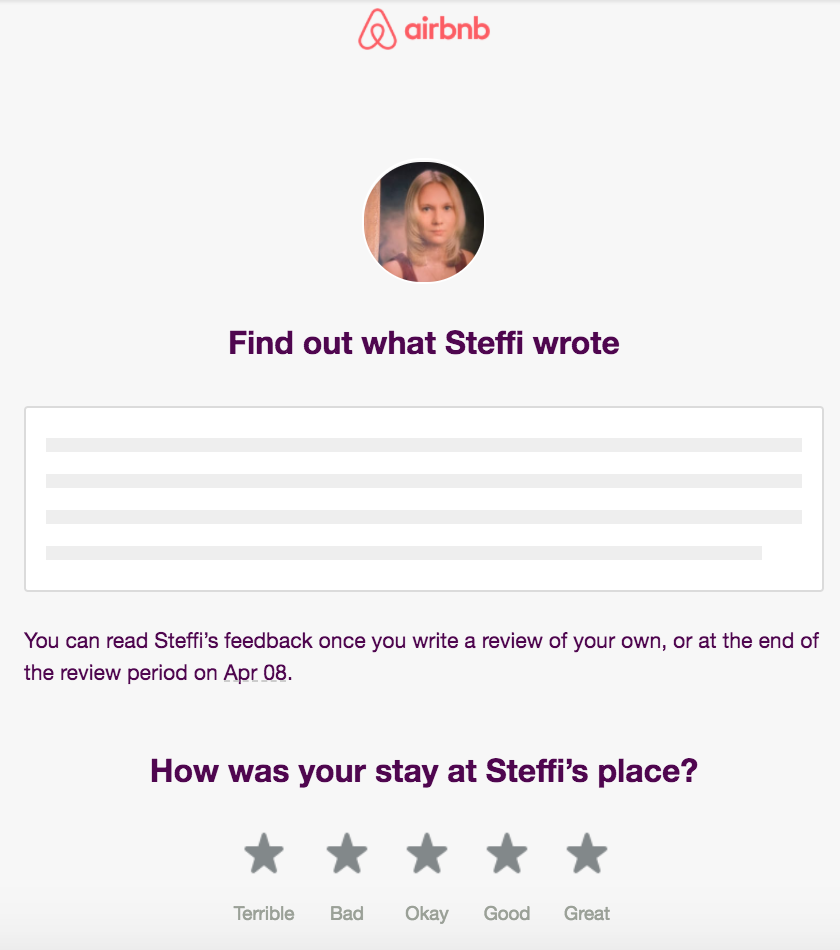
Here’s a great example of how Airbnb incentivizes its customers to leave feedback.
You won’t learn what your host thought of you as a guest until you write your own review of the host. You're further incentivized because how you're rated has a knock-on effect when using Airbnb in future.
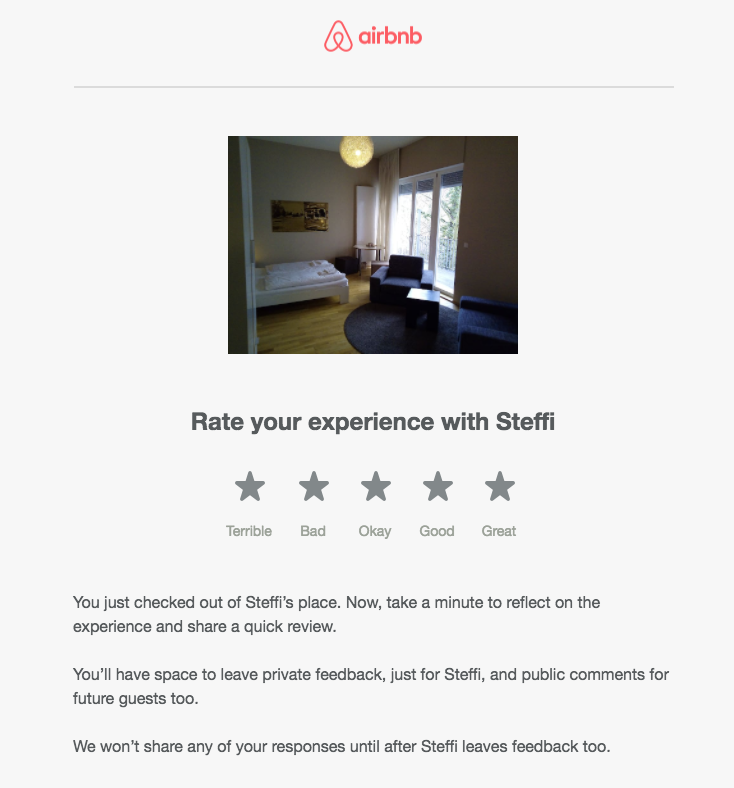
Airbnb encourages the customer to fill out the survey by showing a picture of the accommodation where they stayed, creating an emotional connection with the experience. Again, the customer is more likely to fill out the review.
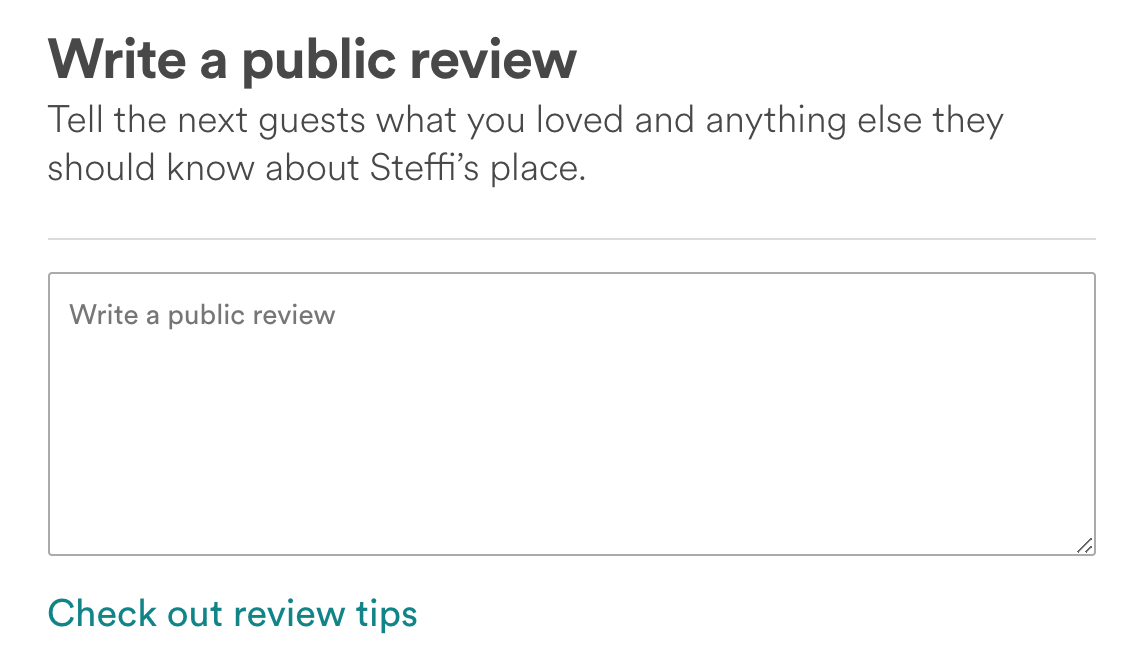
Also, notice how they use the word “you” a lot. And, the way they’re writing in a very simple and concise way. Once you click through, they ask you to tell the next guest what you loved and anything else they should know about this place.
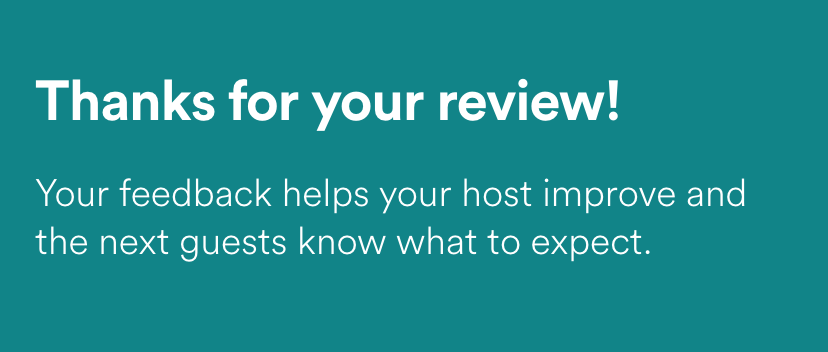
And then thanking them, super simple.
They don’t just use a lot of “you’s” but also “we” implying there is a relationship and a mutual benefit in reviewing. Closed and open-ended questions are mixed in a page without the need to scroll between them.
Using a star rating system is a very familiar tool for most people. Nowadays, you could also try using to emojis instead of stars.
7. Question the Questions
Interrogate your questions to identify which ones you could find the answer to somewhere else, or those you're unlikely to use. The most common culprits are things like people’s gender, age, background, ethnicity, email address, and how long they’ve been a customer.
Shorten the survey where possible!
Really think about the wording of your questions: Does it appeal to your audience?
This can make a huge difference in how people respond. If you can, I strongly recommend piloting your questions with a small group of people.
You don’t want the scenario where people don’t respond simply because they didn’t understand a question or didn’t understand what is expected.
For each question in your survey, consider:
What insight am I hoping to get from this question?
Is it likely to provide useful answers?
2. Survey Design – Receive Authentic Responses
Now, let’s talk about how to receive authentic survey responses through good survey design.
There are several different ways to present answers or possible answers.
If you have 5 response options, the intensity should increase from one end to the other. In the example on the left-hand side (above), technically speaking “Slightly important” and “Somewhat important” are both subcategories of “Not very important” and the placement of these options can confuse respondents and lead to incorrect results.
You need to explicitly label each option as clearly as possible. So, in the example to the right we can see that “Very important” conveys less intensity than “Extremely important”, and more intensity than “Slightly important”.
Key takeaways when designing your survey
Open-ended questions = more insightful answers
Closed questions = easier to respond to, easier to analyze
The best approach is to use a mix of questions
It’s more compelling to answer different types of questions
Multiple text boxes can be intimidating
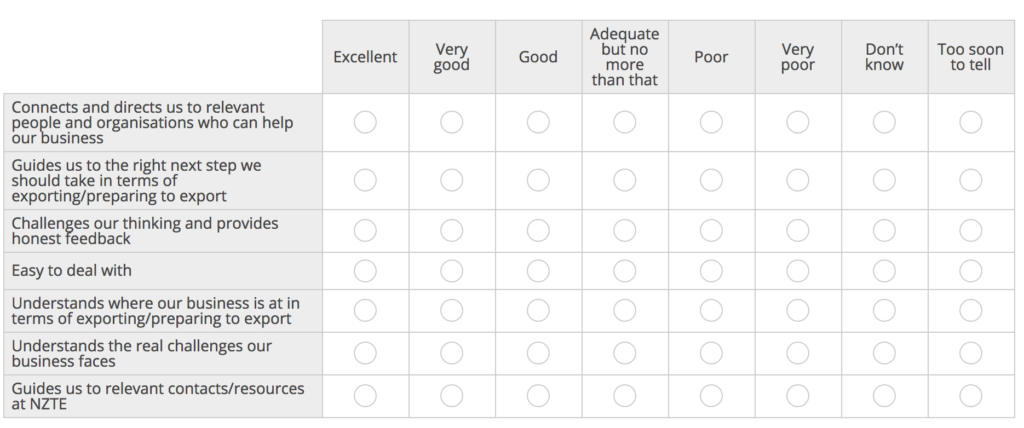
I was recently invited to fill out a survey where I was presented with a wall of radio buttons. As a respondent, it made me worried that I’d select the wrong row and I didn’t feel the buttons made a lot of sense:
The additional column at the end, which does not “increase the intensity” of the response but instead presents two alternative options, were confusing.
Using Scales Questions Correctly
Key risk: confusion and inaccurate data
When it comes to scales, consistency is absolutely key. When people are faced with the example above, where you have a so-called Likert scale (a scale used to represent people’s attitudes to a topic), but then you have another option or options, it can be extremely confusing, as can mixing up different scales.
Use the same scale throughout your survey
Think about which scale suits your organization? Then stick to it, so that when we survey people, again and again, they are used to our formula already. In the Likert scale 1 to 5, 5 should always be “good” and 1 should always be “bad”, again for consistency.
Explain the meaning (is 5 good or bad?)
When it comes to scales, here are a couple of other examples. Dichotomous scales are very black and white, there is no room for “maybe” or “neutral”. In rating scales there is a range, so on a scale from 0 to 10 we’re trying to find out how people are feeling, and it allows for a range of answers.
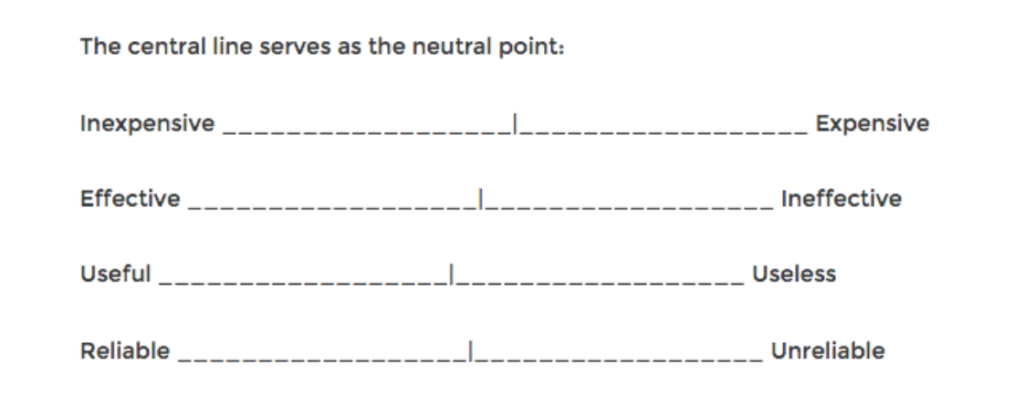
Semantic differential scales are useful to identify people’s attitudes. They can be a bit harder to analyze, but in terms of data capture, they give you the most nuance and the most breadth.
3 Types of Scales Questions
1. Dichotomous
Yes/No, Agree/Disagree
Allows for no nuance
2. Rating scales
CSAT and NPS “On a scale from 0 to 10, …”
Likert scale: 1 (bad) to 5 (good)
Allows for a range of answers
3. Semantic Differential Scales
Best for attitude evaluation
The most nuance
Challenge your assumptions
It’s crucial to challenge your assumptions, as it’s very tempting to make assumptions about why things are the way they are. For instance, why some teachers are excited about certain educational technology in schools, and others aren’t. There is usually more than meets the eye about a person’s background which can affect the scenario.
Jenine says: “We try to collect data from as many people as we can to get different perspectives. Of course, that’s not always possible, but at least it helps to understand why we’re getting the responses that we are”.
Have multiple survey-writers
Multiple survey writers can be helpful here. Having people read each other’s work and test the questions helps address how questions can be interpreted in more than one way.
Set reasonable expectations
Jenine explains: “We should try to encourage reluctant people to participate as they have a very interesting perspective that should be included in the overall data capture. We want to get a reasonable response rate so that we can feel comfortable and confident in the results”.
Choose your survey questions carefully
When you’re choosing your survey questions, make it really count. Only use those that can make a difference to your end outcomes.
Be prepared to report back results and take action
There are so many times I fill out a survey and never hear about it. As an incentive, you can share the results with the participants, in the form of a benchmark, or a measurement that you then report to the participants.
3. Collect – Get the most out of your customer survey
How do we make sure that we get the most data and get the most out of this data?
Collect data from a wide audience
Think about your entire sample: who is part of it and who the stakeholders are. You might need a different plan to engage different stakeholders depending on their role.
Again, it comes back to “what’s in it for me." If respondents don’t see the value, they're not going to participate. This is where the incentives come in, such as reporting back on survey results, allowing participants to see what other people have contributed, or offering a prize or monetary incentive (where appropriate).
Collect data that can’t be directly observed
With surveys, we’re collecting data that we can’t directly observe. You could have informal conversations with people, but it’s difficult to measure these conversations, which is why we collect survey responses.
Often what people say and what people do differ, which is why mixed methods have become a popular approach to research. Respondents are going to tell me what will happen, but what actually will happen may be different.
Always have more than one data source
Make sure to use more than one data source. So, you have the survey, you might also have a chat log and some other way of collecting qualitative data.
Survey, and then survey again
It’s a good idea to survey different people at different points, for example, dissimilar customer lifecycles and particular times of year and so on.
Good questions to ask could be:
What’s the point of our research right now?
What will it look like in the future?
How do we present it in a cohesive manner to the entire organization?
When to survey and when to interview?
This leads me to the big debate: Should you interview or survey people? As mentioned, for some people, we need a different approach.
At Thematic, we’ve noticed that some companies prefer to use interviews rather than surveys. The interviewer either types responses into survey software or they record the interviews, transcribing them later, or working from their interview notes.
This is a matter of breadth vs. depth. Interviews allow you to contact a smaller number of people but in greater detail. Survey data allows you to explore a wider audience.
Jenine says: “I would recommend based on the published research and the many projects I’ve led, to start with an open-ended question in a survey. Once we’ve asked them what their concerns are in an open way, we can then design a survey to measure these concerns."
So, if you measure “professionalism”, you could interview people to learn what specifically they include under “professionalism” in this context. As an idea, you can pose these as tick boxes in another survey to measure their importance.
How can an interview best augment a customer survey?
The question being: How can interviews augment a survey as part of a wider research process? Remember that an interview can be just 2 or 3 questions – short and concise.
Often we ask very similar questions in the survey, but we get different responses because of the format. It helps to use the same questions because different ways of getting the insights appeal to different learning styles of different people. People who are comfortable sharing their ideas in a survey may be uncomfortable in an interview.
Who should interview?
The person who put together the questions and knows the rationale behind them is the person who should conduct your interview.
Who should they be interviewing? I would suggest finding key informants within the sample who would give us a range of views. You need to play devil’s advocate and get responses across the spectrum so that you can get a range of survey ideas.
How to make it compelling to drive the most insights?
It can be challenging to make it compelling, but key points are to use simple language and use examples. Images work well here. To make it super easy, you can provide samples or examples of responses of the types of answers you received in previous surveys.
How to get deeper insights?
To ensure consistency, we want them to answer the way they want to, but not force them to respond to certain things. It takes a certain skill to design such an interview. Practice, practice, practice!
What survey collection software should you use?
Below is a list of software options that I’ve come across.
For a comprehensive breakdown, read this post on how to choose a survey tool. Inside is a list of the top 10 best survey tools.
Google Forms: is free and straightforward to use. Collects the results into a Google spreadsheet.
SurveyMonkey, SurveyGizmo and TypeForm: inexpensive, user-friendly and they allow you to personalize the survey invite. You can upload a spreadsheet with customer data, from which you can use variables when writing an email, to make it seem more personal.
Zendesk and Intercom: tools for communicating with customers and have options for surveying customers.
Qualtrics: a very popular survey platform that’s been around for many years. It has specific tools for certain types of surveys, such as Promoter.io, AskNicely and Delighted, which are used for NPS surveys. The benefit of these surveys is that they provide a dashboard through which you can see each customer’s response and can follow up with them. The downside is that if you want to change your survey to include additional questions, you’re stuck because these tools aren’t easily configurable. You can also check out this guide to learn about the best Qualtrics competitors.
Also good to know, there are open-source tools for designing your own surveys.
As an example, I recently came across this popup survey while working in our internal company wiki by Atlassian. I liked that it wasn’t intrusive – once I clicked on a number, an open-ended question field appeared. Again, non-distractive, and the pop-up appeared in the same context, so I didn’t need to leave the page. There are open-source packages that allow you to implement similar surveys if you have access to development resources.
4. Analyze: Find answers and insights in responses
Analyze your collected data to find answers to questions and insights. This is what we do at Thematic: we analyze customer feedback to help companies increase customer satisfaction and loyalty, and decrease churn.
Survey design questions to interrogate the data:
When we work with customers, we always recommend starting with questions. Here are some example questions that help interrogate the data.
What are the most common responses to question X?
Which responses are affecting/impacting us the most?
What’s different about this month/this year?
What did respondents in group Y say?
Which group of respondents are most affected by issue Z?
Have customers noticed our efforts in solving issue Z?
What do people say about Z?
Looking at questions 1 and 2, the difference is that the first one returns the volume, whereas in the second you can look at the volume relating to a particular satisfaction score.
If something is very common, it may not affect the score. But if, for example, your Detractors in an NPS survey mention something a lot, that particular theme will be affecting the score in a negative way. These two questions are important to take hand in hand.
You can also compare different slices of the data, such as two different time periods, or two groups of respondents.
Or you can look at a particular issue or theme, and ask questions like “have customers noticed our efforts in solving a particular issue?” if you’re conducting a continuous survey over multiple months or years.
But of course, getting insights from responses is difficult, especially if you use a lot of open-ended questions. Why is that? Because what comes back is a wall of text, which needs to be thoroughly analyzed first.
You can analyze your open-ended responses through a process called coding (or theming) . There are 3 approaches to this.
Someone internally codes the data manually. If you receive 100-200 responses per month, this is absolutely doable. The big disadvantage here is that there is a high likelihood that whoever codes your text will apply their own biases. They may simply not notice particular themes, because they subconsciously don’t think they're important to monitor.
Outsource to an agency. You can email through your survey results and they will simply send back coded responses.
The third option is that you can automate the coding. You use an algorithm to simulate the work of a professional human coder.
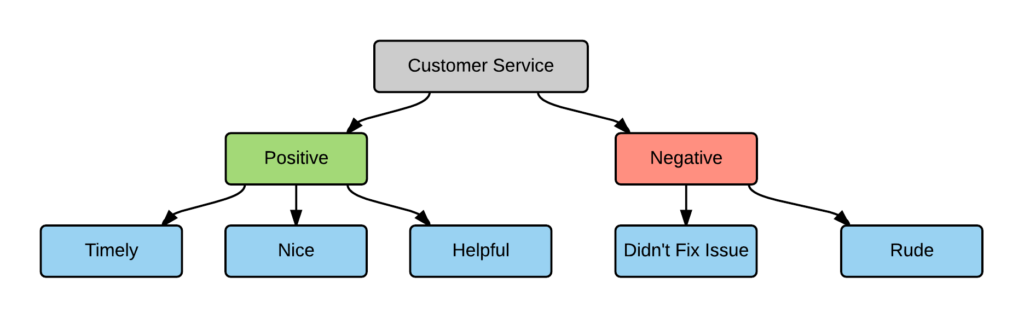
Whichever way you code text, you want to determine which category a comment falls under. In the below example, any comment about friends and family both fall into the second category. Then, you can easily visualize it as a bar chart.
Code frames can also be combined with sentiment. Below, we’re inserting the positive and the negative layer under the customer service theme.
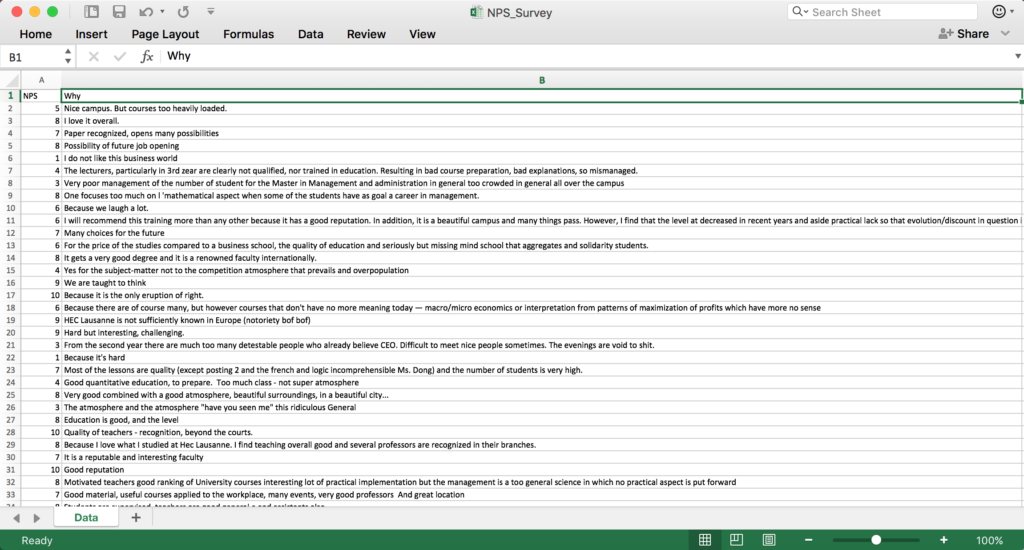
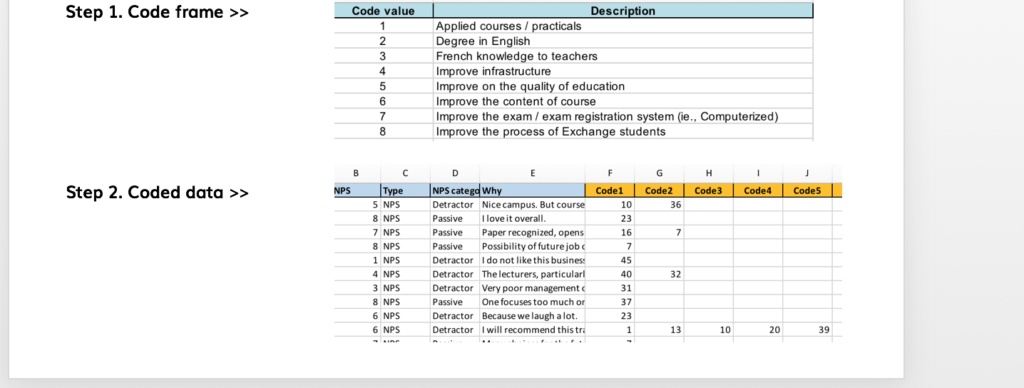
Next, you apply the code frame. Below are snippets from a manual coding job commissioned to an agency.
In the first snippet, there’s a code frame. Under code 1, they code “Applied courses”, and under code “2 Degree in English”. In the second snippet, you can see the actual coded data, where each comment has up to 5 codes from the above code frame. You can imagine that it’s actually quite difficult to analyze data presented in this way in Excel, but it’s much easier to do it using software.
Manual coding example
5 Ways of Visualizing Coded Data
1. Bar charts
The easiest
Measure frequency and impact on score
2. Score graphs
Track numbers or score over time
3. Key drivers and impact
Usually looks like a coordinate area where you can see all the themes grouped according to two attributes which can be quite helpful
4. Pivot tables
Simplify large data sets for easy analysis.
Efficiently group data for clearer insight.
Do you need text analytics software?
Jenine remembers this example: “A client came to me recently, and they were collecting 10,000 comments per year, and they were using Excel. So, you can imagine we became good friends."
“When we are dealing with data that is impossible to manage manually, because there’s too much of it or because we are afraid to bring in our biases, or if it’s a longitudinal study, there is no other option but to use software."
Using a dataset of app reviews for Twitter (now X), I'll show some of the ways Thematic makes it easy to analyze large volumes of data.
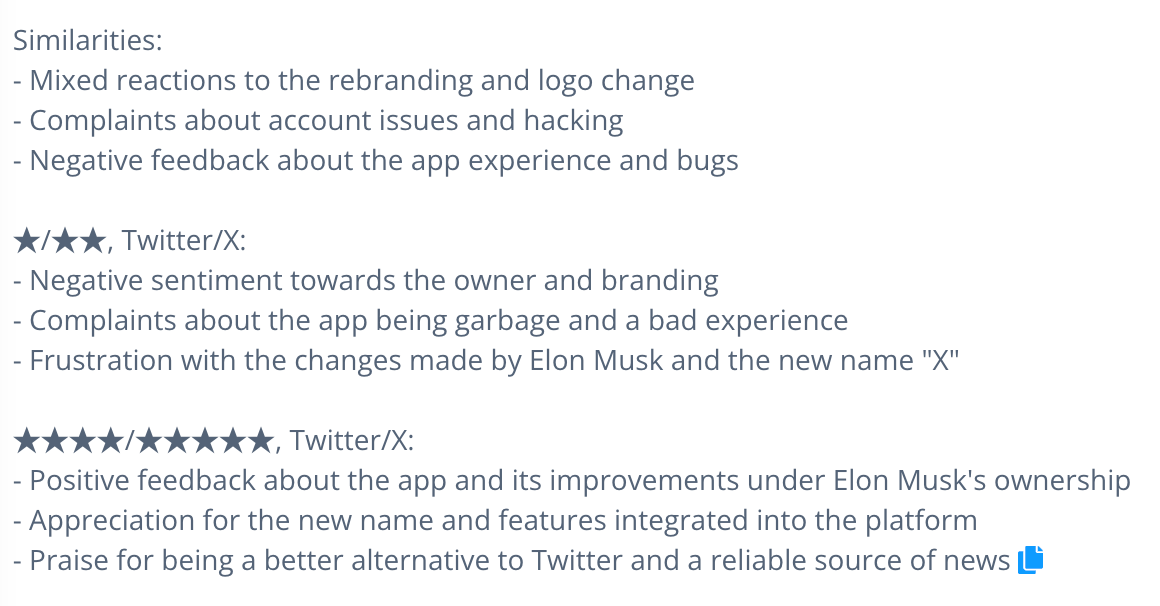
All of the reviews (around 80,000) have been automatically themed (coded) by Thematic. From here, Thematic delivers an overarching summary based on your filters. I've applied a comparison filter, looking at 1 and 2 star reviews compared with 4 and 5 star reviews:
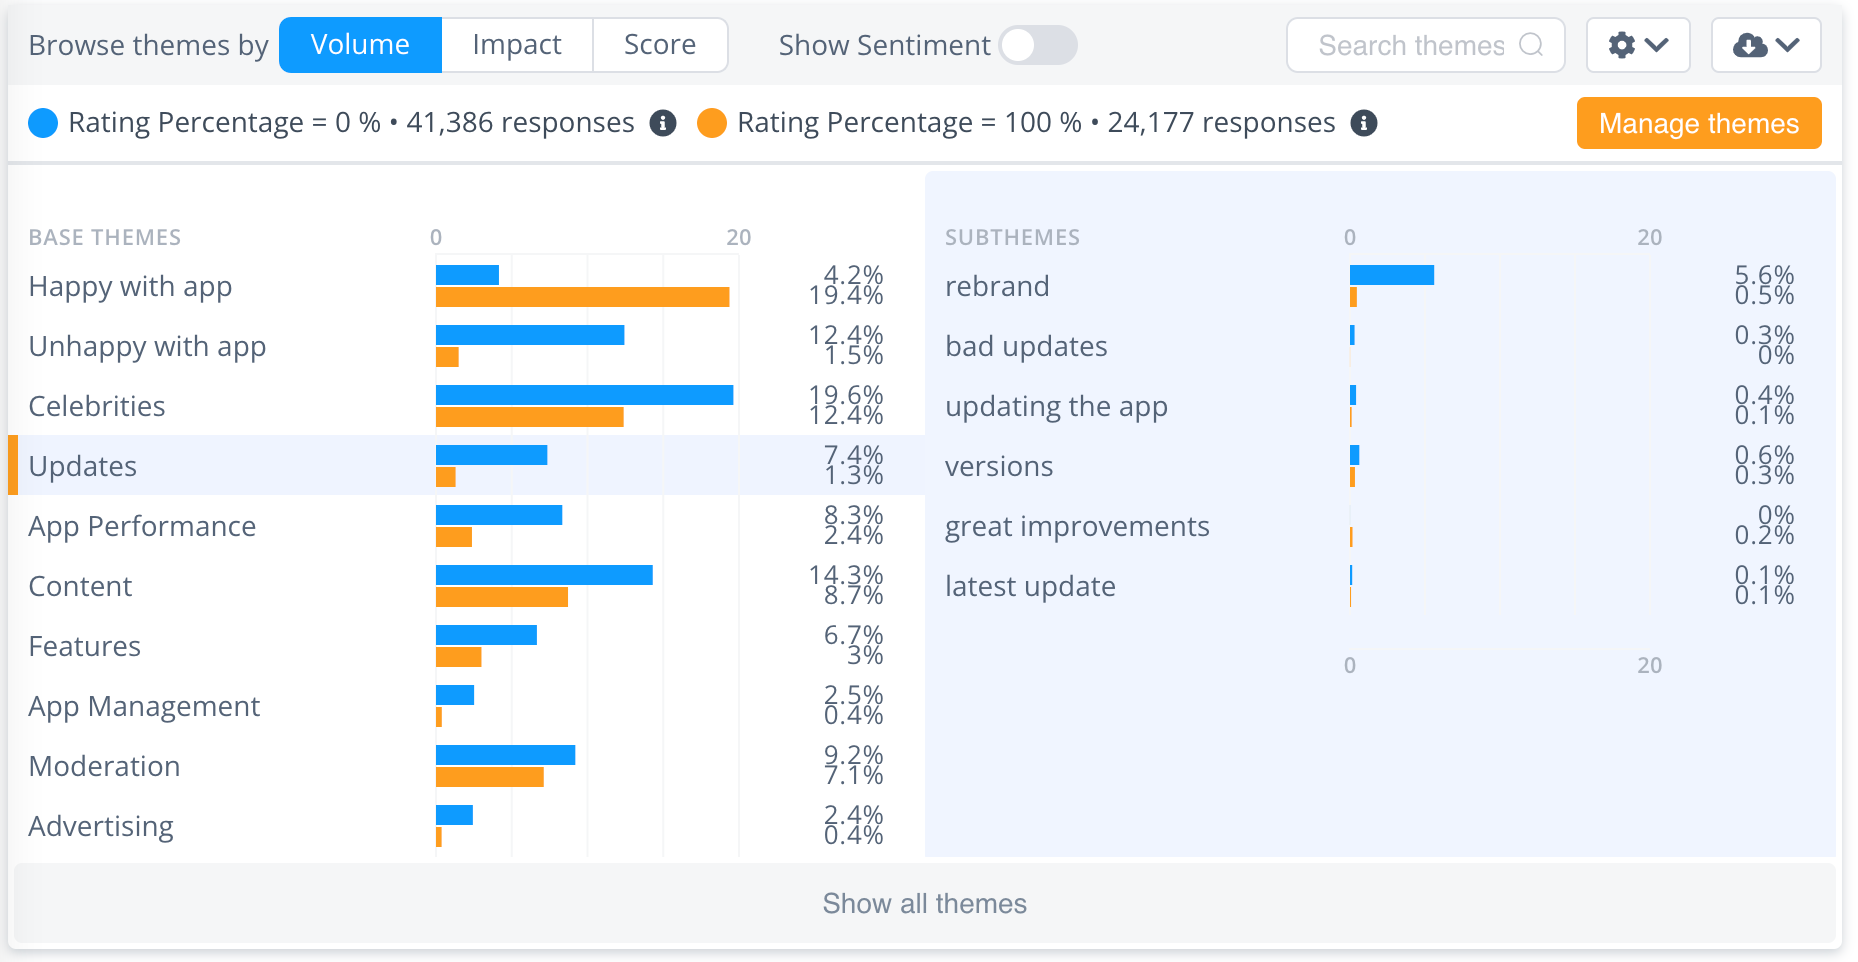
Here's a very simple way of visualizing the data. It’s also an overlooked one because typically when people visualize open-ended responses they tend to use word clouds:
Visualization of Twitter/X reviews
I've set the above visualization to show a clear comparison of themes by volume. The blue bars are Twitter/X’s 1 and 2-star reviews and the orange bars are the 4 and 5-star reviews - any 3-star 'neutral' reviews are filtered out.
You can easily see what stands out between 'good' and 'bad' reviews, and take a steer from here to interrogate the data further.
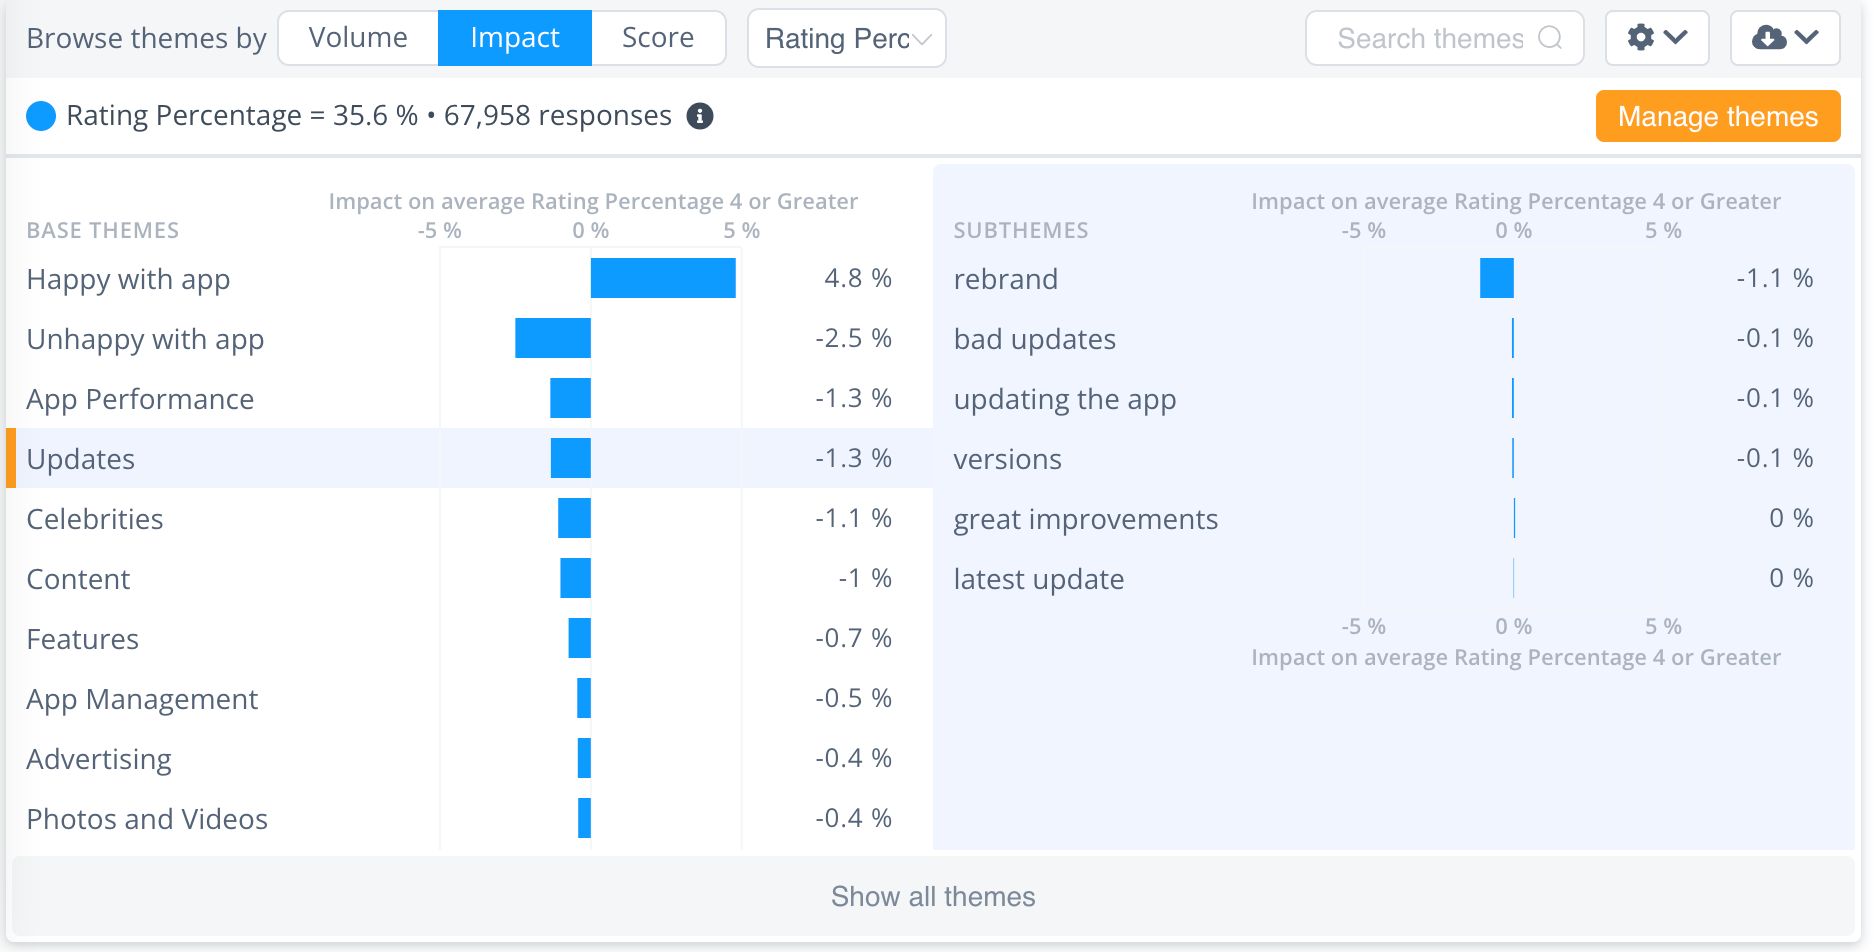
Impact is another bar-chart which shows the effect each theme and sub-theme has on overall score.
You can see that the theme 'Updates' is bringing the score down, and looking at the sub-themes, it's 'rebrand' that's having the biggest negative effect.
For any one of these themes or sub-themes, I can also get a more granular summary - here's the summary for 'Updates':
You can view similar sentence clusters, and your real user verbatims are always visible, so you have transparency. It's easy to map results back to the data - you can confidently defend your results and methodology.
This is just the tip of the iceberg - if you'd like to dive deeper into how Thematic works, you can watch our demo videos, or book an intro call with our friendly team.
If you only do one thing – do this
To wrap up, what’s the most important takeaway here? Think about what customers want and what’s in it for them. In my experience, lots of businesses don’t actually think about this when they send out their surveys.
If you can nail the “what’s in it for me”, you automatically solve the incentive decision and the consistency issue for the survey. That, in turn, solves a number of other decisions which means you’ll arrive at a successful outcome of the research.
Other top tips for survey design:
Report the results back to the customer
Think about different learning and communication styles
Make sure you collect data using different methods, accounting for a variety of personality types
Try to get diverse results
Do not use Excel to visualize your results
TL;DR
1. Survey Planning
When planning surveys:
Keep them short and only include essential questions.
Start with open-ended questions to encourage participation and gather honest feedback.
Focus on revealing key issues in your business and presenting potential solutions.
Consider the best timing to send your survey for the highest response rate.
Offering well-planned incentives can also boost responses by 5-20% without skewing the results.
2. Survey Design
When designing surveys:
Ensure answer options are clearly presented to avoid confusion.
Use a mix of open-ended and closed questions, maintaining consistent scales throughout the survey.
Scales should be defined clearly.
Challenge your own assumptions, involve multiple survey-writers for diverse perspectives, and set reasonable response expectations.
Only include questions crucial to your end outcomes and be prepared to report the results.
3. Survey Collection
For survey collection:
Ensure data is collected from a wide audience.
Use a variety of methods, such as surveys, chat logs and interviews, and consider repeating surveys over time.
Decide when to use surveys and when to use interviews based on the depth of insights required.
Use compelling and easy-to-understand language with examples or images and make sure the survey questions are framed by someone closely involved with the issue.
Use appropriate software tools as per the needs of data collection, like Google Forms, SurveyMonkey, or others.
Keep the surveying process non-intrusive and user-friendly.
4. Survey Analysis
When analyzing your survey results:
Question your data to draw out insightful responses.
Focus on commonly occurring responses and their impact.
Comparison over time periods or groups also offer useful insights.
Open-ended responses can be analysed via manual coding, outsourcing, or automation.
The analysis process includes categorizing comments under codes, which can be combined with sentiment.
Visualize your coded data using techniques such as bar charts, score graphs, key drivers and impact, and pivot tables.
Frequently asked questions
How long should my survey be?
Surveys should be kept short, only including essential questions. Even a three-question survey can be effective.
What type of questions should be included at the start of the survey?
Start with open-ended questions to avoid enforcing any assumptions and to encourage conversation.
When is the best time to send surveys?
Consider your audience's schedule and lifestyle. Choose a time when they are likely to respond and not too busy, like a Friday afternoon.
Should I include incentives for completing my survey?
Incentives can drive a 5-20% increase in responses. They can be monetary or simply sharing results, as long as they don’t skew the accuracy of the results.
How should I present the response options in my survey?
You should explicitly label each option as clearly as possible, ensuring consistency in scales if you are using them.
How can I challenge my assumptions when designing a survey?
Involve multiple survey-writers to get diverse insights and set reasonable expectations.
How can I collect responses to get the most out of my survey data?
Collect data from a wide audience, use multiple sources of data collection, and repeat the survey at different points.
How can I analyze the data I've collected?
Use survey design questions to interrogate the data, find most common responses, identify what is impacting you the most, and notice differences over time or groups. Open-ended responses can be analyzed via manual coding, outsourcing, or automation.
What software can I use to design and analyze my survey?
There are numerous design tools available such as Google Forms, SurveyMonkey, Intercom, Zendesk, and Qualtrics, among others. Feedback analysis platforms include Thematic, Medallia and Kapiche. Choose based on your needs and budget.
How can I visualize the collected data?
You can use methods like bar charts, score graphs, key drivers and impact grids, or pivot tables for easy analysis and clearer insights.
I hope this article has been helpful for your survey planning!
If you’d like to see a Thematic demo on your data to see what we can find, simply book a time with our team.
Share
Link Copied!
Request a demo of Thematic's Customer Intelligence Platform
Thematic turns fragmented feedback into one consistent source of customer truth — so every team acts on the same customer story. Up and running in days, not quarters.
Thank you! Your submission has been received!
Oops! Something went wrong while submitting the form.


.jpg)


