Mapping the customer journey means charting every interaction a customer has with your business. That’s from the first moment they learn about you to the point they become a loyal advocate.
Harvard Business Review defines a customer journey map as “a diagram that illustrates the steps your customer(s) go through in engaging with your company.”
By mapping every touchpoint along this story, you can ensure no interaction falls through the cracks, and you deliver a smoother, more personalized experience.
So in this step-by-step guide, we’ll walk you through how to map your customer journey effectively, so you’ll know exactly how to turn every stage and touchpoint into customer insights you can act on tomorrow.
Step 1: Define the Stages of Your Journey
Every business starts with five core phases—Awareness → Consideration → Purchase → Retention → Advocacy—but the details shift by industry.
Here’s what each typically means:
Awareness – First contact: the buyer realizes a need and discovers your brand through an ad, social post, word-of-mouth, or similar top-of-funnel trigger.
Consideration – Active evaluation: prospects compare options, read reviews, and consume content (guides, demos, webinars) to judge fit and ROI.
Purchase/Decision – Conversion moment: the customer completes the transaction or signs up—online checkout, point-of-sale, or contract signature.
Retention – Post-sale relationship: onboarding, product use, support, and proactive follow-ups aimed at satisfaction and repeat engagement.
Advocacy – Loyalty in action: satisfied customers promote the brand via reviews, referrals, social sharing, or loyalty-program participation.
A journey map works only when each stage reflects your customer’s mindset and goal, so
jot down the phases, add any sub-stages (e.g., Activation or Expansion in SaaS), and
write the customer’s question beside each (“Is this right for me?” “Will it integrate with Slack?”).
A clear stage definition keeps later analysis focused on moments that matter
Below is a side-by-side comparison that shows how the five high-level customer-journey stages play out differently for an omnichannel retail brand versus a B2B SaaS product.
Customer Journey Comparison Table
Journey Stage
Retail Customer (Fashion Store)
SaaS Customer (Collaboration Tool)
Awareness
Spots an Instagram ad, sees a store window display, or hears a friend rave about the brand. Goal: "That looks cool—should I check it out?"
Key touchpoints: social ads, influencer posts, window displays, PR mentions.
Reads a LinkedIn thought-leadership post, Googles "remote team software," or hears the tool mentioned on a podcast. Goal: "Could this solve my workflow pain?"
Key touchpoints: SEO blog, webinar invitations, comparison lists, community forums.
Consideration
Browses the website for styles and sizing, checks in-store stock, watches styling TikToks, reads reviews. Goal: "Is this the right quality, price, and fit for me?"
Key touchpoints: product pages, size guides, live chat, user-generated content.
Short-lists tools, watches demos, reads G2 reviews, runs pricing vs. competitors. Goal: "Prove the ROI to my boss."
Step 2: Collect Data That Fuels Customer Journey Insights
Great maps are built on evidence, not instinct. That means assembling both quantitative signals (traffic sources, conversion rates, support-ticket counts) and qualitative voices (survey comments, reviews, interviews) from every channel your customer touches.
When all that information sits in one place, patterns leap out:
Where do prospects stall?
Which questions explode after onboarding?
Those patterns become hypotheses you’ll test and fix in later steps.
NPS detractor verbatims highlighting specific friction
🤔
Why mix methods? Quantitative metrics show where trouble occurs, while qualitative feedback explains why it happens. Combining the two yields far richer insight than either alone.
Spot Patterns, Segment, and Prioritize
Analyze the blended dataset for:
Drop-offs (e.g., spike in cart abandonment).
Repeating complaints (e.g., confusing shipping policy in support logs).
Persona or cohort differences (new vs. returning users may follow different paths).
Data-driven teams that surface these insights allocate resources more effectively and improve CX faster.
Automate the Heavy Lifting
Manually tagging thousands of open-ended comments or pulling files from dozens of tools is slow and error-prone—91% of organisations say manual processes limit timely insight.
Platforms like Thematic plug into surveys, reviews, chats, and more, then use AI to auto-code themes and detect sentiment, instantly revealing the “highest-impact problems” without spreadsheet gymnastics.
Tag by journey stage. Log which metrics and comments belong to Awareness, Consideration, etc.
Flag red areas. Highlight high drop-offs, low satisfaction scores, or recurring complaints.
Document early hypotheses. “Customers abandon at checkout because the shipping cost isn’t shown upfront.” You’ll test these in later steps.Collect once, analyse continuously, and your journey map will become a living engine of customer service insights.
In this step, you translate the high-level stages you drafted in Step 1 into a concrete inventory of touchpoints, noting the unique “signals” each one can contribute to your customer-journey insights.
Below is a streamlined framework you can copy-paste into your map, followed by a tip on using Thematic to hoover up feedback from all those doors without endless copying and pasting.
Pro tip: if you run brick-and-mortar, add physical moments like window displays or post-purchase unboxing stations to catch offline cues.
Why Listing Touchpoints Matters (and How Thematic Helps)
No blind spots. Omnichannel studies show that a single retail journey can exceed 30 touchpoints, and many outside-owned channels (e.g., TikTok or curbside pickup).
Signal-to-noise. Each touchpoint emits both numbers (click-throughs, wait times) and verbatim feedback (chat logs, social comments). You need both to produce actionable customer-journey insights.
Automation beats sweat. Pulling that verbatim feedback manually is brutal when you have dozens of touchpoints. Thematic integrates with survey tools, CRM, support platforms, review sites, and more, then auto-codes themes and sentiment across them.
Action Steps
Duplicate the matrix and customise the rows with your real touchpoints (add mobile app, kiosk, community Slack—whatever applies).
Tag each touchpoint to its data feed. Example: cart flow → Google Analytics + payment-gateway events; loyalty program → referral codes + NPS verbatims.
Pipe those feeds into one hub. A spreadsheet works for very small sets, but a connector platform like Thematic scales when you have 10+ sources.
Mark gaps. Any stage that still has “???” for insight sources needs a new fedback mechanism before you proceed to optimisation.
Capture every doorway, connect them once, and the insights keep flowing—without repeating the heavy data-collection work you kicked off in Step 2.
Step 4: Track Cross-Channel Flow
Modern buyers zig-zag from an Instagram ad to your mobile site, compare prices on a laptop, and still finish the purchase in-store—all within a single journey. You must see that hop-by-hop path end-to-end to spot friction and keep messaging consistent.
Why It Matters
Omnichannel journeys are the ones customers care about most—and the hardest for companies to get right.
Firms with an integrated, “single customer view” score dramatically higher on customer-experience ratings than those with siloed systems.
Shoppers don’t think in channels; they just expect a seamless brand experience everywhere.
How to Do It (Without Duplicating Step 2)
Connect the dots in your tech stack. Feed web, app, POS, and support data into one CRM or customer-data platform so every touch logs to the same profile.
Map the real channel jumps. On your journey diagram, draw arrows like “Email promo → Mobile site → Store pickup.” Visual cues reveal breakpoints fast.
Flag inconsistencies. Compare promises in early-stage channels to what sales or support actually deliver; mismatched messages are instant friction.
Automate insight gathering. Instead of manually checking each touchpoint, let Thematic pull feedback from email, chat, reviews, and social in one place, so you can see cross-channel sentiment trends at a glance and fix gaps sooner.
Quick Action
Take the touchpoint list from Step 3, tag each one with its primary channel(s), and sketch the most common moves between them. If your current tools can’t track a link in that chain, note it as a data gap to solve next.
Step 5: Gather Feedback for Fine-Tuning
Once your cross-channel flow is clear, you need the voice of the customer (VoC) to decide what to fix first. Think of feedback as the colour-coding that makes your journey map “light up” with delight and frustration hotspots.
Collect VoC at Key Moments
Method
Best Touchpoint Match
Insight You Get
Micro-surveys & NPS
Post-purchase, post-support
Satisfaction score plus root-cause verbatims
Social listening & review scans
Awareness → Advocacy
Emerging praise or complaints in public channels
(source)
Usability tests / interviews
High-friction flows (checkout, onboarding)
Real-time struggle cues you won’t see in analytics
(source)
Pin Feedback to Touchpoints
Attach each verbatim to the stage and touchpoint it describes—“Shipping cost too late in checkout” sits on the Purchase-Cart node. This keeps insights actionable and avoids the “big list of comments” trap. McKinsey notes that journey-level feedback outperforms isolated touchpoint scores for predicting loyalty
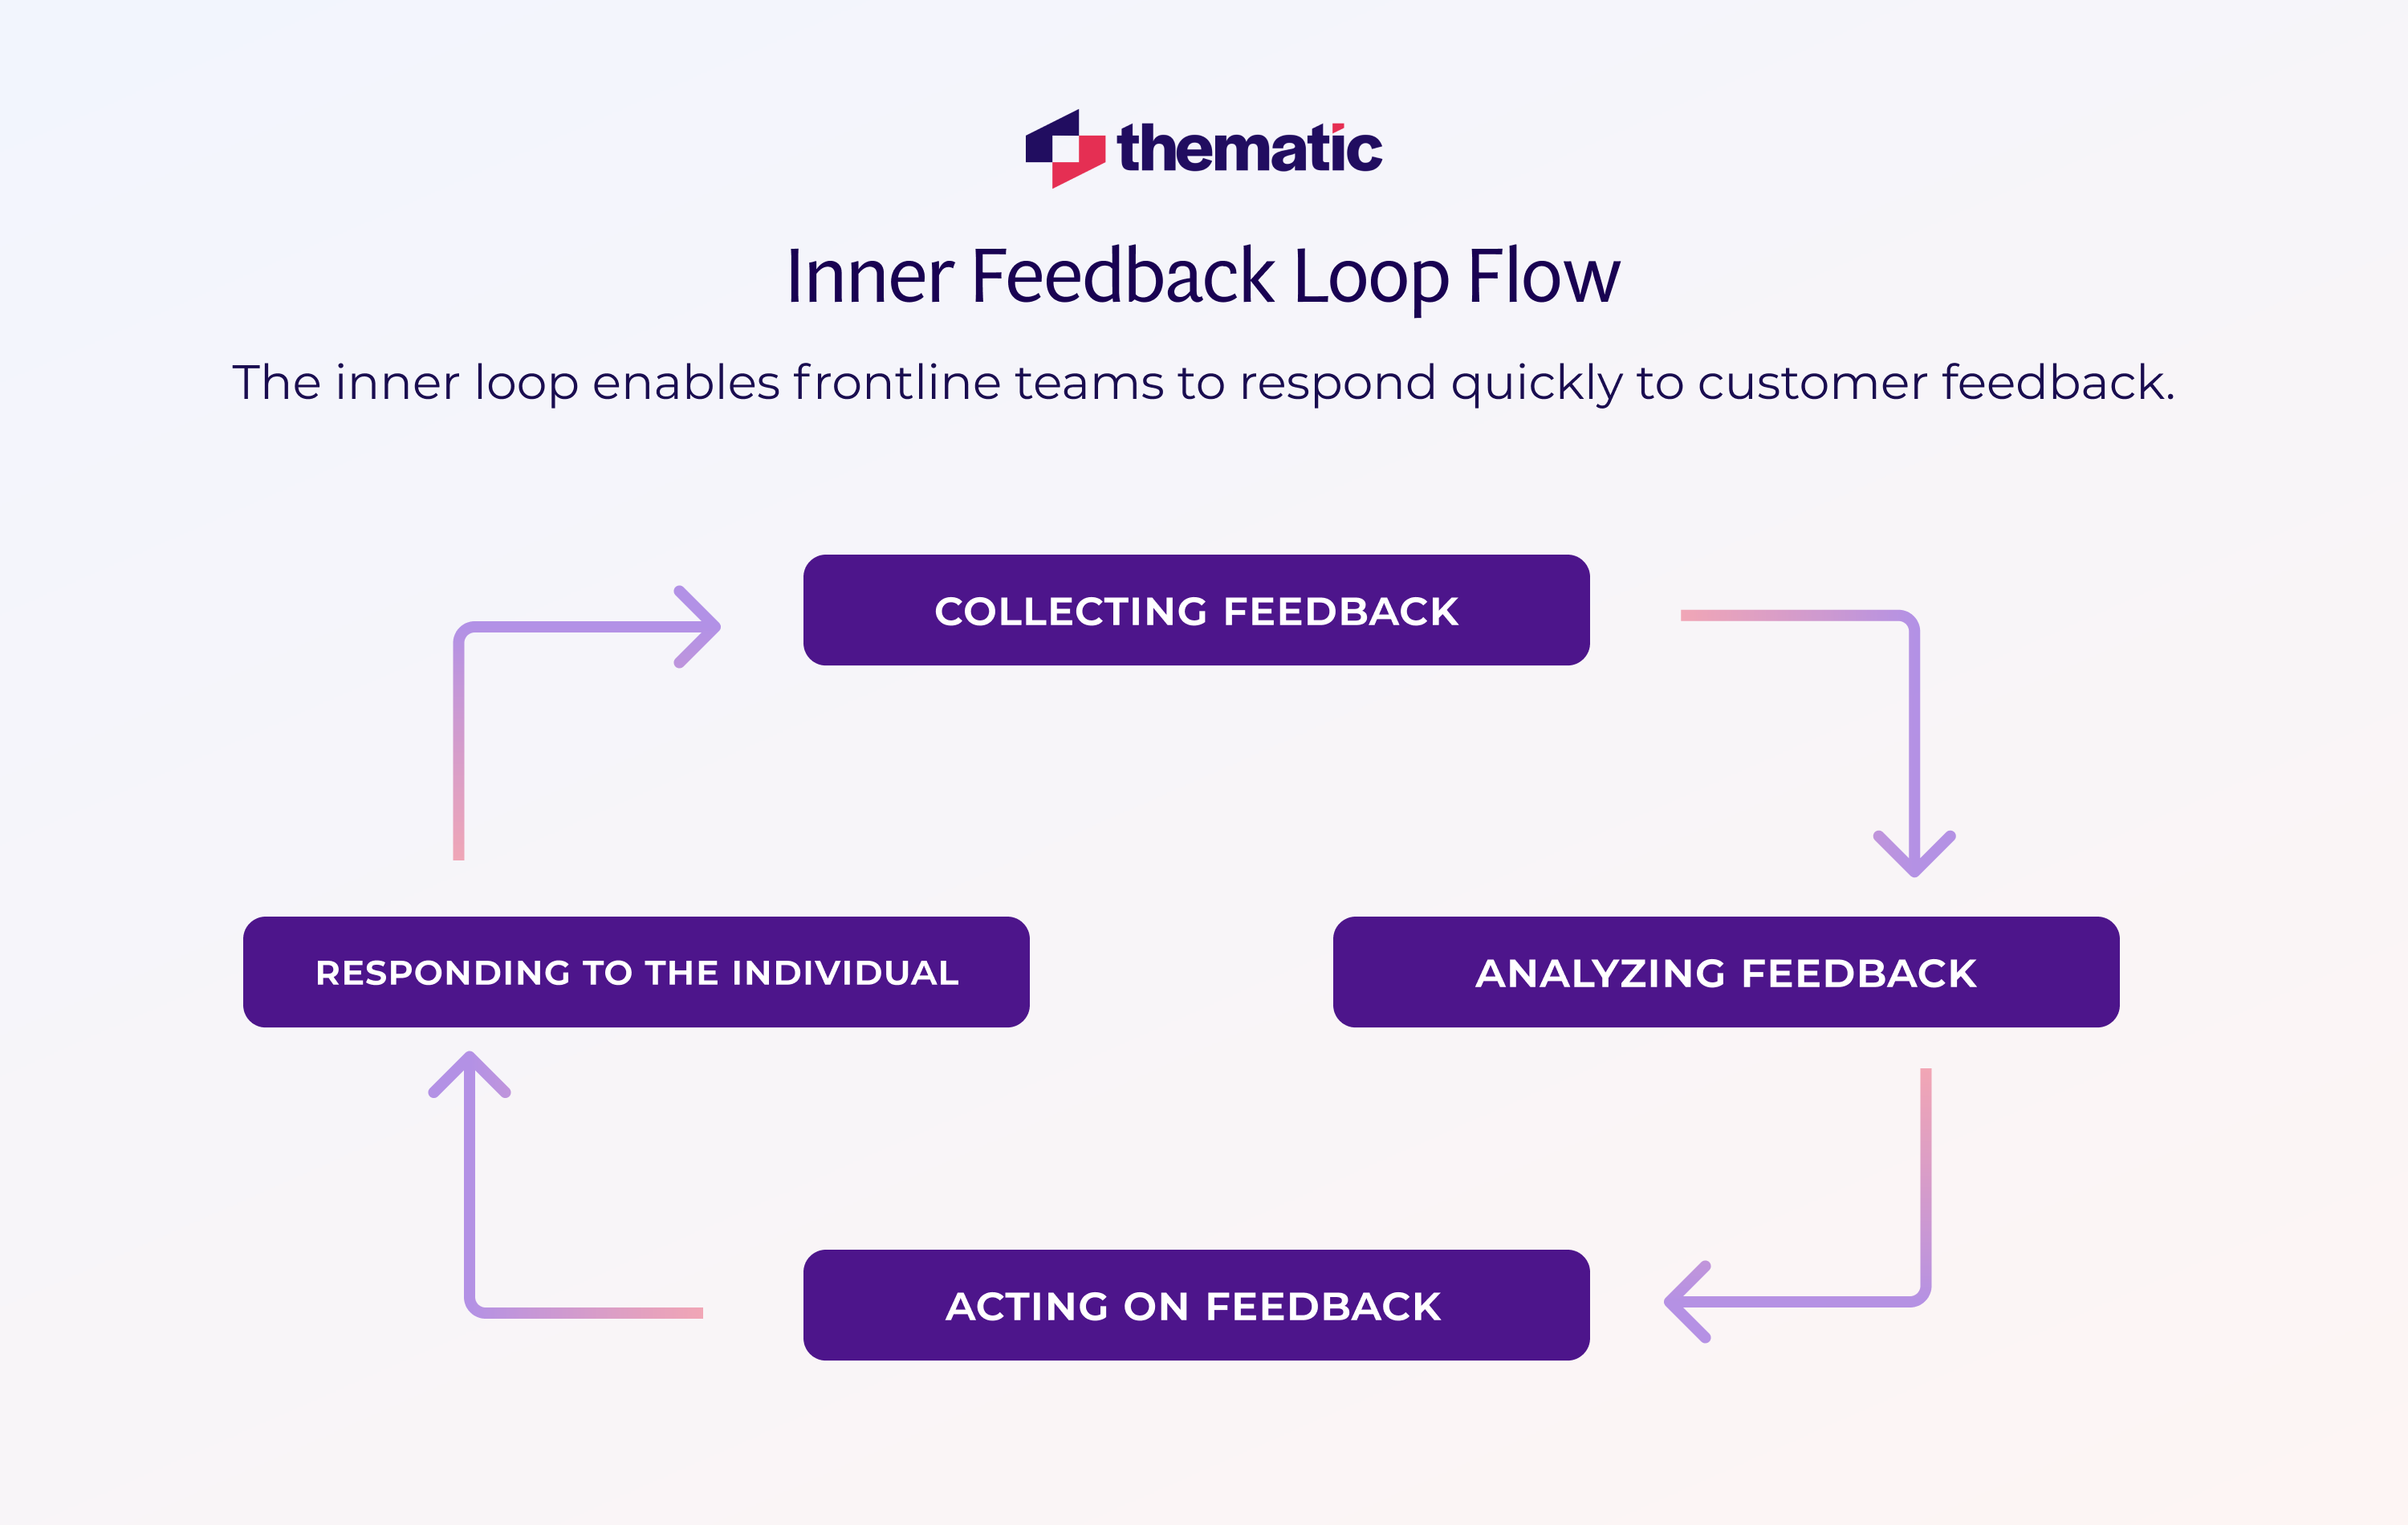
Close the Loop Continuously
A formal feedback loop—collect → analyse → act → confirm—drives ongoing CX improvement and boosts customer favourability by 77% when brands show they listen.
💡
Manually tagging survey answers or scraping review sites is slow. Thematic does this fast because it connects to surveys, chats, and review feeds, auto-codes themes (e.g., “shipping cost confusion”), and surfaces impact so you know which fixes move the needle first.
Action
Ensure every major touchpoint has at least one live feedback source.
Map each comment or metric to its touchpoint on the journey diagram.
Review Thematic (or your chosen VoC tool) dashboards monthly to prioritise fixes and enhancements.
By layering targeted feedback on top of your cross-channel map, you transform a static diagram into a living dashboard of customer-journey insights.
Step 6: Personalize with Automation
AI-powered marketing automation lets you serve the right content, on the right channel, at the right moment. Done well, it lifts revenue and satisfaction without adding manual workload. Below is a streamlined playbook you can slot straight into your journey map.
—and personalization pays:
80% of shoppers say they’re more likely to buy from brands that personalize.
Personalized product recommendations can drive 31 % of total e-commerce revenue.
Triggered flows such as abandoned-cart emails routinely outperform batch sends on both open rate and revenue per send.
Three High-Impact Plays
Marketing Automation Table
Automation Play
Best Journey Stage
What to Set Up
Quick Win
Triggered messages
Consideration → Purchase
Cart-abandon reminders, browse-abandon nudges, post-signup welcome series
Recover otherwise-lost revenue.
Dynamic content & recommendations
On-site & in-app throughout
"Recommended for you" blocks, personalized banners, adaptive home-page modules
AI recommendations boost average order value and sharpen product discovery.
Segment-smart campaigns
Retention & Advocacy
Loyalty thank-yous, win-back series for lapsed users, VIP upsells
Segmented email drives far higher engagement than one-size-fits-all sends.
💡
Tip: Many modern CRMs/CDPs include real-time AI that chooses the next best message or offer; Forrester reports more than 60% of large US agencies are already deploying genAI for this.
Getting Started (in Two Sprints)
Audit your stack – Confirm your ESP, CMS, or CDP supports behavioural triggers and dynamic fields.
Pick one touchpoint to automate – e.g., cart abandonment or post-demo follow-up. Launch, measure, then expand.
Feed better data – Pipe in the cross-channel signals you captured in Steps 2–4; richer data → smarter personalisation.
Iterate with AI insights – Use dashboards to spot which segments or creatives win, then let the algorithm optimise send-time, content blocks, or next-step offers.
Action Checklist
Identify one high-leverage trigger per stage (cart, onboarding, win-back).
Build the first automation with personalised merge fields and dynamic blocks.
Measure lift in open, click, and revenue; set a target to beat.
Roll learnings into the next stage, gradually stitching a fully automated, customer-specific journey.
Personalisation at scale turns your static map into a living, adaptive experience—meeting each customer where they are and nudging them to the next stage, automatically.
Step 7: Remove Friction Ruthlessly
Even brands people love can lose 32% of customers after just one bad experience.
Your job: spot the rough edges in each stage and eliminate them before they erode loyalty.
1. Find the Leaks
Funnel analytics highlight drop-off cliffs (e.g., cart → checkout) so you know where revenue leaks fastest.
Heat- and rage-click maps expose confusing UI elements or “dead clicks” that stall progress.
VoC data from Step 5 pinpoints process or policy pain points customers actually complain about (long hold times, unclear shipping).
2. Rank by Impact
Fix the issues that touch the most customers or cost the most money first—Forrester’s ROI model shows CX wins pay back fastest when you target high-volume, high-value steps.
3. Simplify, Speed, Guide
Quick Fix Table
Quick Fix
Friction Addressed
Tactic / Tool
Shorten forms & preload data
Checkout abandonment
A/B-test field reduction; Optimizely lists 100+ proven ideas
Accelerate page load
Mobile bounce rate
Compress images, lazy-load non-critical assets
Add progress bars & tooltips
Onboarding confusion
UX microcopy + in-app guides
Script tier-1 responses
Support wait times
Knowledge base + chatbots
4. Iterate Forever
Eliminate one bottleneck and the next emerges—that’s healthy. McKinsey calls this a “continuous improvement flywheel” for the decision journey, while Forrester stresses closing the loop with fresh data to keep standards rising.
Action
Mark every friction hotspot on your journey map.
Attach its metric (drop-off %, CSAT dip) and revenue impact.
Assign an owner, implement a fix, and re-measure.
Repeat monthly; celebrate each smoother customer path.
Relentless friction-hunting turns your journey map from a poster into a profit engine—one polished touchpoint at a time.
Step 8: Align Teams Around One Map
A great journey map is useless if marketing, sales, product, and support keep running separate plays. Cross-functional alignment around a single, shared view of the customer consistently outperforms siloed efforts in growth and CX scores.
Alignment matters because:
Decisions made in cross-functional “journey squads” accelerate CX improvements and revenue growth.
Step 9: Turn Your Map into Customer Journey Insights
Modern journey maps earn their keep only when they’re wired to stage-specific metrics that surface new customer-journey insights every month. Below is a lean framework you can drop into your dashboard without repeating earlier data-gathering work, like for data driven customer insights.
Pick the Right KPI for Each Stage
Journey Stage
High-Signal KPIs
Why It Matters
Awareness
Site traffic growth, paid-ad CTR, social engagement rate
Shows if you’re expanding reach and attracting the right audience.
Consideration
Visitor-to-lead or trial conversion %, content-engagement time
Tells whether prospects are advancing toward a decision.
Purchase
Cart-to-purchase rate, average order value, sales-cycle length
Quantifies friction (or flow) at the moment of money.
Instrument your map: add each KPI beside its stage box.
Review monthly: rising product usage but flat renewals? Pricing or onboarding may need work. Traffic soaring but low page engagement? Message-market mismatch.
Act, then re-check: improvements are visible when cart-to-purchase climbs or NPS spikes, confirming Step 7 fixes worked.
Action Checklist
Assign owners for every KPI (shared across teams from Step 8).
Build a simple live dashboard—spreadsheet or analytics tool.
Set quarterly targets (e.g., +2 pts NPS, –10 % churn).
Use findings to prioritise the next optimisation sprint.
With clear metrics wired to your map, you stop guessing and start managing the customer journey like a living, measurable asset—one data-backed insight at a time.
Step 10: Iterate for Continuous Improvement
Your customer-journey map should never become wall art. Leaders who treat it as a living blueprint—reviewed, updated, and re-socialized on a fixed cadence—see faster CX gains and bigger bottom-line impact. Below is a compact cycle you can embed into your operating rhythm.
1. Set a Review Cadence
Quarterly “journey health” reviews keep the map aligned with shifting behaviour and new touchpoints (voice search, AI chatbots, curb-side pickups).
Include the cross-functional squad from Step 8 so ownership stays shared.
2. Feed in Fresh Data
Pipe the latest KPIs and VoC themes (Steps 2, 5, 9) into the map; McKinsey recommends linking the visual journey directly to VOC and operational dashboards for prioritisation.
Highlight new channels or behaviours—e.g., spike in WhatsApp inquiries or adoption of AR try-ons—and add them as nodes.
3. Re-prioritise Improvements
Compare today’s stage metrics to last quarter’s targets. Gaps feed the next optimisation sprint; wins get documented as proven plays.
Use journey dashboards during weekly stand-ups so teams can launch fixes in days, not quarters.
4. Leverage Journey Orchestration Tech
Real-time journey-orchestration tools adjust experiences on the fly, turning static maps into adaptive flows.
These systems close the loop automatically by testing micro-changes and feeding results back to your metrics.
Turn Your Map into Momentum
Your journey map is the operating system for customer-centric growth. Keep sourcing real-world data, tagging every new touchpoint, and feeding fresh customer insights into automated, cross-functional action loops.
Review the map every quarter, log wins, reprioritize gaps, and let AI tools like Thematic surface the next high-impact fix.
Treat the map as a living product, not a one-off project, and it will continuously compound revenue, loyalty, and competitive advantage.
Ready to start gathering customer data to map out the customer journey? Check out how feedback analytics works on your own data. Request a demo of Thematic now.
Share
Link Copied!
Request a demo of Thematic's Customer Intelligence Platform
Thematic turns fragmented feedback into one consistent source of customer truth — so every team acts on the same customer story. Up and running in days, not quarters.
Thank you! Your submission has been received!
Oops! Something went wrong while submitting the form.