What is Net Promoter Score?
Net
Promoter Score (NPS) is a metric that measures the likelihood of your existing customers to recommend
you. The
best way to acquire new customers is through peer recommendations. You can use NPS to gauge the health of your
customer base and, in some industries, also compare your customers’ brand loyalty against those of your
competitors.
What is the best structure of an NPS survey?
NPS surveys usually have very similar structure. But there are some differences, and some NPS surveys are
more
effective than others.
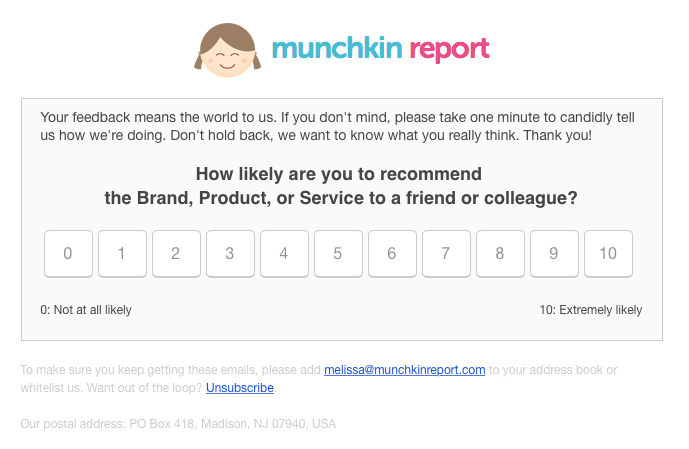
How likely are you to recommend our company to a friend or colleague?
All NPS surveys feature the likert scale question “How likely are you to recommend our company to a friend or
colleague?”. This question has a rating scale of 0 to 10 for respondents to answer. With 10 being extremely
likely to recommend and 0 being not at all likely.
Below is an example of Munchkin Report’s NPS
survey.
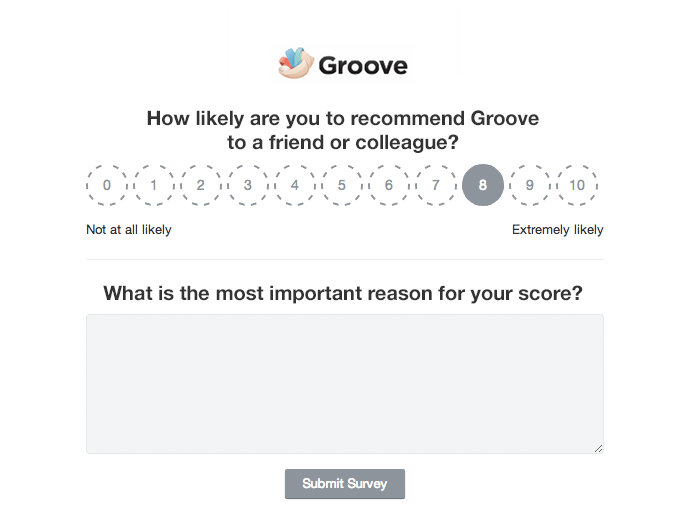
Open-ended NPS questions
Most NPS surveys add a second open-ended question “Why did you choose that score”, or something similar, to
allow
their customers share the reason for recommending or not recommending. See below an example from Groove HQ.
The three types of customer categories
Based on the results of the email survey scale, customers are classified into three categories:
Promoters
Promoters are respondents who give a 9 or 10 score. They love the products or services that the company
offers.
They are typical repeat buyers who recommend the company’s products or services to others.
Passives
Passives are respondents who give a 7 or 8 score. They are somewhat satisfied with the products or services
of
the company. However, they could easily switch to a competitor that has a better offer. They probably won’t
spread
anything negative about the company and its offerings but they are also not enthusiastic enough to promote the
company’s products or services.
Detractors
Detractors are respondents who give a 0 to 6 score. They are not happy with the company and its products or
services. They most likely won’t purchase again from the company. It is also highly probable they would tell
others about their negative experience. Consequently, this could potentially damage the reputation of the
company.
So, what’s a good NPS score?
This completely depends on your industry. Below is a summary of NPS scores by industry, which we found in the
Temkin
Report:
Net Promoter Score Benchmark Study, 2018, based on 10,000 US consumers.
Interestingly, the average scores for 2018 overall seemed to have gone down slightly from the 2017
report.
|
Industry
|
Average industry NPS range
|
Best NPS
|
| Auto dealers |
39 |
51 |
| Supermarkets |
34 |
56 |
| Software companies |
30 |
44 |
| Retailers |
29 |
51 |
| Airlines |
29 |
54 |
| Banks |
21 |
65 |
| Health Plans |
19 |
39 |
| Hotels & Rooms |
33 |
49 |
These figures are from the Temkin
Report: Net Promoter Score Benchmark Study, 2018
NPS Benchmarks to live by
The industry leaders are ahead of the pack, as always. If you want to benchmark yourself to the best of the best,
these are just a few examples of where you should be aiming:
US retailers:
- Amazon: 55
- Chewy.com: 55
- Carter’s: 54
- Kohl’s: 41
- HEB: 56
US home goods:
- Amazon: 57
- Best buy: 50
- Menards: 46
- IKEA: 38
US travel:
- JetBlue/True Blue: 61
- Marriott Rewards: 56
US Auto:
These examples are from the New Bain Certified Benchmarks, 2018.
The Net Promoter Score can range from -100 (if all customers are detractors) to 100 (if all
customers
are
promoters).
When you get a high Net Promoter Score, your company has earned more promoters than detractors.
How do I improve my company’s NPS score?
Does your NPS score leave room for improvement? Don’t worry, it can be improved (after all, that’s the whole
point
of using NPS anyway; to know where you are currently, identify areas of improvement and be able to action as
soon
as possible.
You need to perform an effective Net Promoter
Score Analysis. It all starts with analyzing your customer feedback
properly. You need a reliable solution to be able to identify your key drivers of NPS: What exactly impacts your
score? You need to know how to - correctly - analyze your feedback with the right methods to reduce
where
it
hurts
(reduce
churn, improve retention, customer lifetime value, customer experience etc).
Instead of allocating time and resource (human bandwidth) to analyze your feedback in a time-consuming and
not
very reliable way (with major risk of error), you can get instant, reliable insights with a text analytics
solution.
This way, you ensure that the insights you’re getting are actionable, and meaningful for your business.
You’ll
get
data-driven insights that you can use to base your business strategy, product development and innovation
strategy
on.
Not there yet?
Are you still wondering whether to invest in the Net Promoter Score (NPS) to improve your customer
experience?
Check out our summary as to why NPS
is worth the investment.


