Understanding how to use both qualitative and quantitative data can help you make better decisions and gain deeper insights. Here's what you need to know.
Qualitative data captures the "why" behind behaviors through descriptive, non-numerical information like customer comments and interview responses.
Quantitative data measures the "what" and "how many" using numerical information like ratings, scores, and statistical trends.
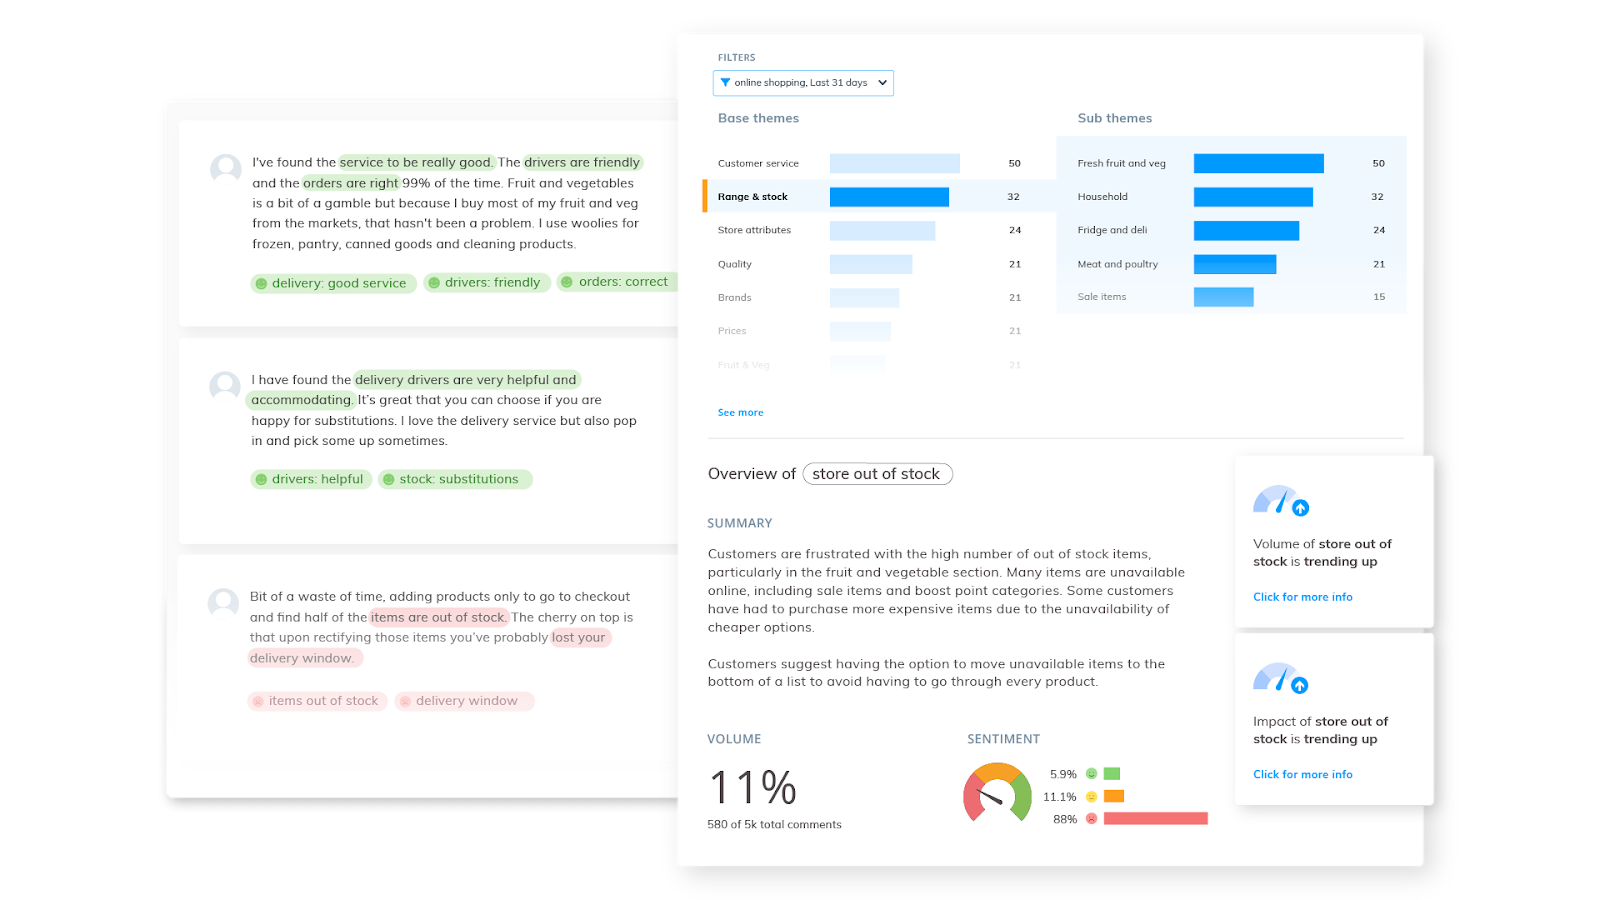
AI-powered platforms like Thematic combine both data types, automatically analyzing qualitative feedback at scale while connecting insights to quantitative metrics.
Combining qualitative and quantitative data gives you the complete picture: numbers show what's happening, while customer comments explain why.
Enterprise research teams use transparent, research-grade tools to unify feedback sources and deliver defensible insights executives can trust.
Understanding how to use both qualitative and quantitative data helps you make better decisions and gain deeper insights.
You've collected thousands of survey responses or customer comments. The numbers tell you satisfaction scores are dropping, but they don't tell you why. Meanwhile, reading through open-ended feedback manually takes weeks, and by then, the issues have compounded.
One solution changes this. AI-powered qualitative data analysis software can process millions of comments in minutes while preserving the nuance and context that numbers alone miss.
In this guide, you'll learn the key differences between qualitative and quantitative data, when to use each type, and how combining both delivers the comprehensive understanding that drives business decisions.
Let’s talk about what matters in your feedback analysis.
Understanding qualitative data
Qualitative data is descriptive, non-numerical information that captures human behavior, emotions, and experiences.
Unlike quantitative data, which focuses on measurements and statistics, qualitative data explores the subjective: people's thoughts, feelings, and interactions with their environment. This type of data reveals the "why" behind the "what" in your research.
You can collect qualitative data through interviews, focus groups, surveys with open-ended questions, and observations. It provides insights into motivations, attitudes, and the context surrounding customer experiences.
This matters across industries. Product managers use it to improve app features. Healthcare professionals rely on it to transform patient experiences. Research teams analyze it to understand customer behavior at scale.
Defining qualitative data
Qualitative data is descriptive information expressed in words, phrases, or labels rather than numbers.
It describes characteristics and traits through language: customer opinions about your product, motivations for purchasing decisions, emotions during service interactions, or experiences navigating your website.
Qualitative research approaches topics from the perspective of those experiencing them. Where quantitative data asks "how many," qualitative data asks "why" and "how."
This subjective nature lets you understand complex social phenomena and grasp the context surrounding customer behavior. You discover not just what customers do, but why they do it.
Interviews explore people's attitudes and opinions through in-depth, one-on-one conversations. The researcher can follow interesting threads and dig deeper into unique perspectives.
Focus groups gather information through structured group discussions. Participants share thoughts and build on each other's ideas, revealing patterns in how people think about specific topics.
Qualitative surveys use open-ended questions where respondents provide their own answers. Instead of selecting from pre-defined options, they write exactly what impressed them, frustrated them, or drove their decisions.
Observations involve watching people in natural settings. You see how customers actually interact with products or services, not just how they say they do.
Case studies analyze a single person, group, or situation in depth. This detailed examination reveals insights that broader studies might miss.
These methods offer rich, contextual insights. They help you understand complex social phenomena and real interactions with products or services.
Analyzing qualitative data involves interpreting unstructured information like open-ended text responses, interview transcripts, and customer comments.
This requires different techniques than quantitative analysis. Popular methods include:
Content analysis categorizes text into defined groups to quantify themes
Thematic analysis identifies patterns and themes across qualitative data
Discourse analysis examines how language creates meaning in social contexts
Thematic analysis is particularly common. The traditional process involves coding data to identify keywords or topics, then grouping these codes into meaningful themes.
This has historically been time-consuming work. Researchers spent weeks manually reading and coding thousands of comments.
Now you can analyze qualitative data at scale faster than ever. AI-powered qualitative data analysis software like Thematic processes millions of customer comments and automatically identifies themes with no manual setup required.
Unlike black-box AI tools, Thematic gives researchers transparent control. You can edit, refine, and validate how themes are built using the Theme Editor.
This combines AI speed with human-in-the-loop accuracy, delivering research-grade analysis that's both fast and defensible.
Grasping quantitative data
Quantitative data is numerical, measurable information that lets you test hypotheses, measure variables, and identify patterns across populations.
This data type provides objective, statistical insights. It answers the "what" and "how many" of your research questions with concrete numbers you can compare and analyze.
Quantitative data offers reliability and measurability. You can track changes over time, compare different segments, and make predictions based on statistical analysis.
Defining quantitative data
Quantitative data is numerical information that can be measured, counted, and expressed using statistics.
Examples include age, height, weight, income, test scores, satisfaction ratings, purchase frequency, and response times. This data lets you quantify behaviors, opinions, and attitudes.
Quantitative research gathers numerical data and analyzes it using statistical methods. It's used to identify trends, test theories, assess problems, and establish relationships between variables.
The objectivity of quantitative data makes it valuable for decision-making. You can measure exactly how many customers rated your service highly, calculate average response times, or determine the percentage of users completing a specific action.
Common quantitative research methods
Several research methods help you gather numerical data systematically.
Surveys with closed-ended questions are the most common approach. These questions provide pre-defined answer options: multiple choice selections, yes/no responses, rating scales from 1-10, or agreement scales from "strongly disagree" to "strongly agree."
For example, an NPS question asks "How likely are you to recommend us to family or friends?" with a scale from 0 (not at all likely) to 10 (extremely likely). These standardized responses make data easy to quantify and compare.
Experiments test hypotheses under controlled conditions. Researchers manipulate variables and measure outcomes numerically.
Structured observations use predefined categories to count and measure behaviors systematically.
Questionnaires combine multiple closed-ended questions to gather measurable data from large groups.
These methods provide consistency in data collection. Everyone answers the same questions with the same options, making analysis straightforward.
Analyzing quantitative data
Quantitative data analysis uses statistical methods to find patterns, test hypotheses, and draw conclusions from numerical information.
Researchers rely on two main approaches:
Descriptive statistics summarize your data. This includes calculating means (averages), medians (middle values), modes (most common values), and ranges (spread of data). These help you understand what your data looks like overall.
Inferential statistics (testing whether patterns are statistically significant) let you draw broader conclusions. You can identify relationships between variables and make predictions based on patterns.
Statistical analysis turns raw numbers into actionable insights. You spot trends, understand relationships, and make evidence-based decisions.
When you combine quantitative analysis with qualitative insights, you get both the measurable trends and the context explaining why those patterns exist.
Comparing and contrasting qualitative and quantitative data
Qualitative and quantitative data serve different purposes, and understanding when to use each type shapes your research outcomes.
The key distinction comes down to what you're trying to learn. Quantitative data tells you what's happening and how much. Qualitative data tells you why it's happening and what it means.
Differences in data collection
Data collection methods differ fundamentally between these two approaches.
Qualitative data collection uses flexible, exploratory methods:
Surveys with open-ended questions let respondents write their own answers
Observations capture behaviors in natural settings
Interviews allow follow-up questions based on responses
These approaches adapt as you learn more. You can explore unexpected themes that emerge during research.
Quantitative data collection uses structured, standardized methods:
Surveys with closed-ended questions provide pre-defined answer options
Experiments measure specific variables under controlled conditions
This standardization makes large-scale data collection consistent. You can survey thousands of people using the same questions and directly compare their responses.
The collection method you choose depends on your research question. If you need to measure how many customers experienced a problem, use quantitative methods. If you need to understand why they experienced it and how it affected them, use qualitative methods.
Differences in data analysis
Analysis techniques vary significantly between data types.
Qualitative data analysis interprets non-numerical information through:
Content analysis to categorize themes systematically
Thematic analysis to identify patterns across responses
Discourse analysis to understand meaning in context
This analysis uncovers deeper insights by exploring nuances and complexities. You discover unexpected patterns and understand the context surrounding customer experiences.
Qualitative data works best when you're exploring complex social phenomena, investigating new topics, or gaining insights into human experiences and emotions. This data type captures the subjective nature of experiences and reveals why people think and act as they do.
Quantitative data analysis applies statistical methods to numerical information:
Descriptive statistics summarize patterns in your data
Inferential statistics test hypotheses and relationships
Predictive models forecast future outcomes based on trends
This objective approach identifies measurable patterns, tests specific hypotheses, and produces results that can be replicated.
Quantitative data works best when you need to measure variables, test theories, or establish patterns across large populations. This data type provides objective, comparable information that answers "what" and "how many" questions with statistical confidence.
Both approaches have merit. The analysis method you choose should match your research goals and the type of insights you need.
Thematic
AI-powered software to transform qualitative data into powerful insights that drive decision making.
Complementing each other: implementing mixed methods research
Qualitative and quantitative data aren't competing approaches. They work together to provide comprehensive understanding.
Qualitative data offers depth and context. It explores the reasons behind trends, behaviors, and opinions, revealing the "why" that numbers alone can't capture.
Quantitative data provides measurable trends and patterns. It tells you what's happening, how often, and how much.
In customer feedback analysis, combining both data types gives you a 360-degree view of your users.
Thematic combines AI-powered qualitative analysis with quantitative data integration, turning millions of customer comments into measurable insights you can track against business metrics like NPS or CSAT.
Metrics shift constantly. Numbers on a dashboard indicate things are going wrong or right, but you need to know why they're changing.
You can draw some conclusions from quantitative data alone, like comparing customer segments to identify common patterns. But to shift your numbers in a positive direction, you need qualitative insights.
Your qualitative data holds the answers. Customer comments provide the context you need to understand the "why" behind metric changes and know exactly what actions will improve scores.
Enterprise feedback intelligence platforms like Thematic sit on top of existing tools like Medallia or Qualtrics, unifying qualitative and quantitative data for transparent, defensible analysis that executives trust.
This combination delivers the measurable trends showing what's changing, the contextual insights explaining why, the connections between themes and business metrics that guide priorities, and the transparent methodology that makes analysis auditable and defensible.
When you analyze both data types together, you move from simply knowing that satisfaction dropped 5 points to understanding exactly which service issues caused the decline and what specific improvements will reverse it.
Real-world examples of qualitative and quantitative data
Here's how both data types appear in real business contexts:
Qualitative data in action
Real-world qualitative data appears in various forms:
Analyzing interview transcripts to understand customer preferences and pain points
Reviewing responses to open-ended survey questions about product experiences
Observing customer behavior in retail environments to identify friction points
Assessing community impact when implementing new policies
Reading support chat logs to identify common issues and requests
Qualitative data lets you explore the reasons and motivations behind behaviors.
A product designer might conduct in-depth interviews with users to understand their needs and preferences. These insights inform product decisions that truly meet customer needs.
Medical professionals use qualitative data to assess patient satisfaction with treatments. This feedback shapes improvements in patient care and communication.
Customer experience teams analyze qualitative feedback from support interactions to identify recurring issues. They can quantify these themes to prioritize fixes or update FAQ content based on what customers actually ask about.
Quantitative data in action
Quantitative data appears throughout business and research:
Using surveys to measure customer satisfaction scores (often combined with qualitative open-ended questions)
Analyzing sales data to identify trends and predict future performance
Comparing test scores between educational programs to evaluate effectiveness
Tracking website metrics to understand user behavior patterns
Measuring response times to assess service efficiency
This data provides objective, measurable information you can easily compare and analyze.
A marketing team might analyze quantitative data from various advertising campaigns, identifying which strategies drive the most sales and engagement. These metrics guide budget allocation decisions.
Research teams use quantitative data to establish baseline measurements, track changes over time, and demonstrate statistical significance in their findings.
By relying on measurable, objective data, organizations make evidence-based decisions grounded in proven results rather than assumptions.
Summary
Understanding the differences between qualitative and quantitative data helps you conduct more effective research and make better decisions.
Qualitative data provides depth and context. It explores the complexities of human experiences, revealing why people think and act as they do. This data type captures emotions, motivations, and the nuance behind customer behaviors.
Quantitative data offers objective and measurable insights. It identifies trends, tests hypotheses, and provides the statistical evidence that guides confident decision-making. This data type quantifies what's happening and how much.
By combining the strengths of both data types, you develop comprehensive understanding of any research question. You get both the measurable patterns that show what's changing and the contextual insights that explain why.
The next time you're working on research or analysis, consider both qualitative and quantitative data. A well-rounded approach that leverages both types uncovers valuable insights that either type alone would miss.
Ready to unify your qualitative and quantitative data? Thematic delivers transparent, research-grade analysis at enterprise scale. Book a guided trial and see how AI-powered automation combined with human-in-the-loop control transforms feedback into confident decisions. Book your guided trial
Frequently asked questions (FAQs)
1. What is an example of qualitative and quantitative data?
Qualitative data example: Customer comments explaining "The checkout process was confusing because the buttons weren't clearly labeled." Quantitative data example: Measuring that 35% of customers abandoned their cart at checkout. Together, they show both what happened and why.
2. How do you know if the research is qualitative or quantitative?
Look at the data type collected. Quantitative research gathers numerical data (ratings, counts, measurements) and uses statistical analysis. Qualitative research gathers descriptive data (words, observations, experiences) and interprets meaning, context, and themes.
3. What is an example of quantitative data?
Quantitative data includes any measurable numerical information: a customer weighing 130 lbs, being 25 years old, rating service 8 out of 10, spending $450 per month, or taking 45 seconds to complete checkout. All these examples can be counted, measured, and statistically analyzed.
4. What is the main difference between qualitative and quantitative data?
Quantitative data focuses on measurable numbers that answer "what" and "how many" questions. Qualitative data focuses on descriptive information that answers "why" and "how" questions. Quantitative provides breadth through statistics; qualitative provides depth through context and meaning.
5. When should I use qualitative data in my research?
Use qualitative data when you need to understand motivations, explore new topics, or capture the context behind behaviors. It's essential for uncovering why customers feel a certain way, how they experience your product, or what factors drive their decisions.
6. What is the best software for analyzing qualitative data?
Thematic is qualitative data analysis software that uses AI to automatically code feedback into themes while letting researchers combine qualitative insights with quantitative metrics in one unified platform. Unlike black-box AI, it provides transparent control where you can edit and validate themes.
7. Can AI analyze both qualitative and quantitative data together?
Yes. AI-powered platforms like Thematic analyze qualitative data at scale by automatically identifying themes across millions of comments, then connect those themes to quantitative metrics like NPS or CSAT scores. This delivers insights in minutes rather than weeks of manual coding.
8. What tools combine qualitative and quantitative data analysis?
Enterprise feedback intelligence platforms like Thematic sit on top of existing tools like Medallia or Qualtrics, unifying qualitative and quantitative data sources. These platforms provide transparent, research-grade analysis where teams can validate AI-generated themes while tracking impact on business metrics.
9. How do you analyze qualitative data at scale?
AI-powered platforms can analyze qualitative data at scale by automatically identifying themes across millions of comments, delivering insights in minutes rather than weeks. Tools like Thematic combine automated speed with human-in-the-loop control, letting researchers edit and validate themes for accuracy.
10. Can you use the same software for qualitative and quantitative analysis?
Yes. Modern feedback intelligence platforms unify both data types. Thematic combines AI-powered qualitative analysis with quantitative metric tracking, so you can analyze customer comments alongside ratings, identify which themes drive score changes, and prioritize improvements based on measurable impact.
Share
Link Copied!
Request a demo of Thematic's Customer Intelligence Platform
Thematic turns fragmented feedback into one consistent source of customer truth — so every team acts on the same customer story. Up and running in days, not quarters.
Thank you! Your submission has been received!
Oops! Something went wrong while submitting the form.


.webp)