“Every time I see a word cloud presented as insight, I die a little inside”
J. Harris, data journalist
If you are a manager, there is a high chance that you’ve encountered word clouds in reports on key company issues, such as customer service or employee satisfaction. I still remember the first time I encountered a word cloud and was distinctly underwhelmed…
It was back in 2005, during my study abroad year in New Zealand. In the search for interesting local blog posts, I opened Technorati, the Best Technical Achievement of that time according to SXSW. A cloud of popular blog topics occupied a quarter of their web page. The largest items in the cloud were New, Nz and somewhere down below (the words were ordered alphabetically) was Zealand.
With my degree in Linguistics, I shuddered at this butchering of a single concept into three words. But a crude approach to dealing with language is only one of the reasons why word clouds aren’t a viable form of visualizing data.
Word Clouds: the Mullets of Data Storytelling
Data expert Jacob Harris believes that visualizations are a form of storytelling. A good story does not overwhelm you with unnecessary information. A good story provides context to help you understand the subject. A good story leads you to the right conclusions.
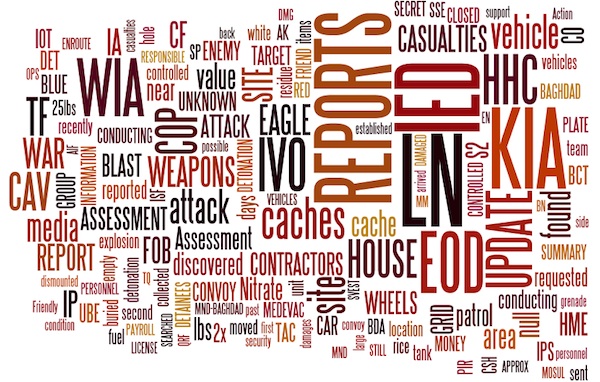
According to Harris, word clouds “throw all of these principles out of the window”, lead to the wrong conclusions about the data and are therefore harmful. As an example he shows these two visualizations derived from the same datasets:
Mapping of a Deadly Day in Baghdad (best viewed in its interactive form)
Word cloud of titles in the Iraq war logs from Fast Company
But unfortunately, word clouds are still extremely ubiquitous.
Word Clouds: Unfortunately, the Status Quo in CX Platforms
I don’t mind when people use word clouds as decoration of their personal homepages. But I do mind when people use them to support their decision making. And that happens on a daily basis. Managers are constantly fed word clouds in reports, just because they are considered to be the status quo.
Most customer feedback solutions use word clouds as the only way to visualize customer comments. A managing director of a fast-growing global customer experience platform once told me that 80% of their customers are happy with word clouds. “What’s wrong with word clouds?“, he asked.
Word Clouds: Five Major Shortcomings
When it comes to understanding customer feedback, here is a list of ways in which word clouds harm business decisions:
1. Word clouds do not capture words that mean the same thing.
There are some words or phrases which don’t vary a lot. For example, if you want to describe the friendliness of staff, you are most likely to just say friendly. But in most cases, there is a lot of variety that conventional word clouds cannot capture. For example, difficult and hard are both equally frequent in customer comments.
Some tools, like NVIVO, allow the person preparing the report to merge these words manually, but that just solves one of the shortcomings and requires significant manual work.
2. Word clouds do not capture complex themes.
The truth is that customers complaints can rarely be captured as single words. For example, customers may be saying that the prices are too high, or the wait times are too long. A standard dictionary won’t help you capture dozens of varieties of how these themes can be expressed.
Think about it. People can say things like: it’s expensive, not cheap, overpriced, overpriced, pricey, costs too much, reduce costs, make cheaper, provide more affordable options etc.
3. Word clouds lack context.
Some words are meaningful on their own, such as friendly and helpful. Others, require context to understand what the customers are actually saying. This is only possible with access to a more specific phrase, or even the entire comment. Some solutions will let you click on a word to show comments containing it, but a word like good will capture attributes of many different themes in customer feedback, so comments alone won’t help.
4. Word clouds are prone to bias
Even if the individual issues are captured correctly, displaying them in a word cloud is prone to interpretation errors. As an experiment, I asked three people to tell me the top 5 themes customers mention in a given word cloud. They all came up with a different set. This is a typical example of confirmation bias, the tendency to interpret new evidence as confirmation of one’s existing beliefs or theories. A good visualization is designed to be far less prone to many different biases that people struggle with.
5. Word clouds obscure the relative importance of themes.
When prioritizing what to work on next, the relative importance of issues customers raise is the key. Word clouds make it impossible to capture the differences in importance. Is the first issue twice as important as the second one? Or are the top three equally important?
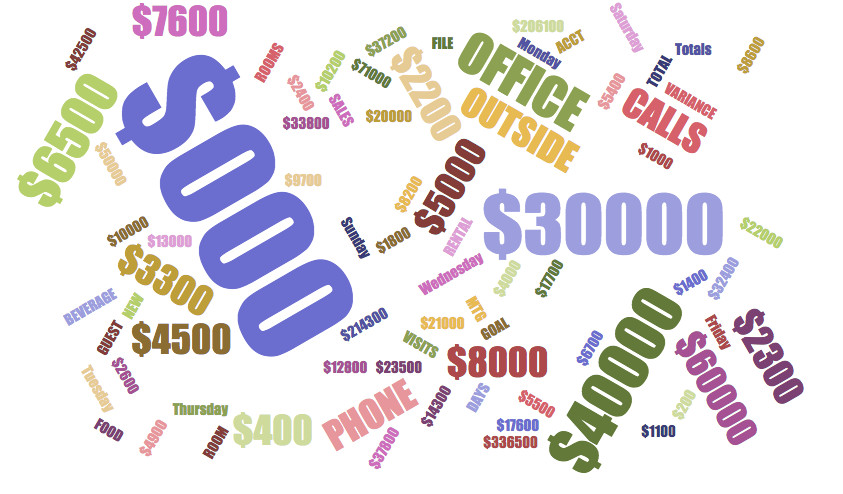
So, before you use a word cloud again in a report, think about this: Would you take hard numbers like sale amounts for each week of the year, multiply each by a random amount between 1 and 5, delete some of them and then display the final numbers jumbled as a cloud?
I didn’t think you would.
Share
Link Copied!
Request a demo of Thematic's Customer Intelligence Platform
Thematic turns fragmented feedback into one consistent source of customer truth — so every team acts on the same customer story. Up and running in days, not quarters.
Thank you! Your submission has been received!
Oops! Something went wrong while submitting the form.


