Why guess what your users truly want when they’re already telling you?
Every star rating you collect, every support ticket you log, and every tweet you scan holds a clue to building something people love. Voice of customer research powers a continuous feedback engine, delivering insights that drive smarter roadmaps and happier customers.
In this guide, you’ll discover exactly how to:
Gather feedback at scale.
Decode raw comments into crystal-clear signals.
Act on what you learn—fast.
Ready to ditch the guesswork and build with confidence? Let’s jump in.
Voice of Customer research is the systematic process of capturing and interpreting what your customers say, feel, and do. It’s about turning real customer signals into better products, smarter decisions, and happier users.
It’s how leading teams cut through the noise and prioritize what actually moves the needle.
Ever shipped a feature you thought was gold, only to hear crickets from users? That’s often because feedback hides in separate channels—surveys, support tickets, social mentions—and never gets woven into one story.
Download VoC Handbook
Voice of Customer Made Easy: The Professionals’ VoC Handbook
Written by a CX expert, this handbook simplifies VoC strategies and helps you get the most from customer feedback.
Not every “tell-us-what-you-think” survey qualifies as VoC. Voice of customer research is:
Structured & ongoing — data is gathered continuously across channels, not ad-hoc scraps.
Multi-method — it blends quantitative metrics with rich qualitative insights.
Action-oriented — findings feed directly into product roadmaps, service improvements, and messaging tweaks.
Core Objectives of VoC Research
A mature program does three things exceptionally well:
Uncover expectations – what customers assume will “just work.”
Identify pain points – friction spots that create churn risk.
Inform strategic decisions – evidence that shapes features, pricing, and support priorities.
💡
Quick check: Can your team point to a feature or fix you shipped last month because of customer feedback? If not, you’re still in general feedback territory.
Next up: Chapter 2 shows which research methods surface the clearest signals without drowning you in noise.
Key VoC Research Methodologies
Picture this: you’ve got a mountain of feedback but no map to find the treasure. These six methods are your compass. Pick the right one, and you’ll uncover actionable insights in half the time.
Here’s a quick comparison
Build vs Buy Table
Method
Use When
Strengths
Limits
Surveys & Questionnaires
Quantify CSAT/NPS at scale
Cheap, fast, measurable
Shallow insight; low response
In‑Depth Interviews
Explore deep motivations
Rich detail
Time‑heavy; small sample
Focus Groups
Test concepts pre‑launch
Interactive; quick validation
Group bias; pricey
Social Media Listening
Track sentiment live
Real‑time; unsolicited
Noisy; heavy analysis
Online Reviews & Feedback
Benchmark post‑purchase
Honest insights; compare rivals
Fake/skewed; partial view
Behavioral Data Analysis
Spot in‑app friction
Objective; high volume
Lacks context; infra needed
Let’s go into the details.
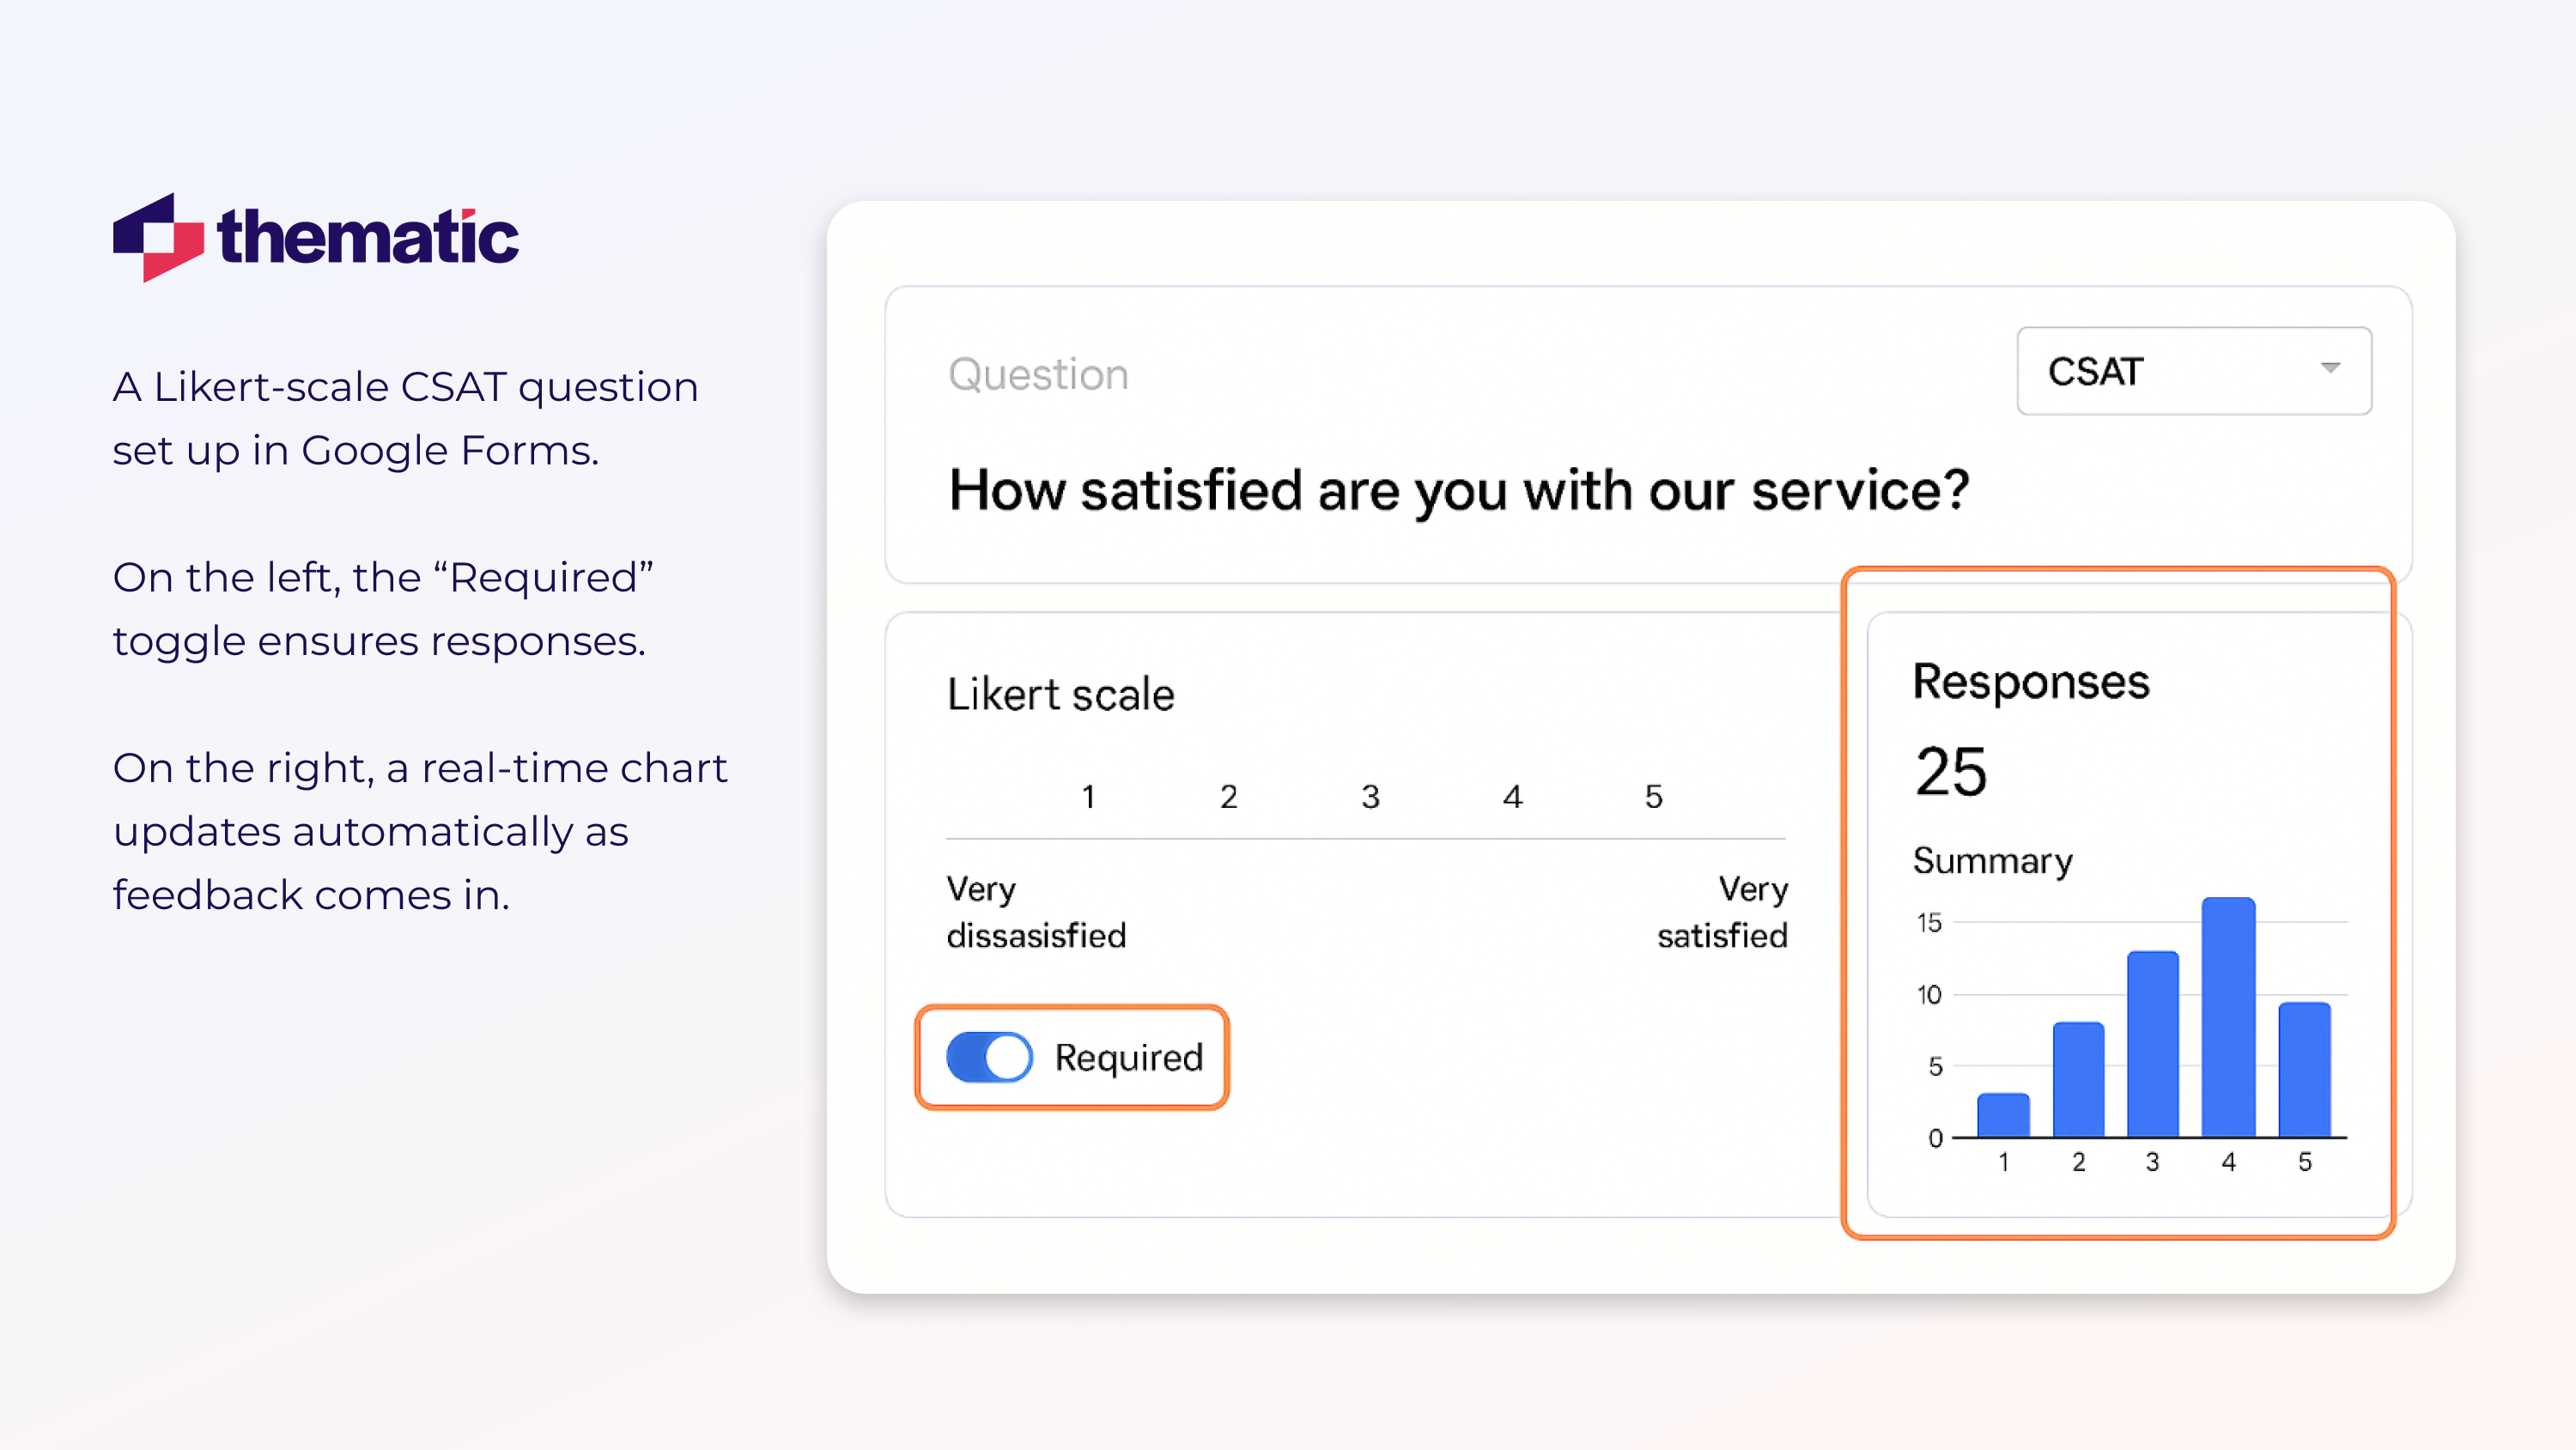
Surveys & Questionnaires
Structured surveys deliver fast, large-sample, quantitative data that pinpoints “how many” customers feel a certain way.
The best part: it’s cost-effective, easy to distribute, and instantly measurable.
But the kicker is, it can miss deeper motives. It may also suffer from low response rates due to self-selection bias, where only the most engaged (or unhappy) users choose to respond.
Use this method when you need broad trend lines or want to benchmark customer metrics like CSAT. How?
Start with a short, focused survey you can build in minutes. Try no more than 10 questions, and send them to a broad audience.
This should let you quickly see how many customers rate your product 9 or 10 on NPS or 4-5 on a 5-point CSAT scale.
Use these numbers to spot trends and benchmark changes over time. Once you see a spike—or a sudden dip—that's your signal to explore further.
So, surveys tell you what’s happening, but not always why. That’s where interviews come in.
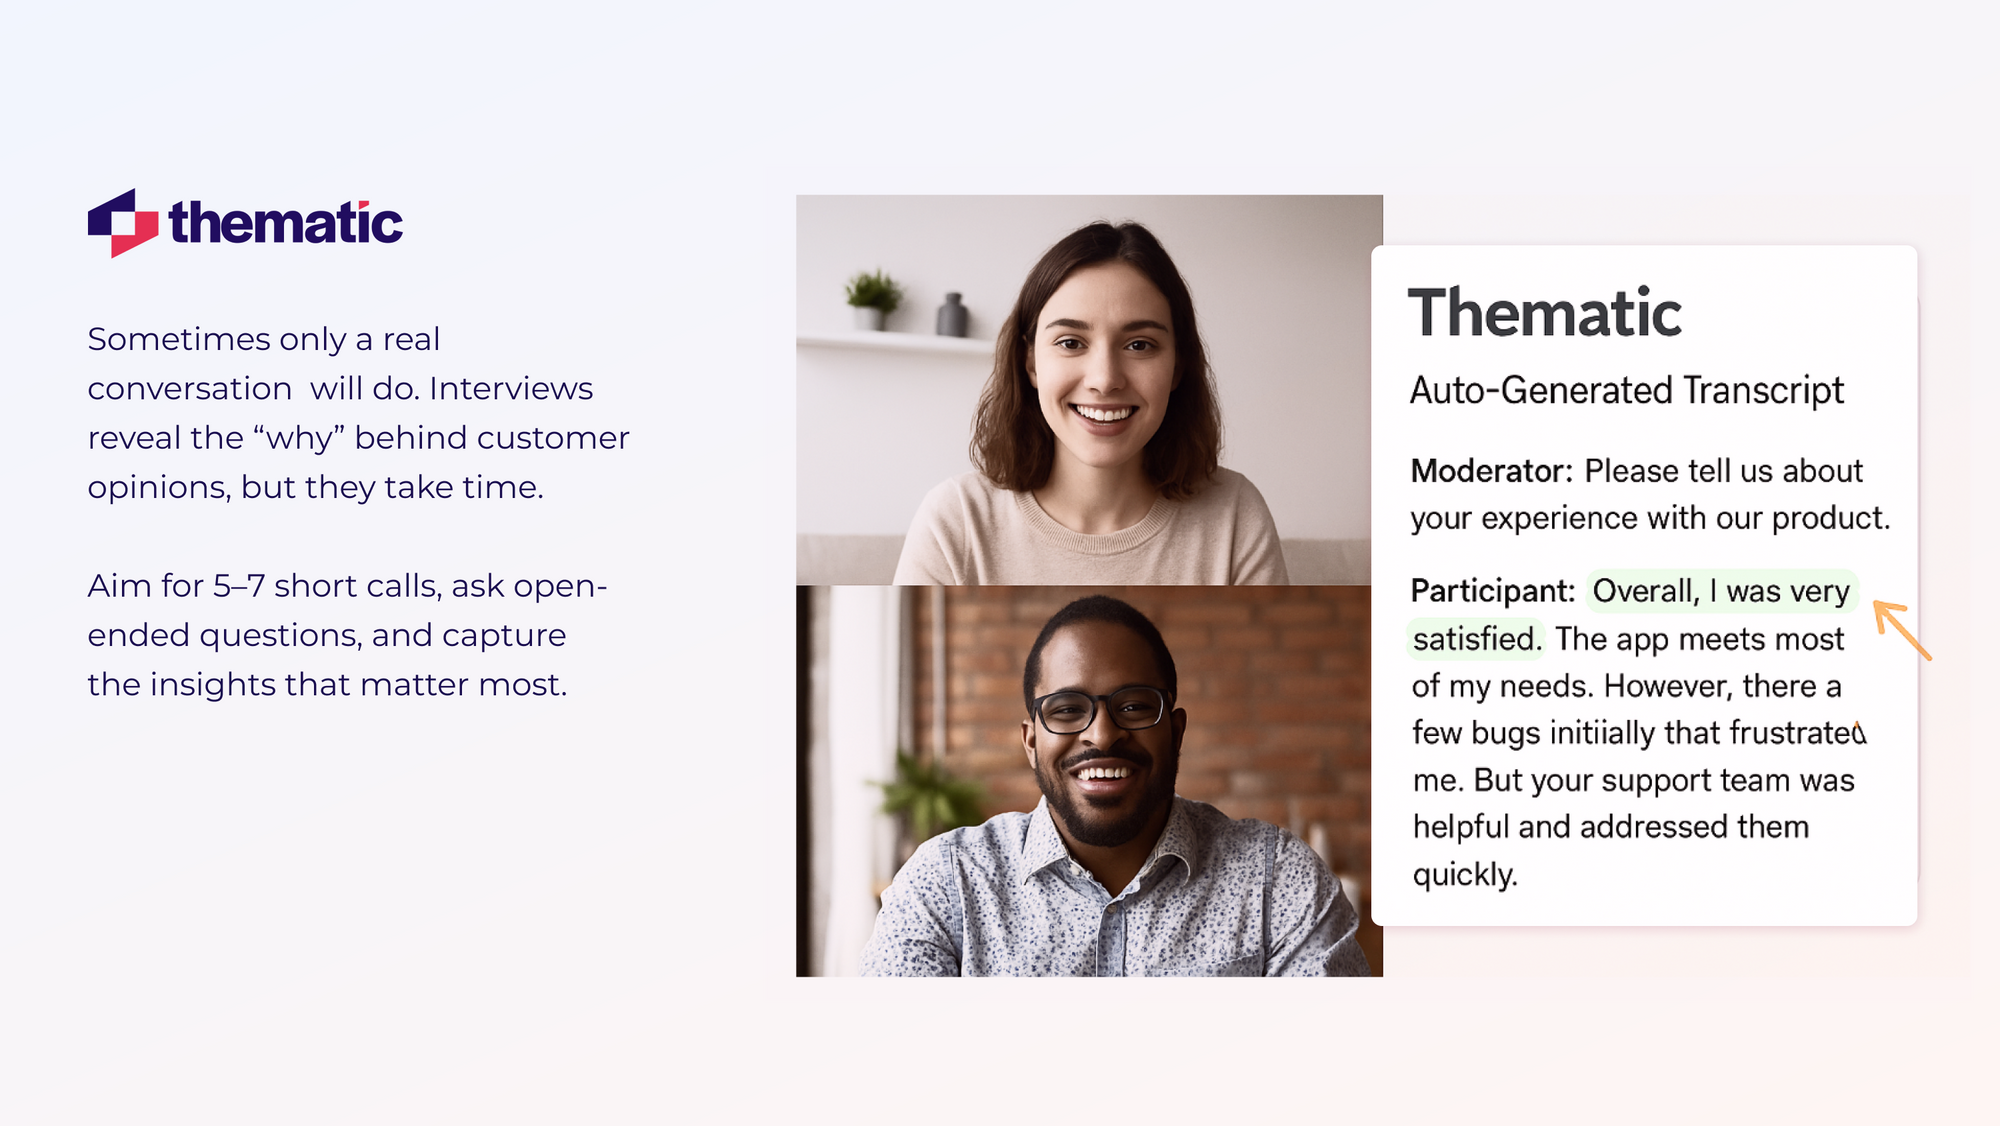
In-Depth Interviews
Sometimes only a real conversation will do.
If you want to understand the real 'why' behind customer opinions, interviews are the method to use.
Go deep into the emotions driving your customer’s decisions. Understand what drives them. Interviews give you rich qualitative information.
The downside, it is time consuming. So, it’s not really ideal if you’re pressed against time.
But if you have time to spare, go ahead and schedule 5–7 thirty-minute calls. Ask open-ended prompts like “Walk me through your last experience,” and pull out the top 3–5 verbatim quotes.
Their feedback may just shape your next product win.
But what if you want to see how ideas play out in a group? Let’s go to the next one.
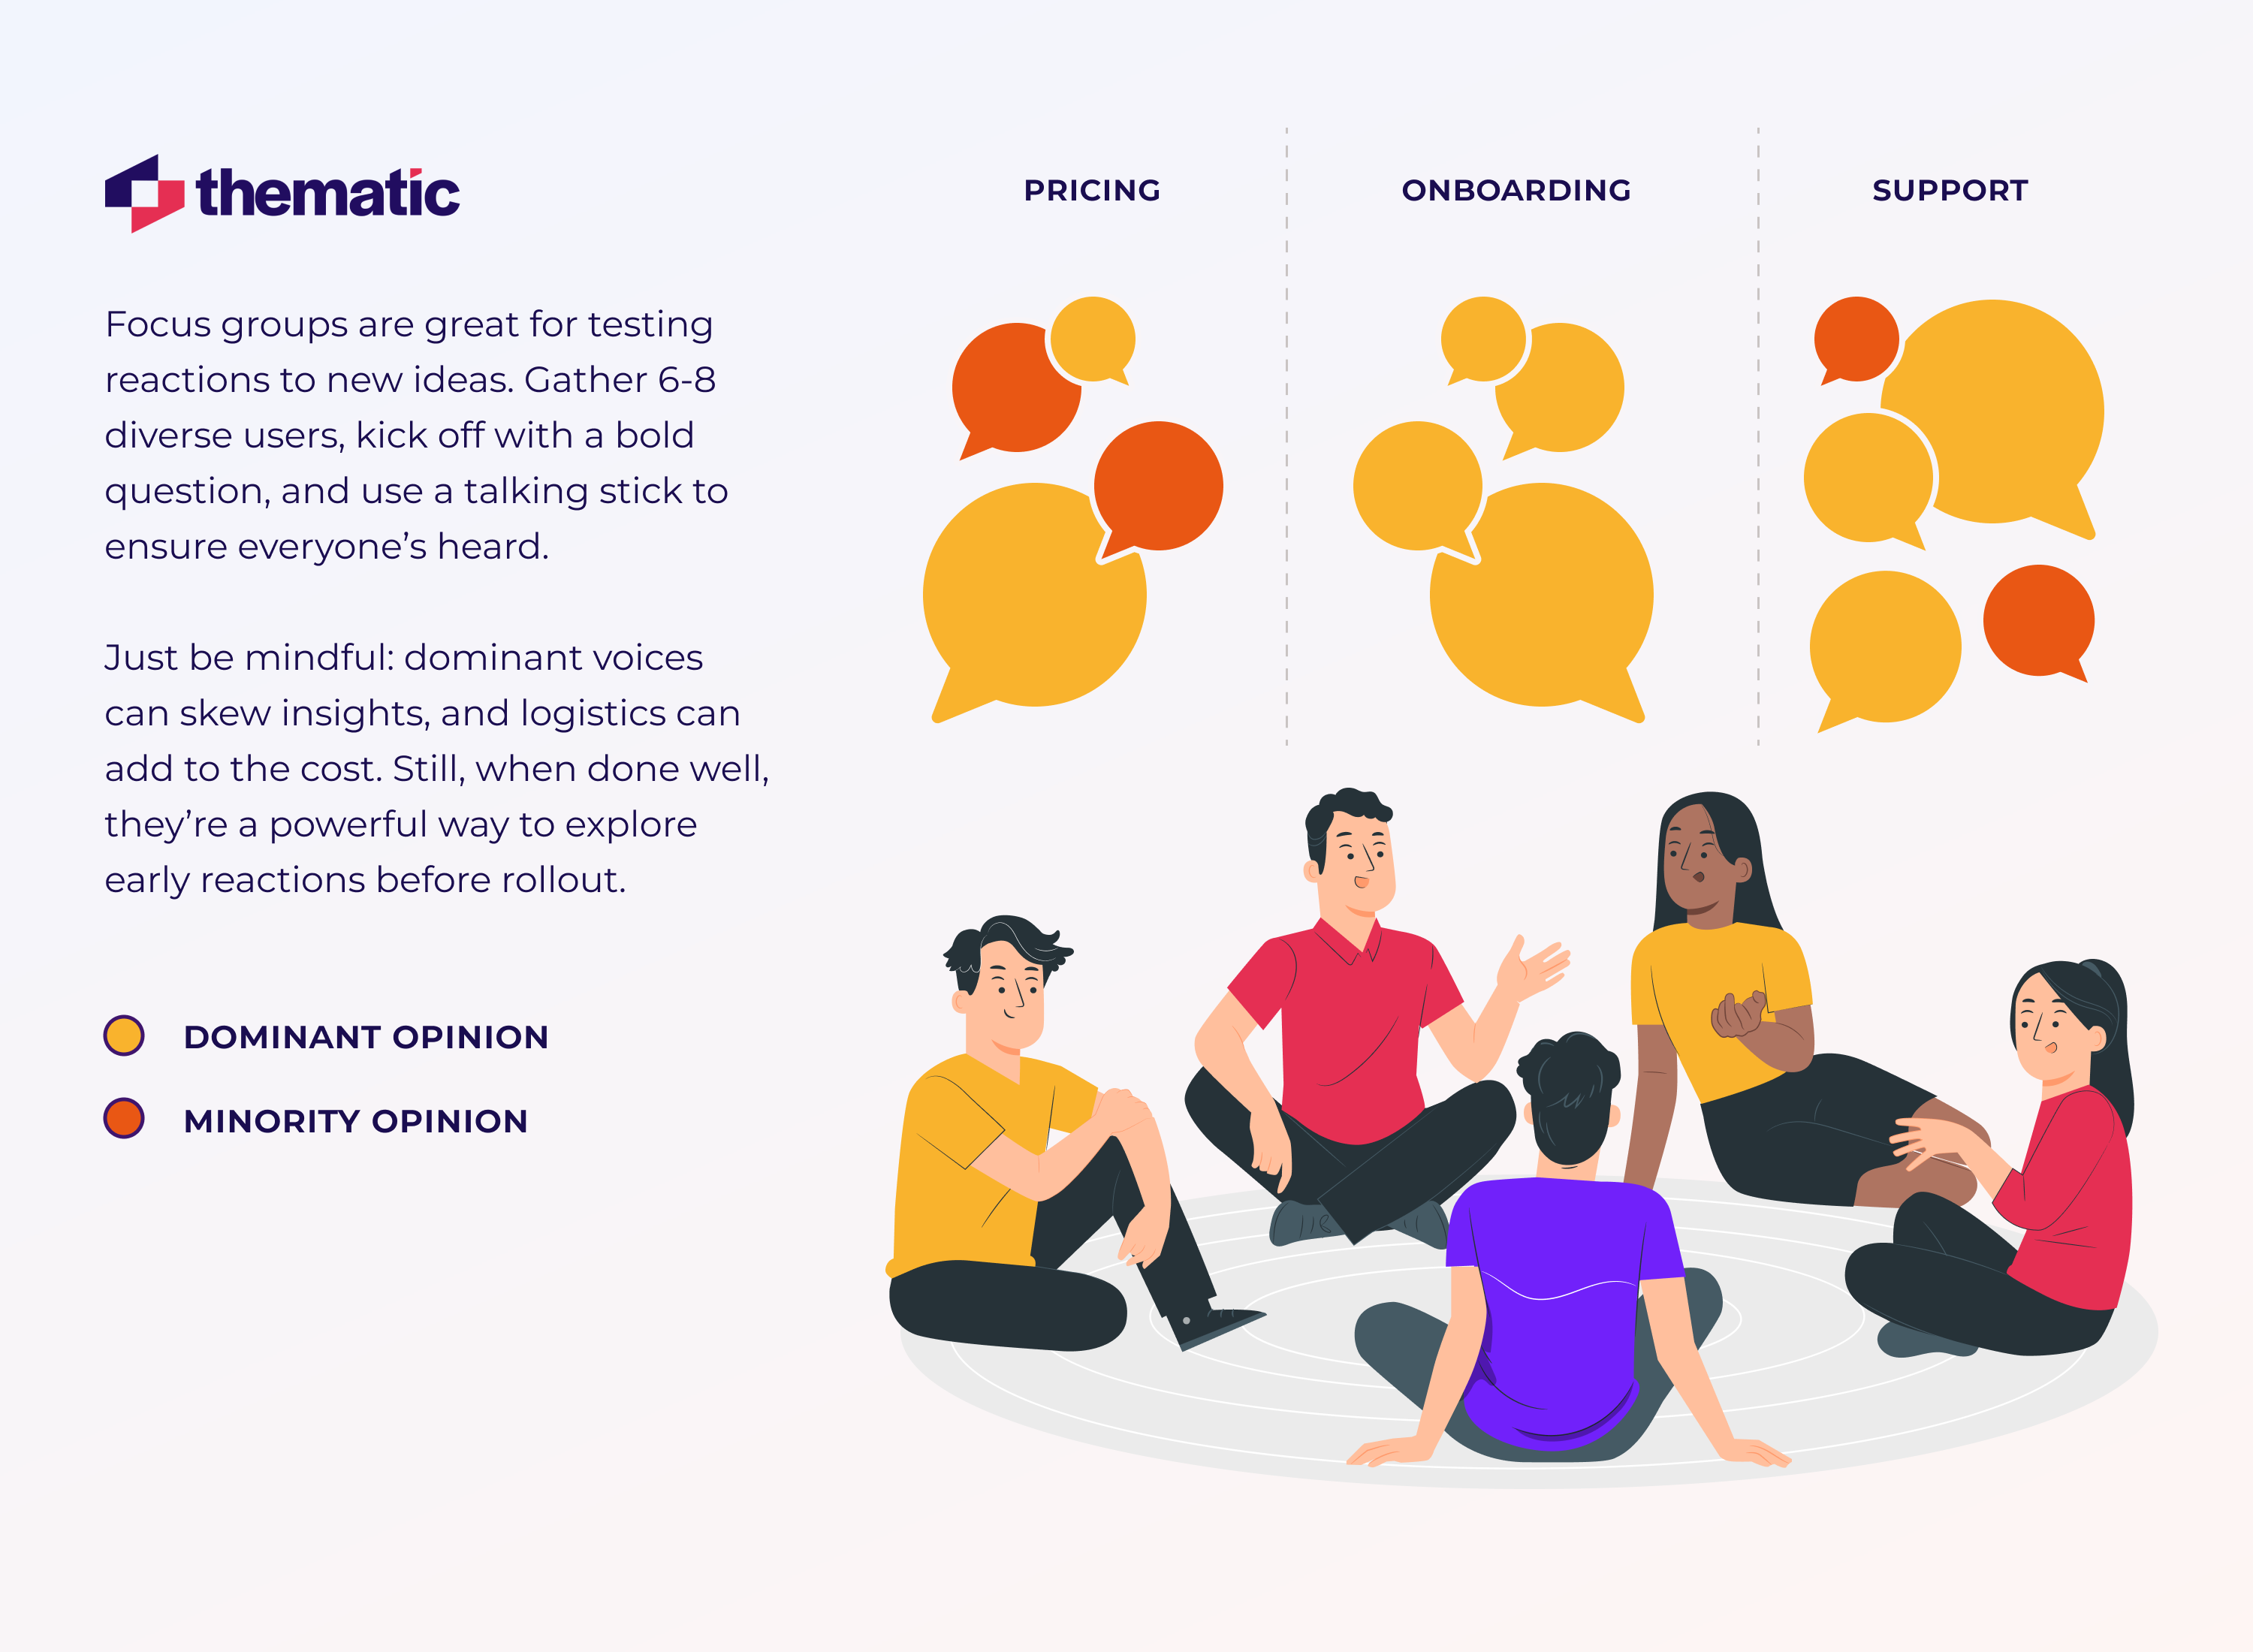
Focus Groups
There’s nothing like a live debate to surface hidden consensus.
Small group discussions spark idea sharing and reveal group dynamics around new concepts. It is best when you’re testing reactions to new concepts or products before rollout.
It’s interactive and captures group dynamics. But dominant voices can skew the results.
Also, logistical challenges add to the cost.
But if you do decide to go this way, remember these:
Gather 6–8 diverse users (you get more ideas that way)
Get a mo
Kick off with a provocative question (e.g., “What part of onboarding drove you up the wall?”)
Use a rotating talking stick (yes, literally) to ensure everyone gets airtime.
Of course, not all feedback needs to be invited. Some of the best insights happen out in the wild, as in, social media.
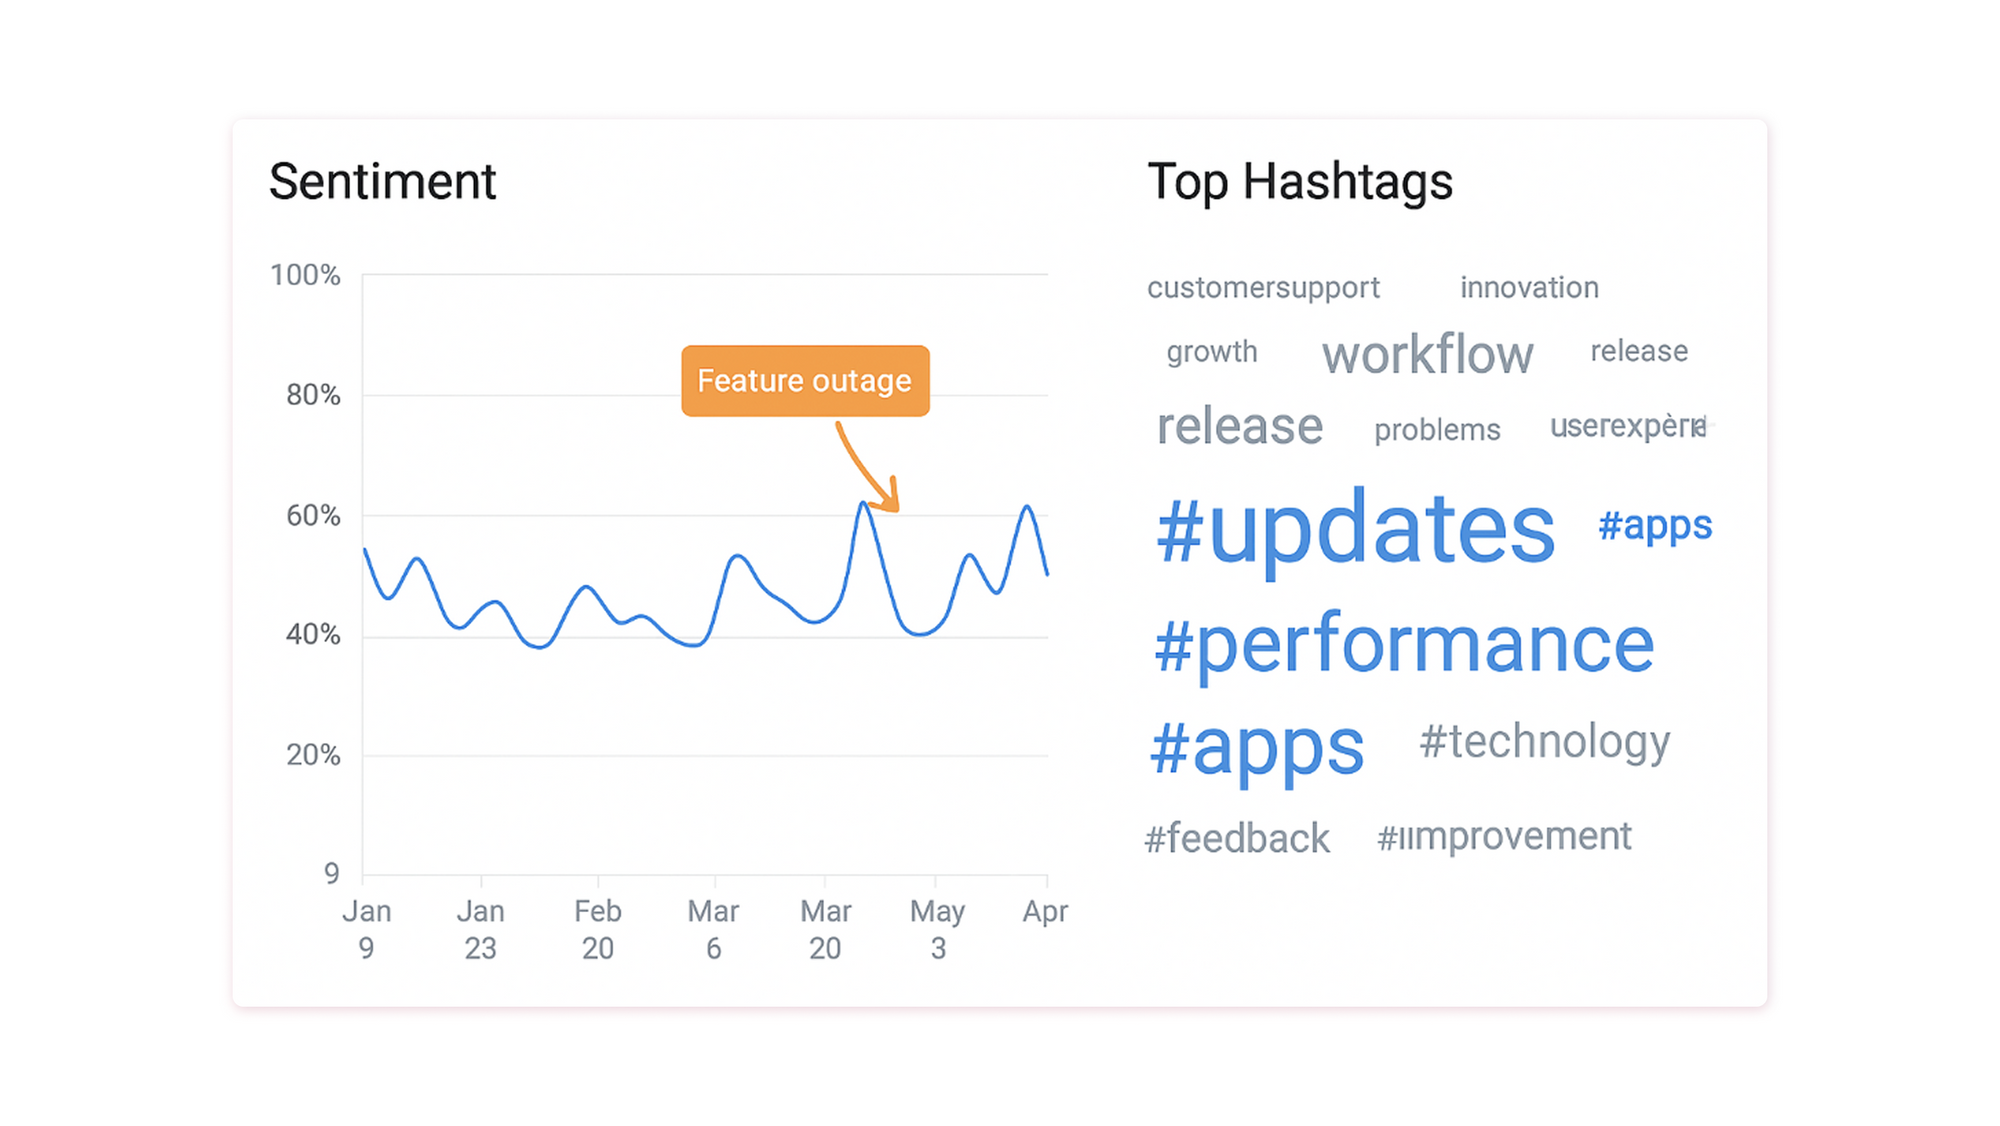
Social Media Listening
Your brand lives on social, so do your fans and critics. If you want to know what they say about you, you'd better be where they are and listen.
The upside of social listening is that you get access to unsolicited, unfiltered feedback. So you get honest feedback. But the data is going to be very unstructured and may be skewed.
You’ll need advanced analytics to do this well.
Still, it’s best for monitoring brand perception in real time or catching emerging issues fast. Starbucks does this really well. They hang out on X to see in real time what people are saying about a new drink. Then, they’ll do tweaks on that drink based on the common theme they gather.
So, go ahead and set alerts for your product name and key features, and make sure to scan daily.
If you get a sudden flood of complaints, then congratulations, you’ve found a live fire to extinguish before it spreads.
And just like tweets, public reviews show what customers say when no one's watching. Let’s see what it does.
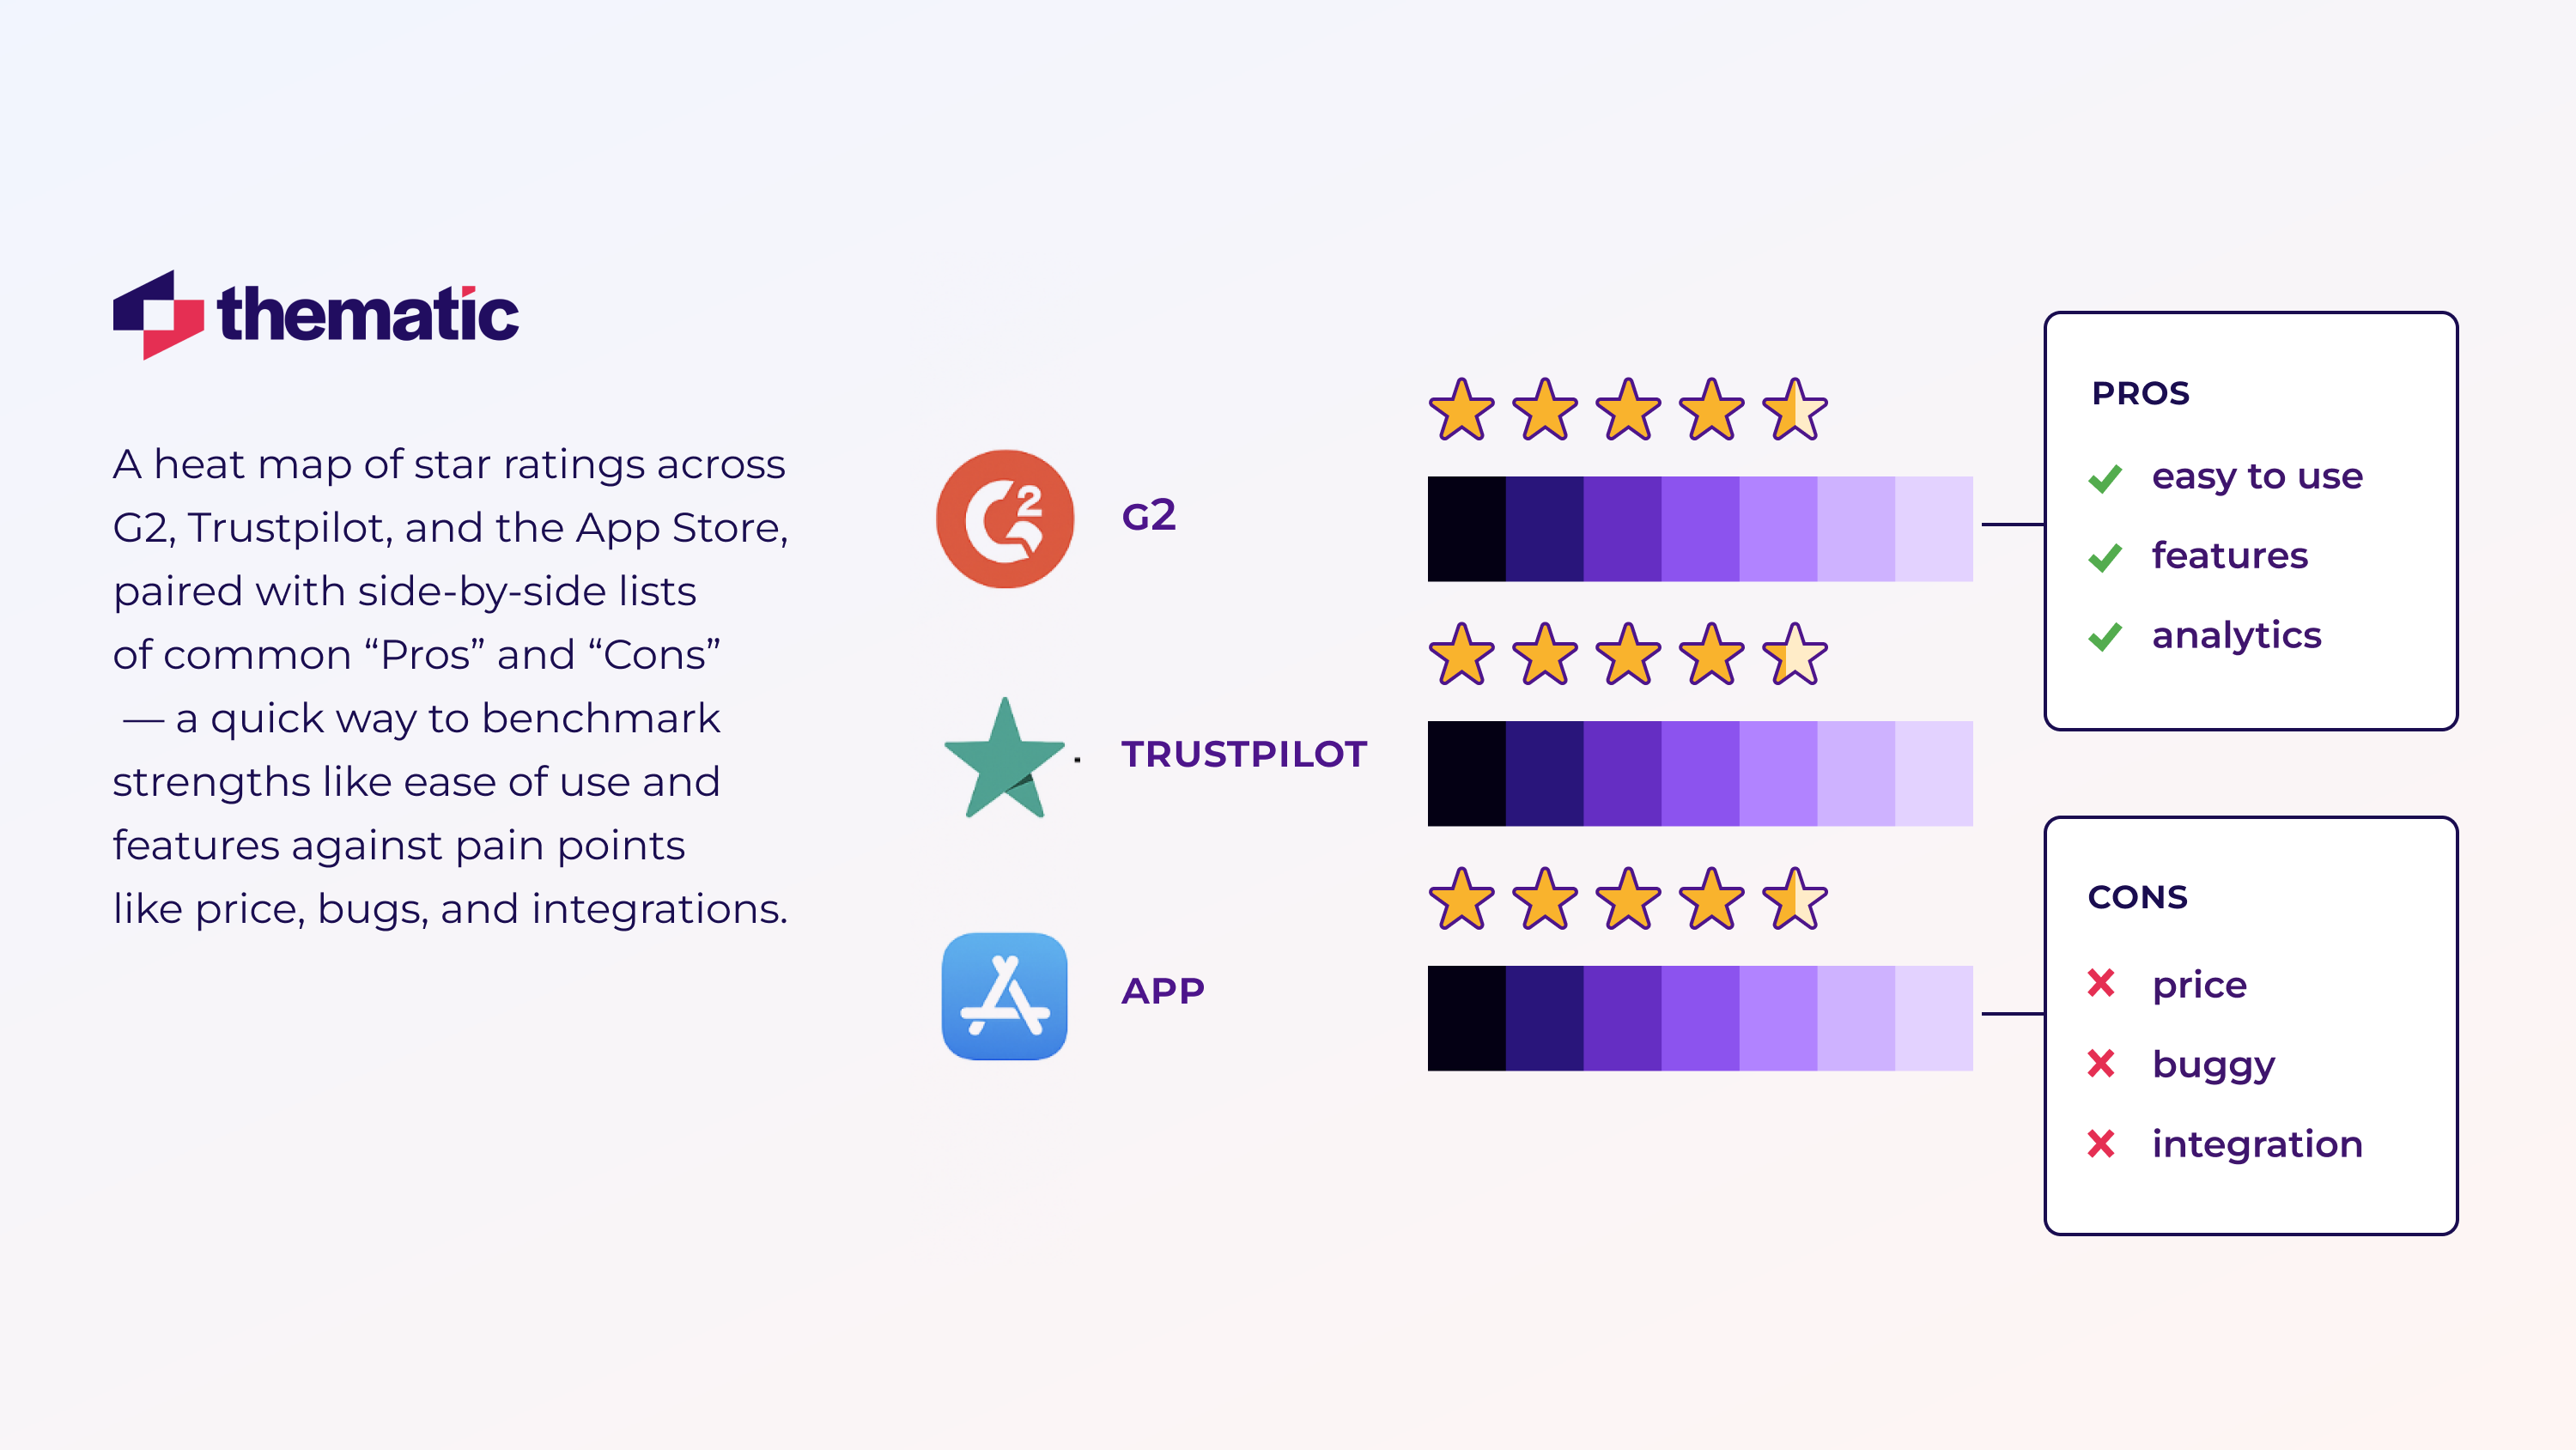
Online Reviews & Feedback
Post-purchase reviews are public and honest. You’ll see genuine praise and pain points side by side. No need to prompt.
The challenge is separating signal from extreme outliers. Yes, there’s the possibility of fake reviews, and what you get may not represent your full audience.
But it still helps to get these reviews, so pull in 100+ recent reviews. Highlight recurring words, and turn those into your next improvement tickets.
Better yet, integrate your review platform with tools like Thematic and let it pull reviews for you and analyze them.
Still, even the most honest comment can miss what users actually do. That’s why behavior analytics matters. Numbers don’t lie, remember?.
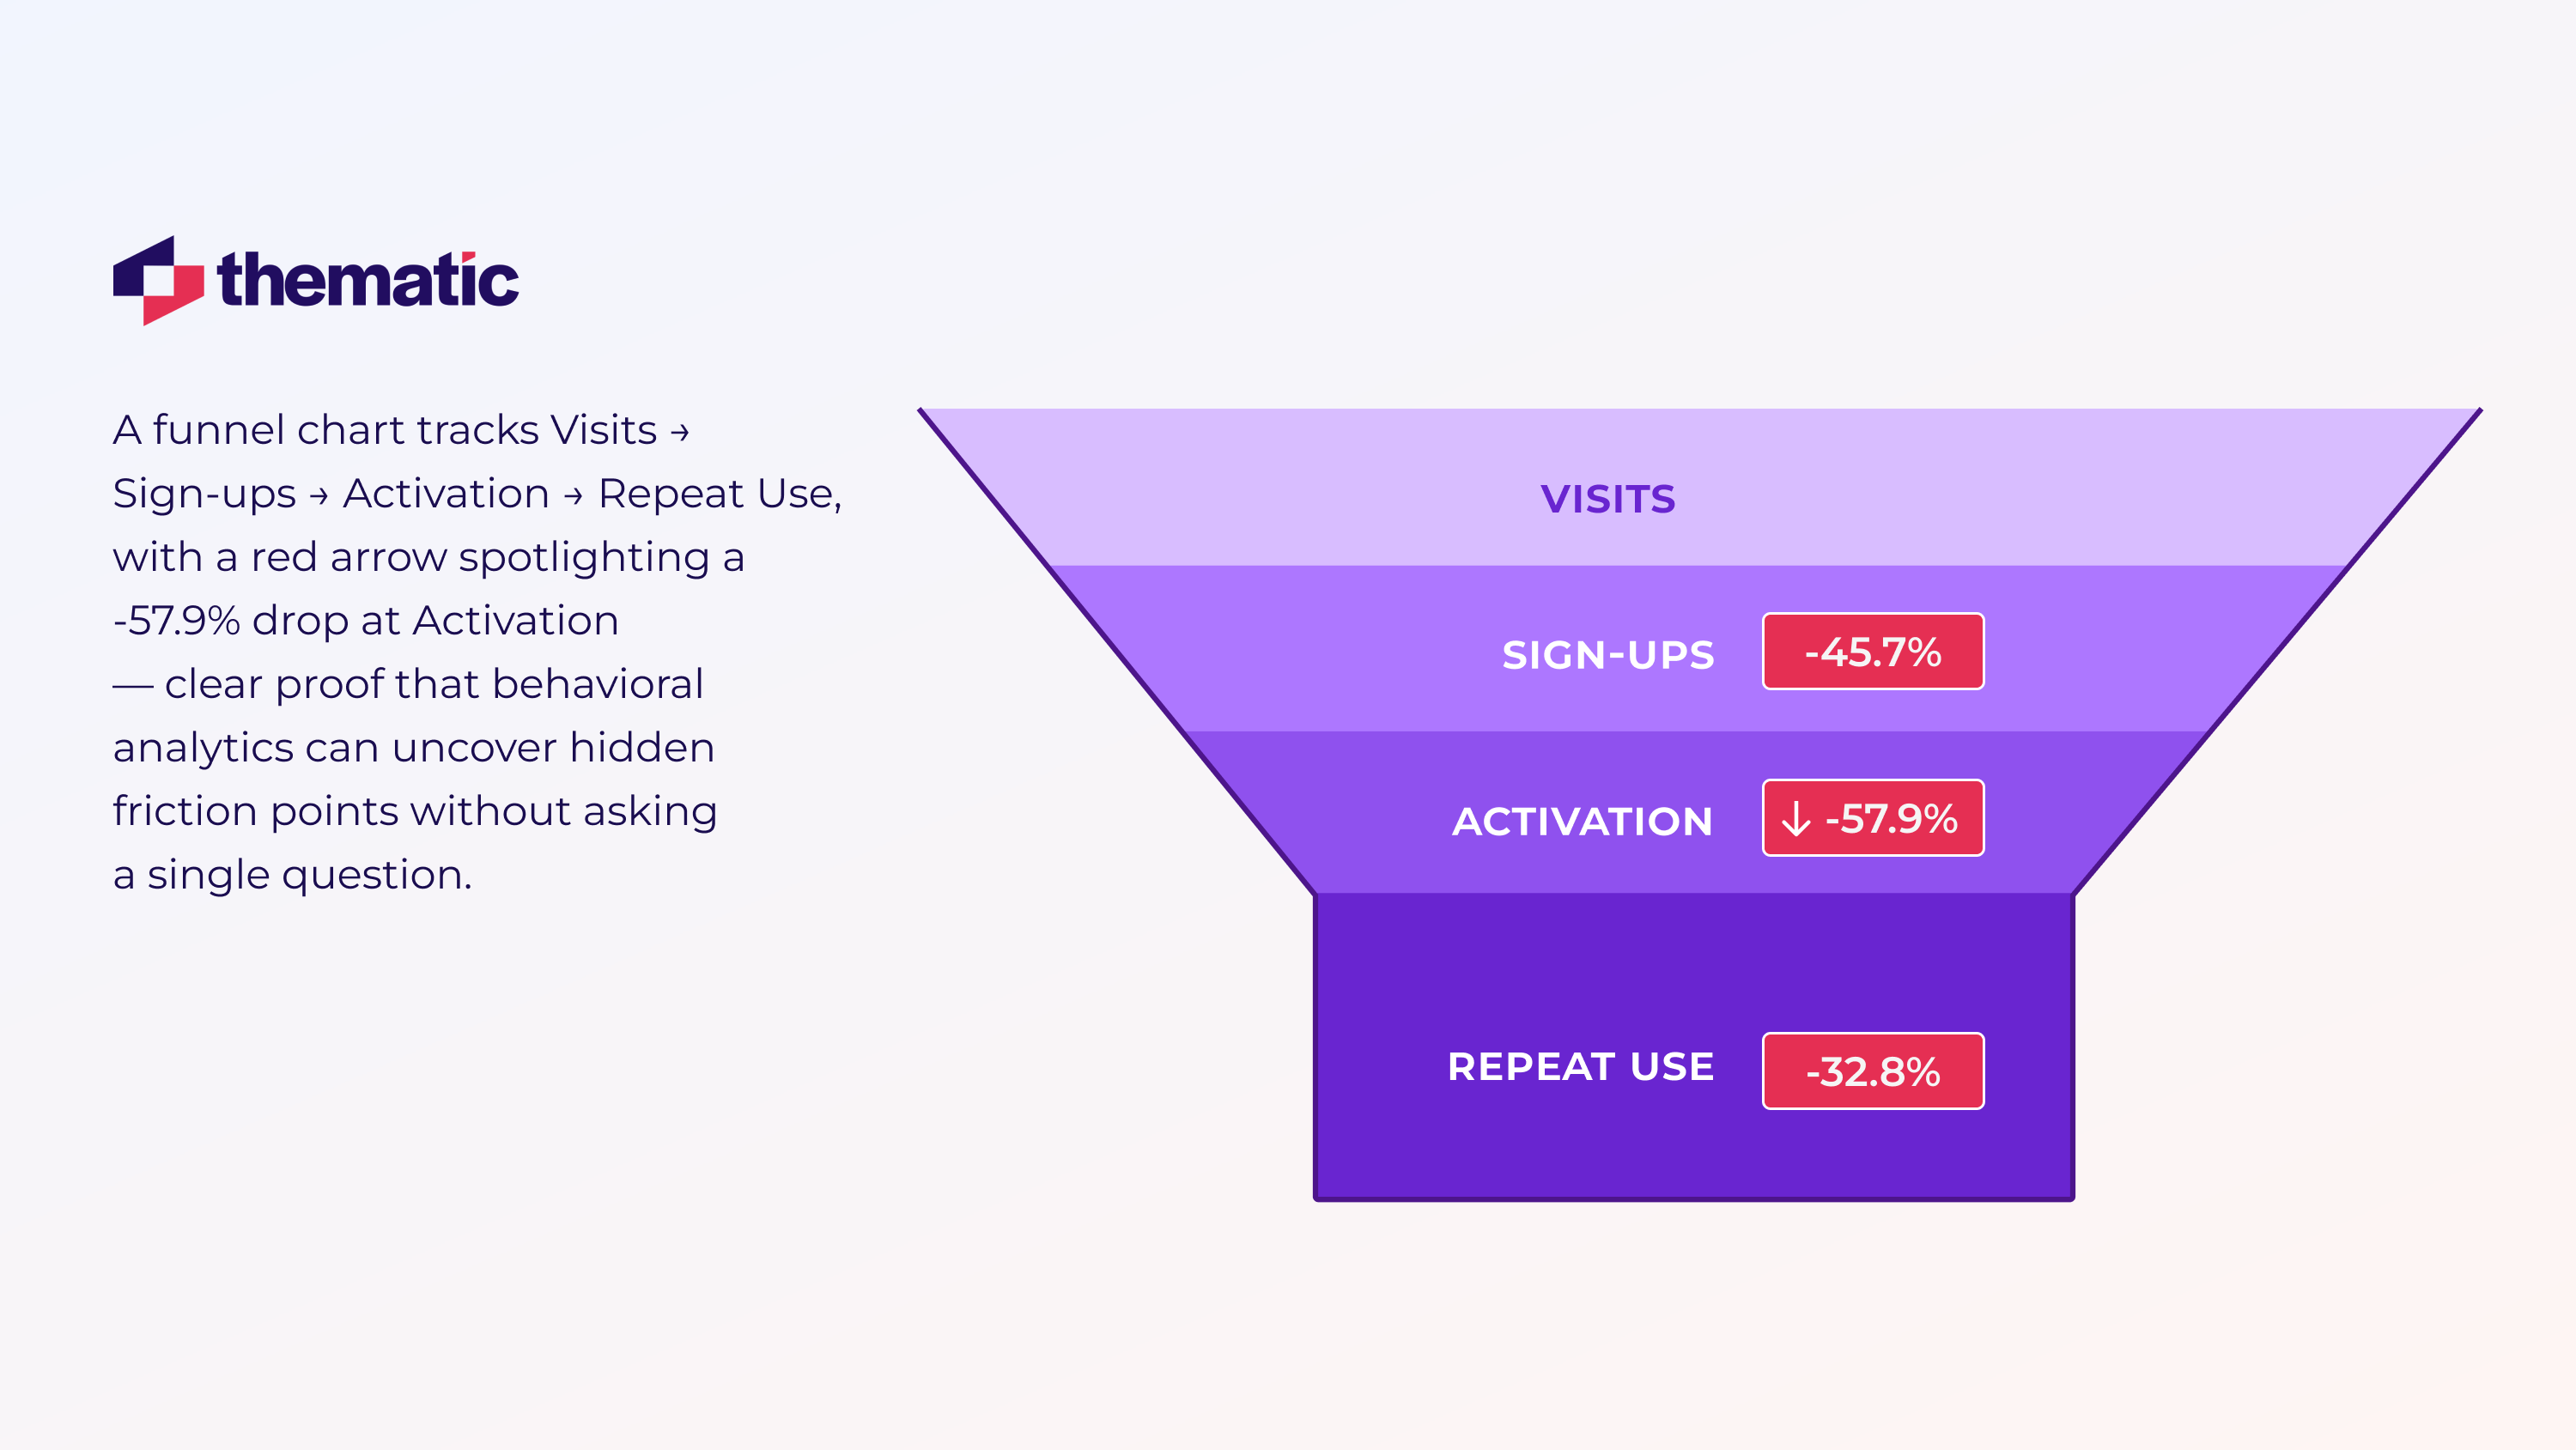
Behavioral Data Analysis
Metrics don’t lie: your analytics tool will show exactly where users stall. Drill into your funnel.
Visits → Sign-ups → Activation → Repeat Use
Spot the biggest drop-off.
That’s your silent friction point.
Behavioral data analysis is highly scalable and objective. But it lacks contextual “why.” It also demands a robust data infrastructure.
What to do then?
Pair that finding with survey questions or interview prompts to understand the “why.”
Use analytics tools.
Next up: Chapter 3 reveals which frameworks weave these methods into a unified, action-ready VoC program.
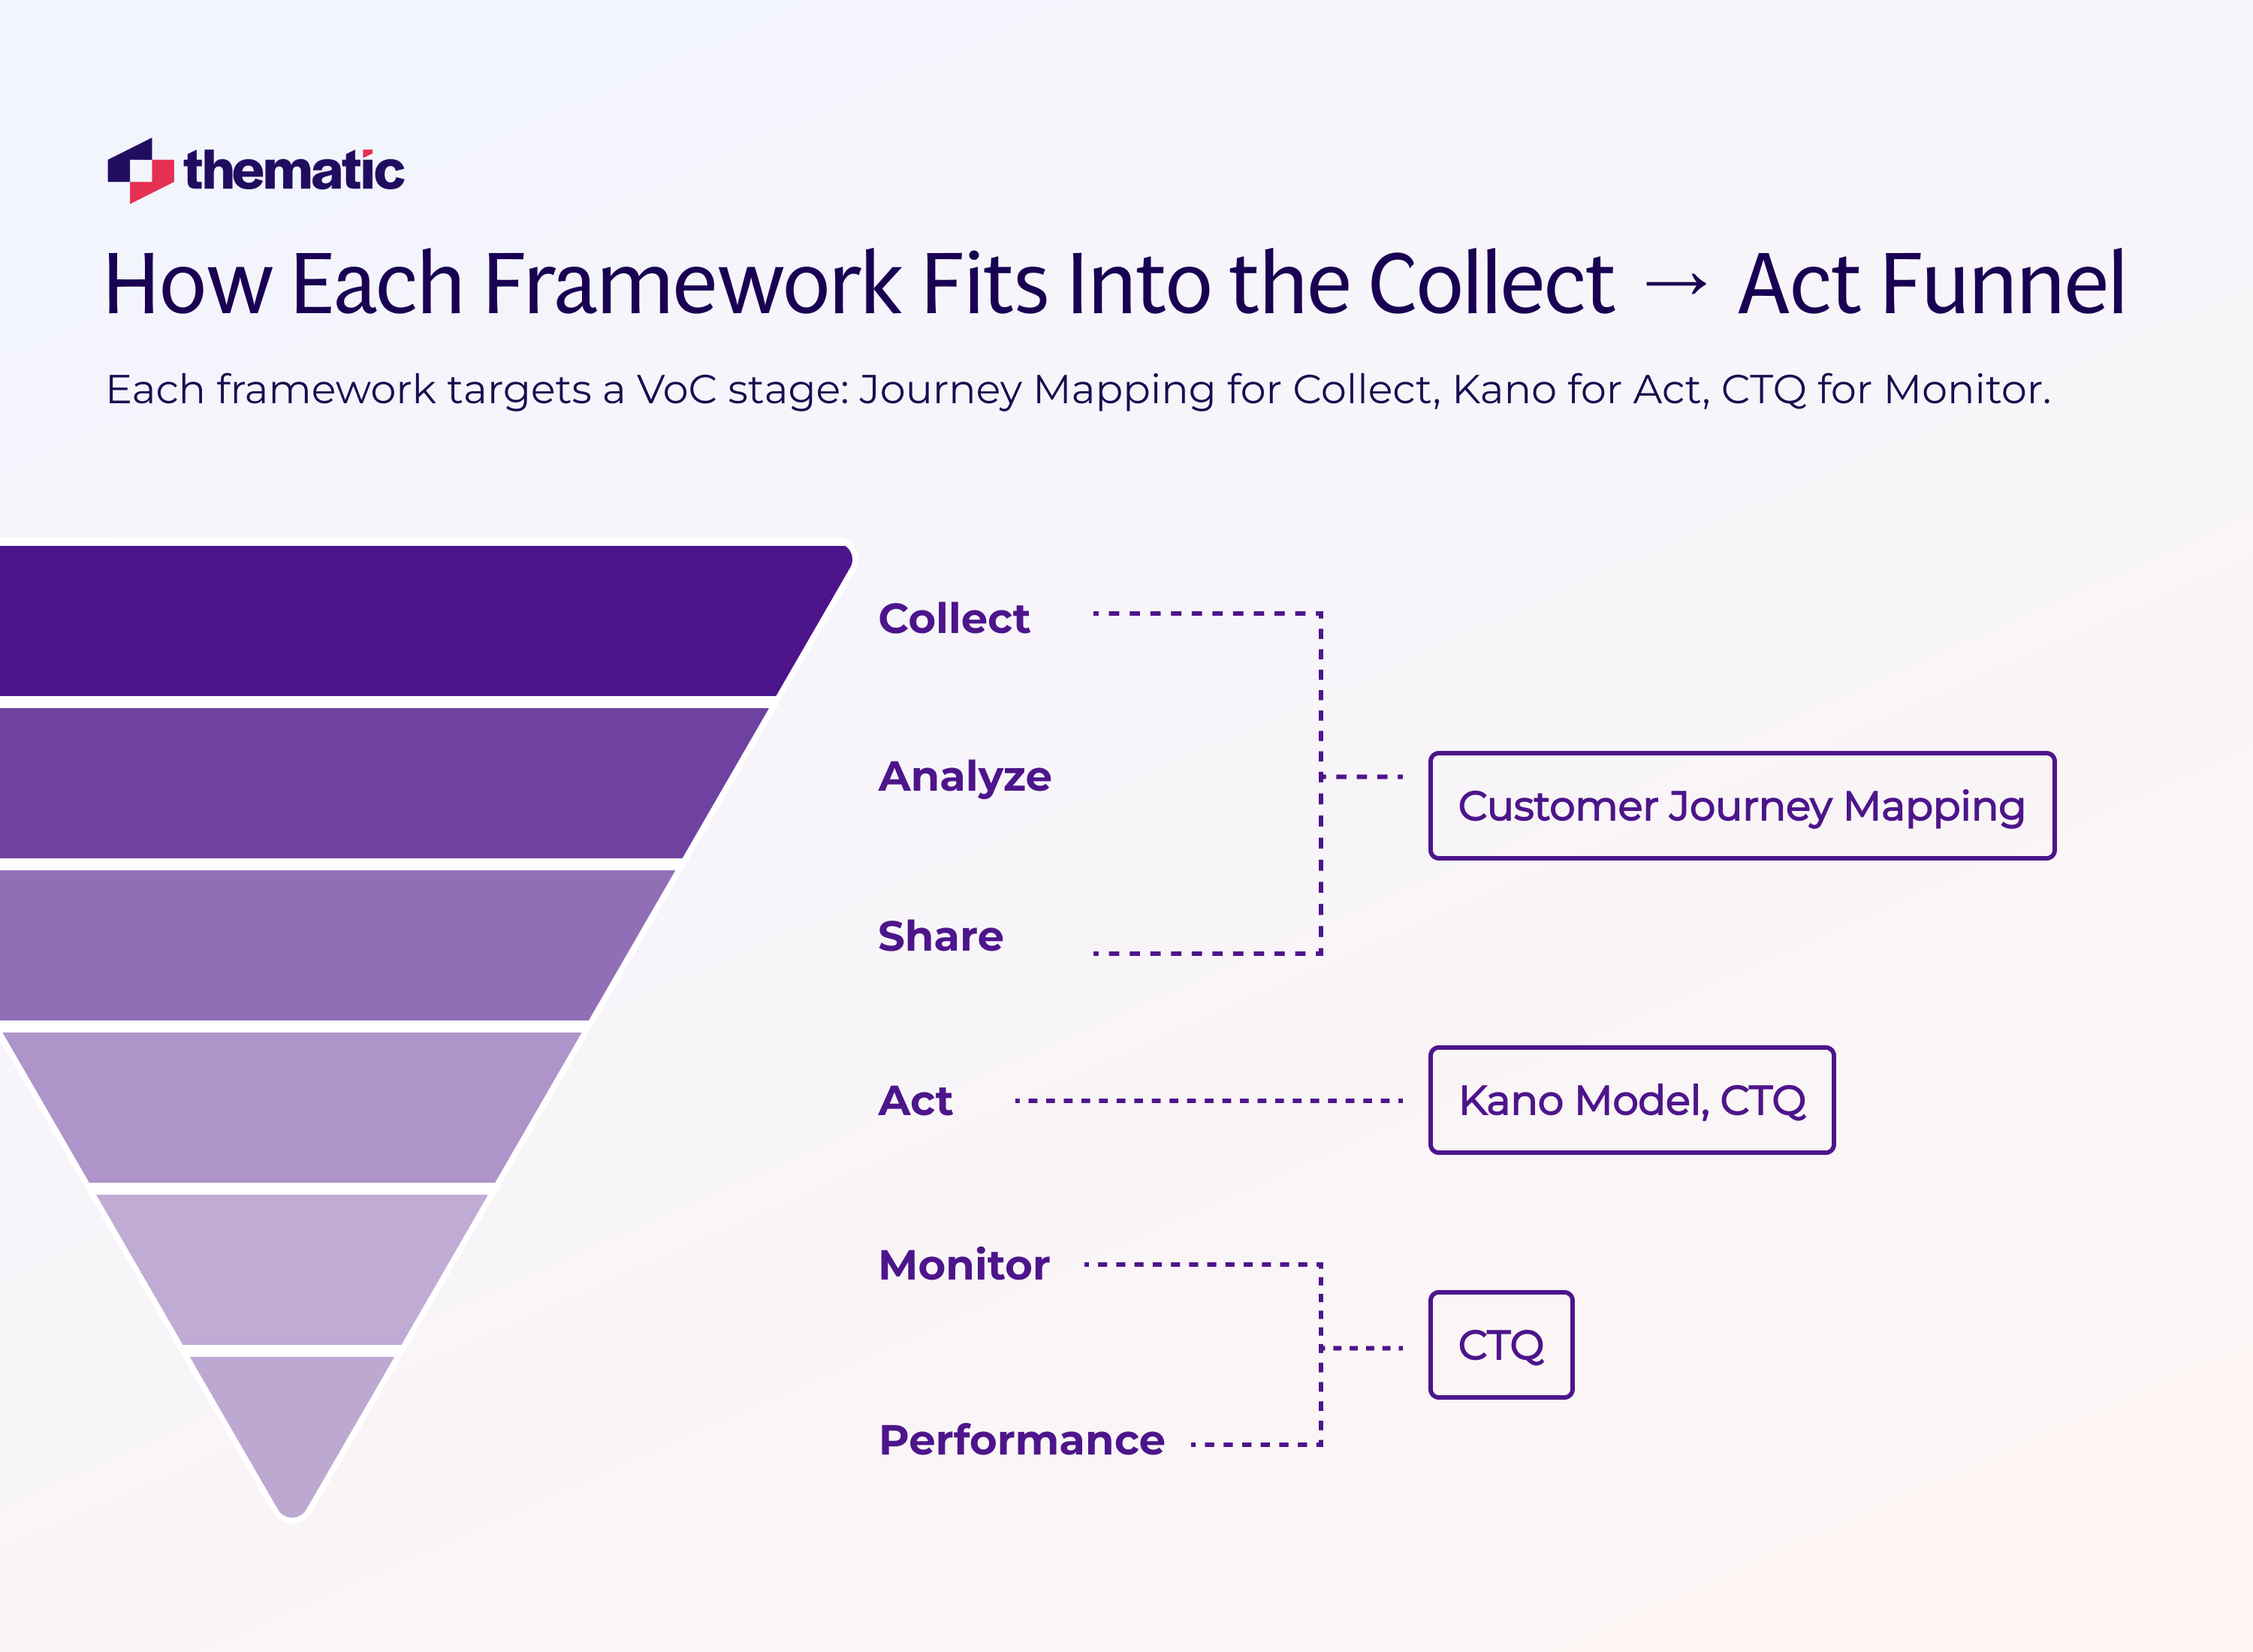
Frameworks to Structure Your VoC Program
So you’ve gathered data. You’ve spotted the themes. But without a system to connect these insights to actions, even the best feedback fades away.
So we have here four frameworks. They’ll like your VoC operating systems. They’re the infrastructure to help your team to go from listen to act.
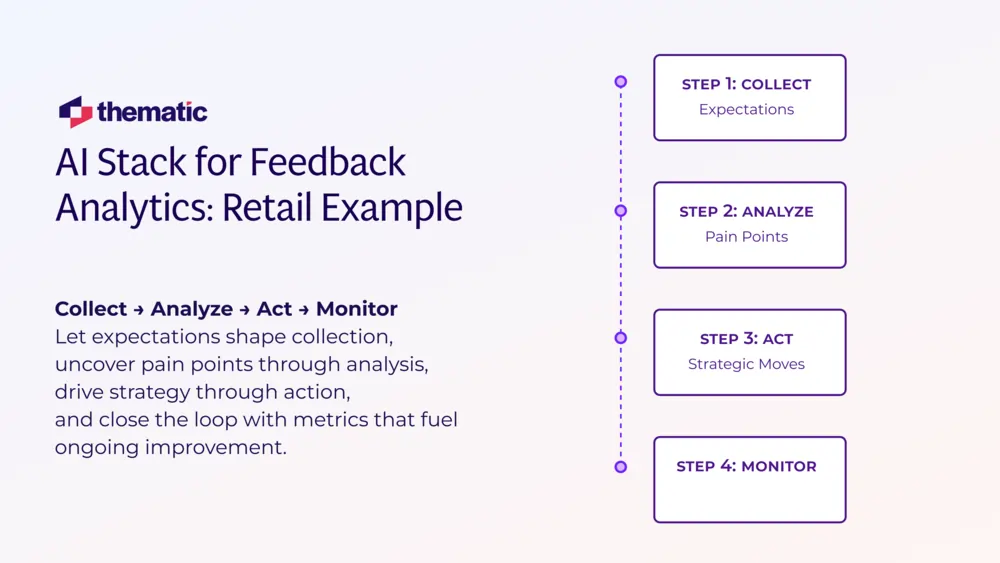
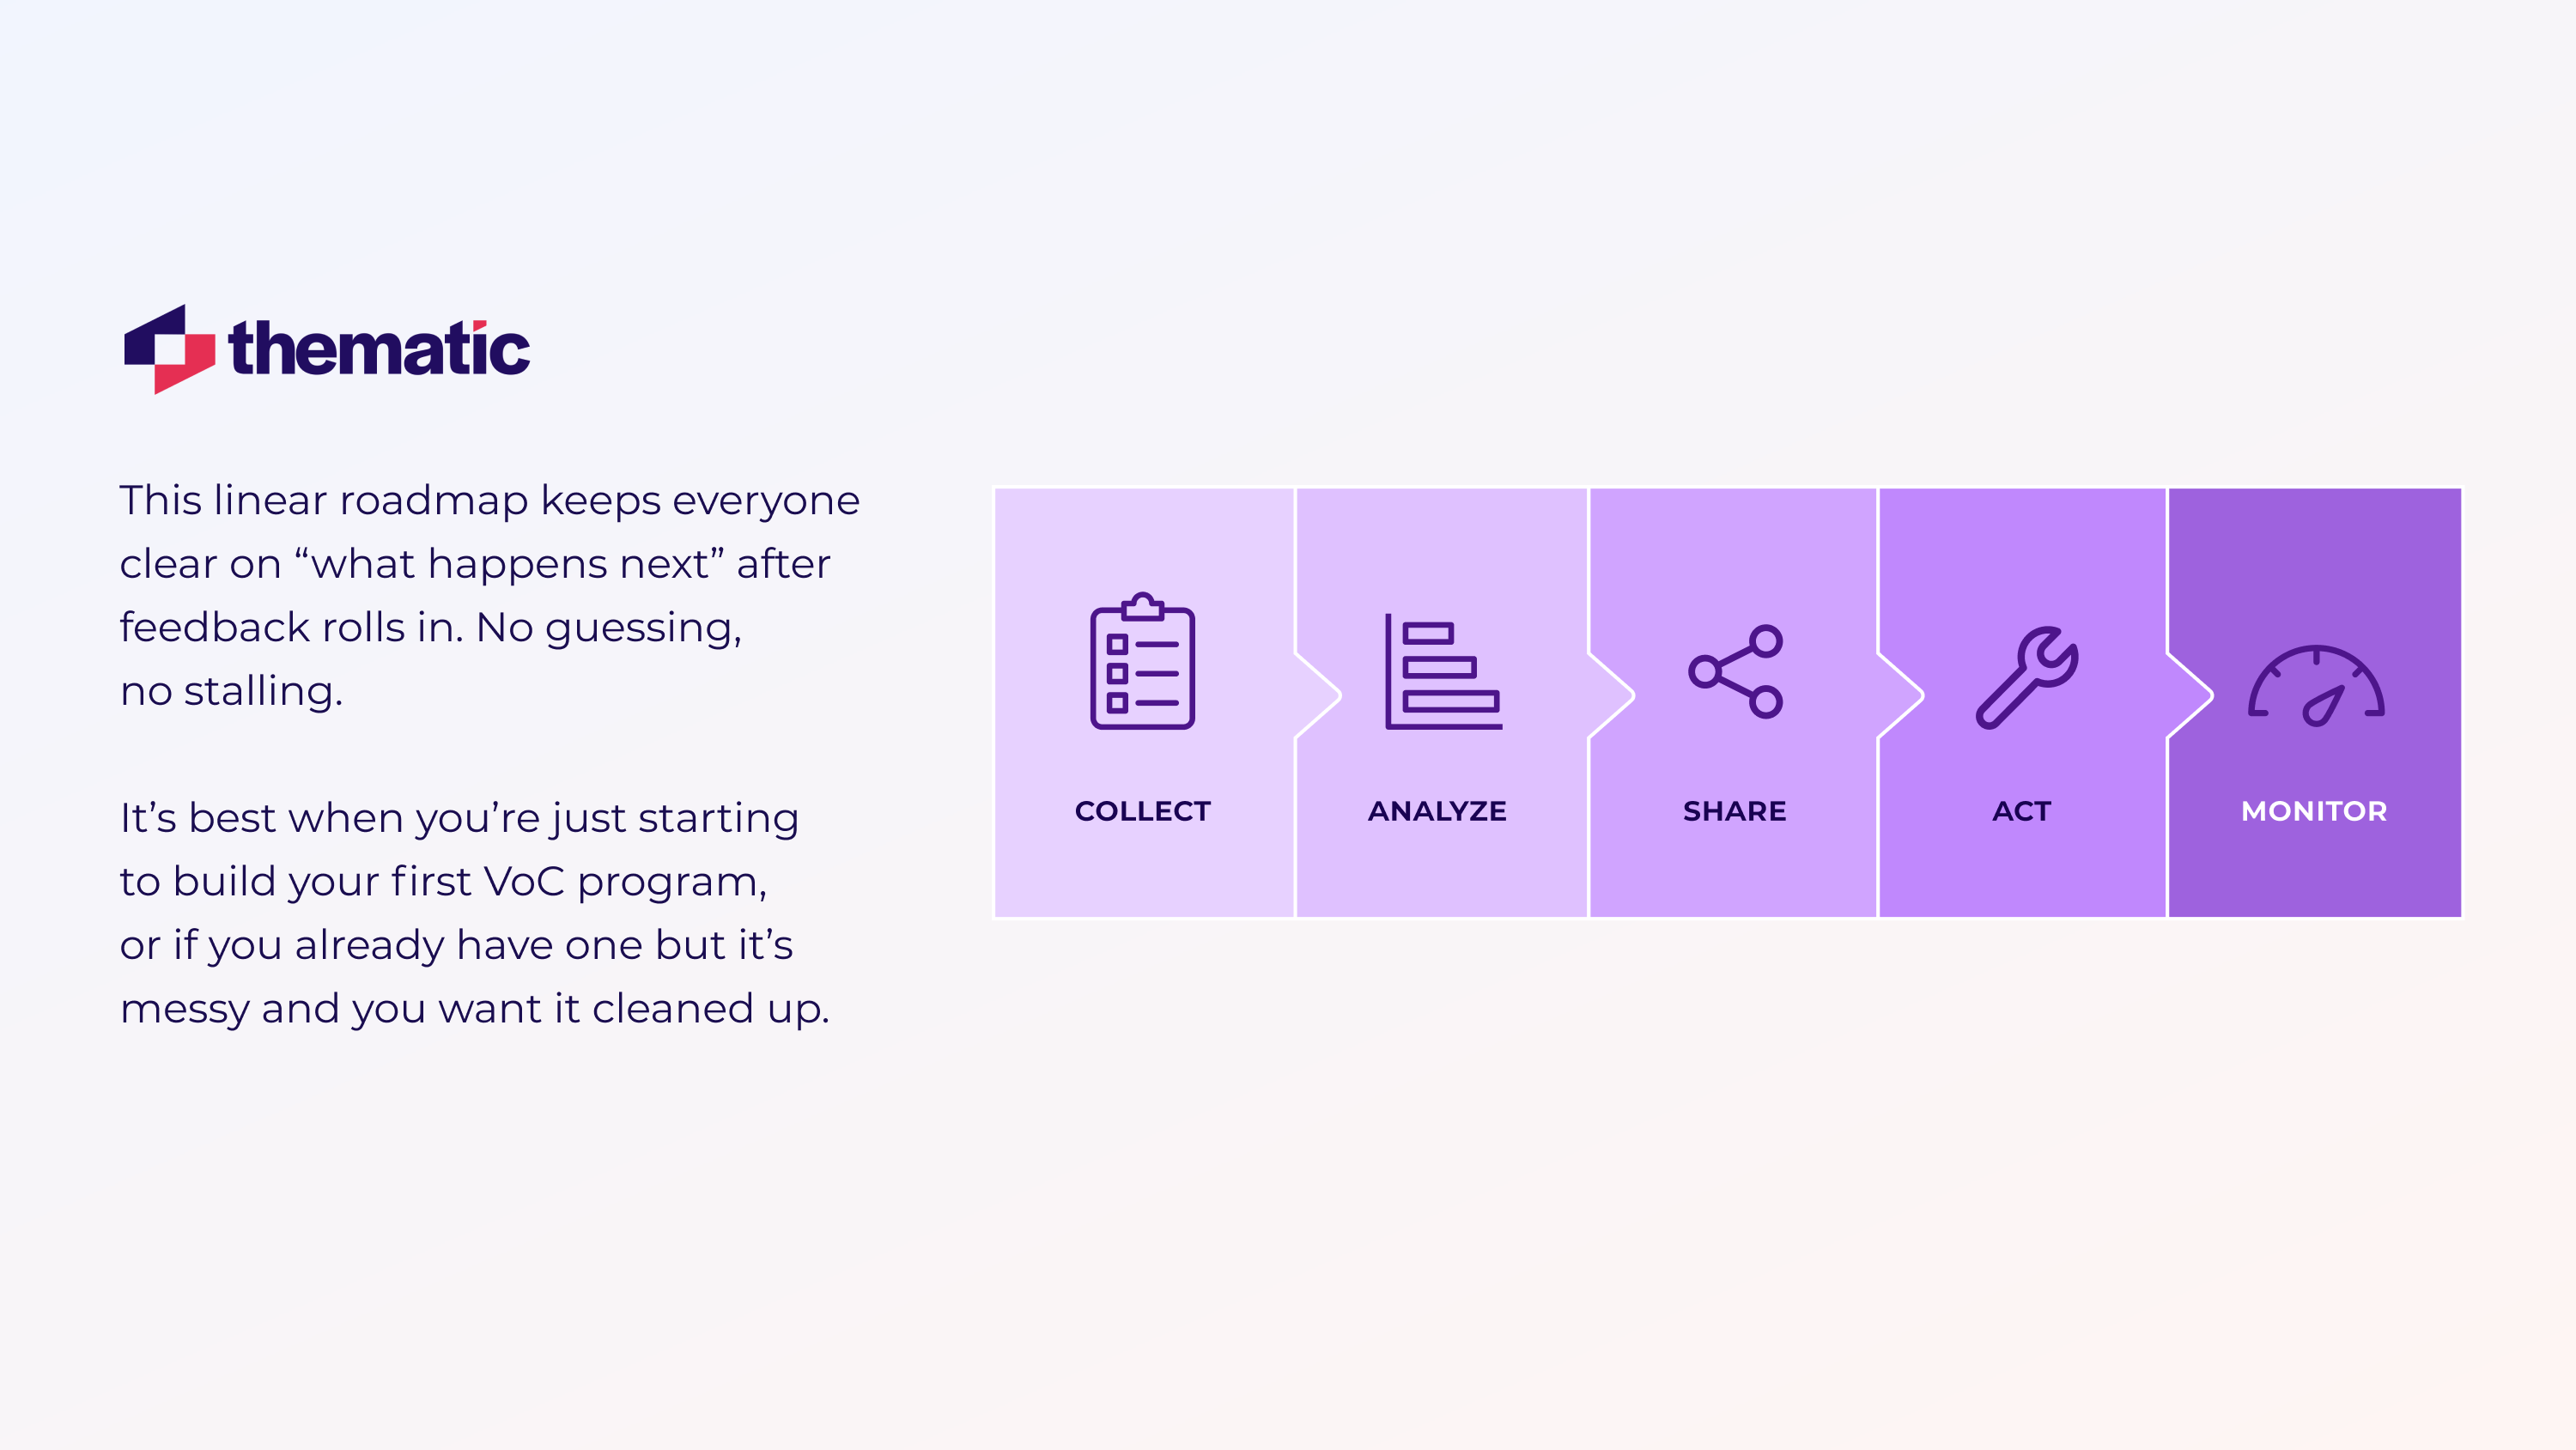
Five-Stage VoC Model
Let’s start with the basics. Here’s a model that sets a simple but powerful path.
Collect → Analyze → Share → Act → Monitor.
This linear roadmap keeps everyone clear on “what happens next” after feedback rolls in. No guessing, no stalling.
It’s best when you’re just starting to build your first VoC program, or if you already have one but it’s messy and you want it cleaned up.
.
Customer Journey Mapping
Okay, so you have a process in place. But you’re still left wondering, “Where exactly is the customer experience breaking down?”
Journey mapping helps you see this. It’s best if you need to prioritize fixes across long, multi-step experiences (e-commerce, SaaS onboarding).
Plot every major steps: Awareness → Purchase → Onboarding → Support
Layer the data on the map.
If you see a red zone, that’s where fixing is needed.
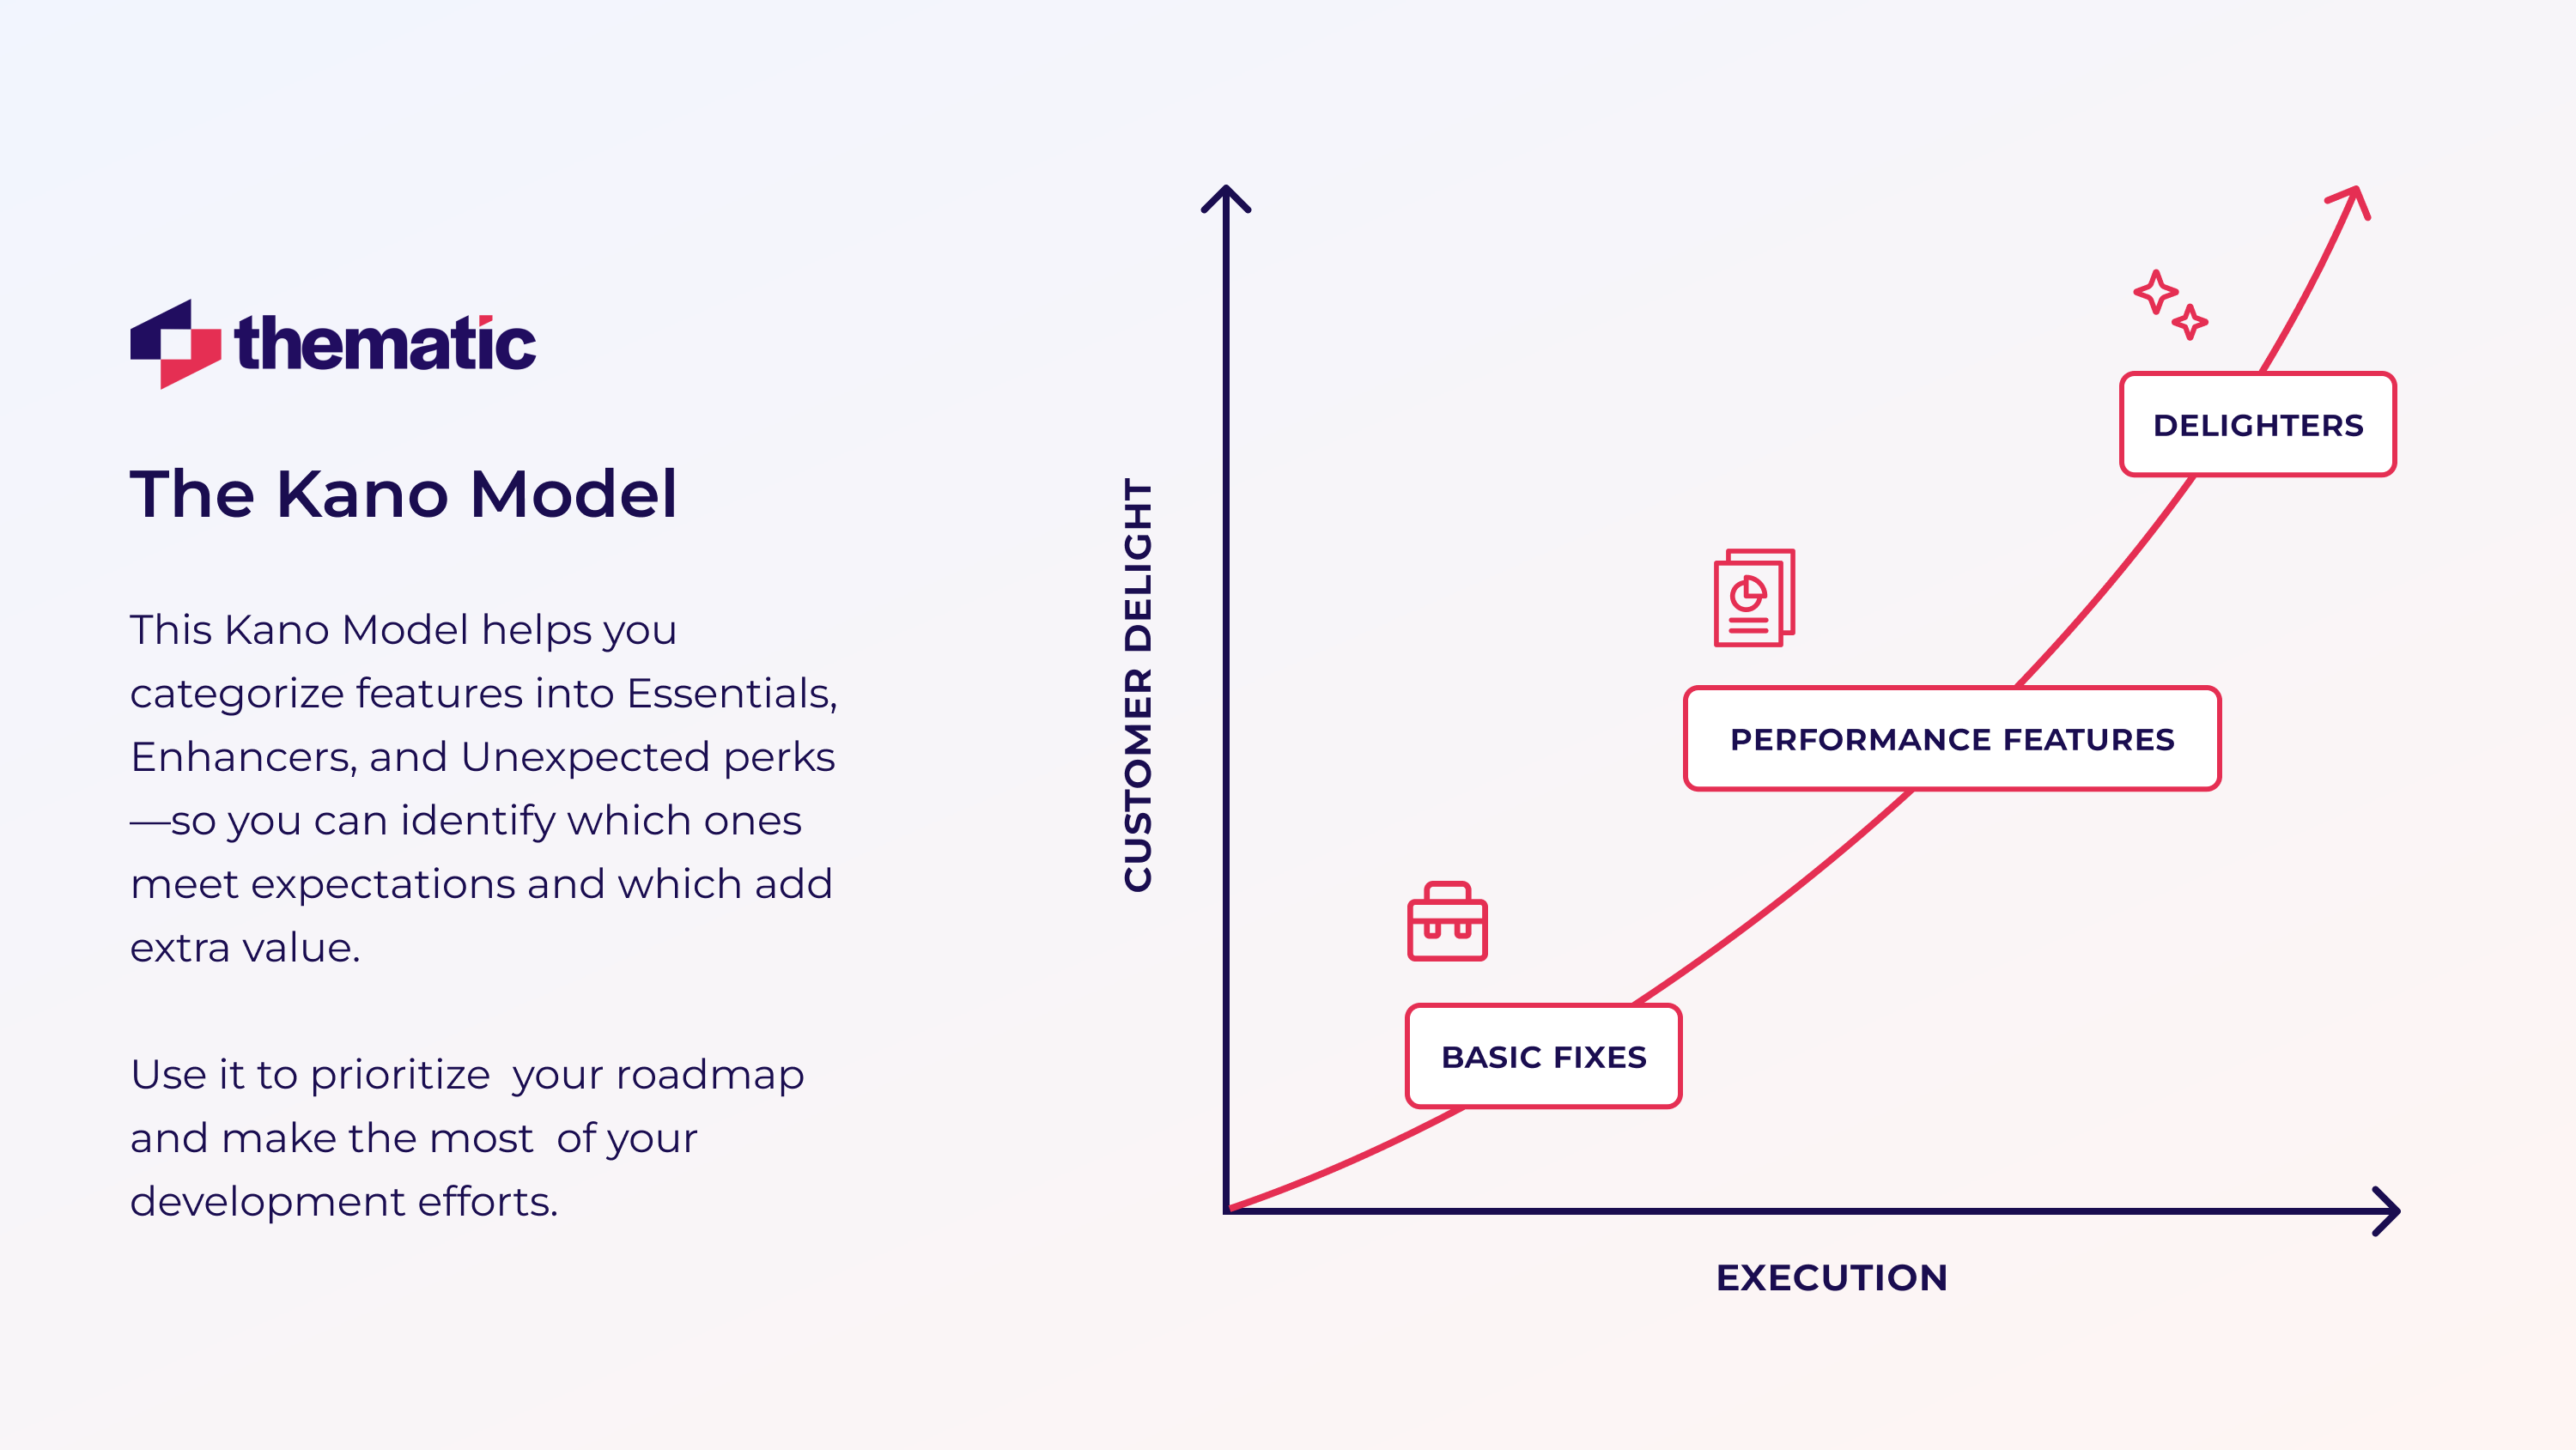
Kano Model
Some features are must-haves. Others make people say “wow!’.
The Kano Model helps you tell which is which, before you waste dev sprint on the wrong one.
Use this model when you want to prioritize a road map and want to stretch resources.
So, you sort features into Basic, Performance, and Delighters so you can decide which upgrades prevent dissatisfaction and which create wow moments.
Then you build accordingly.
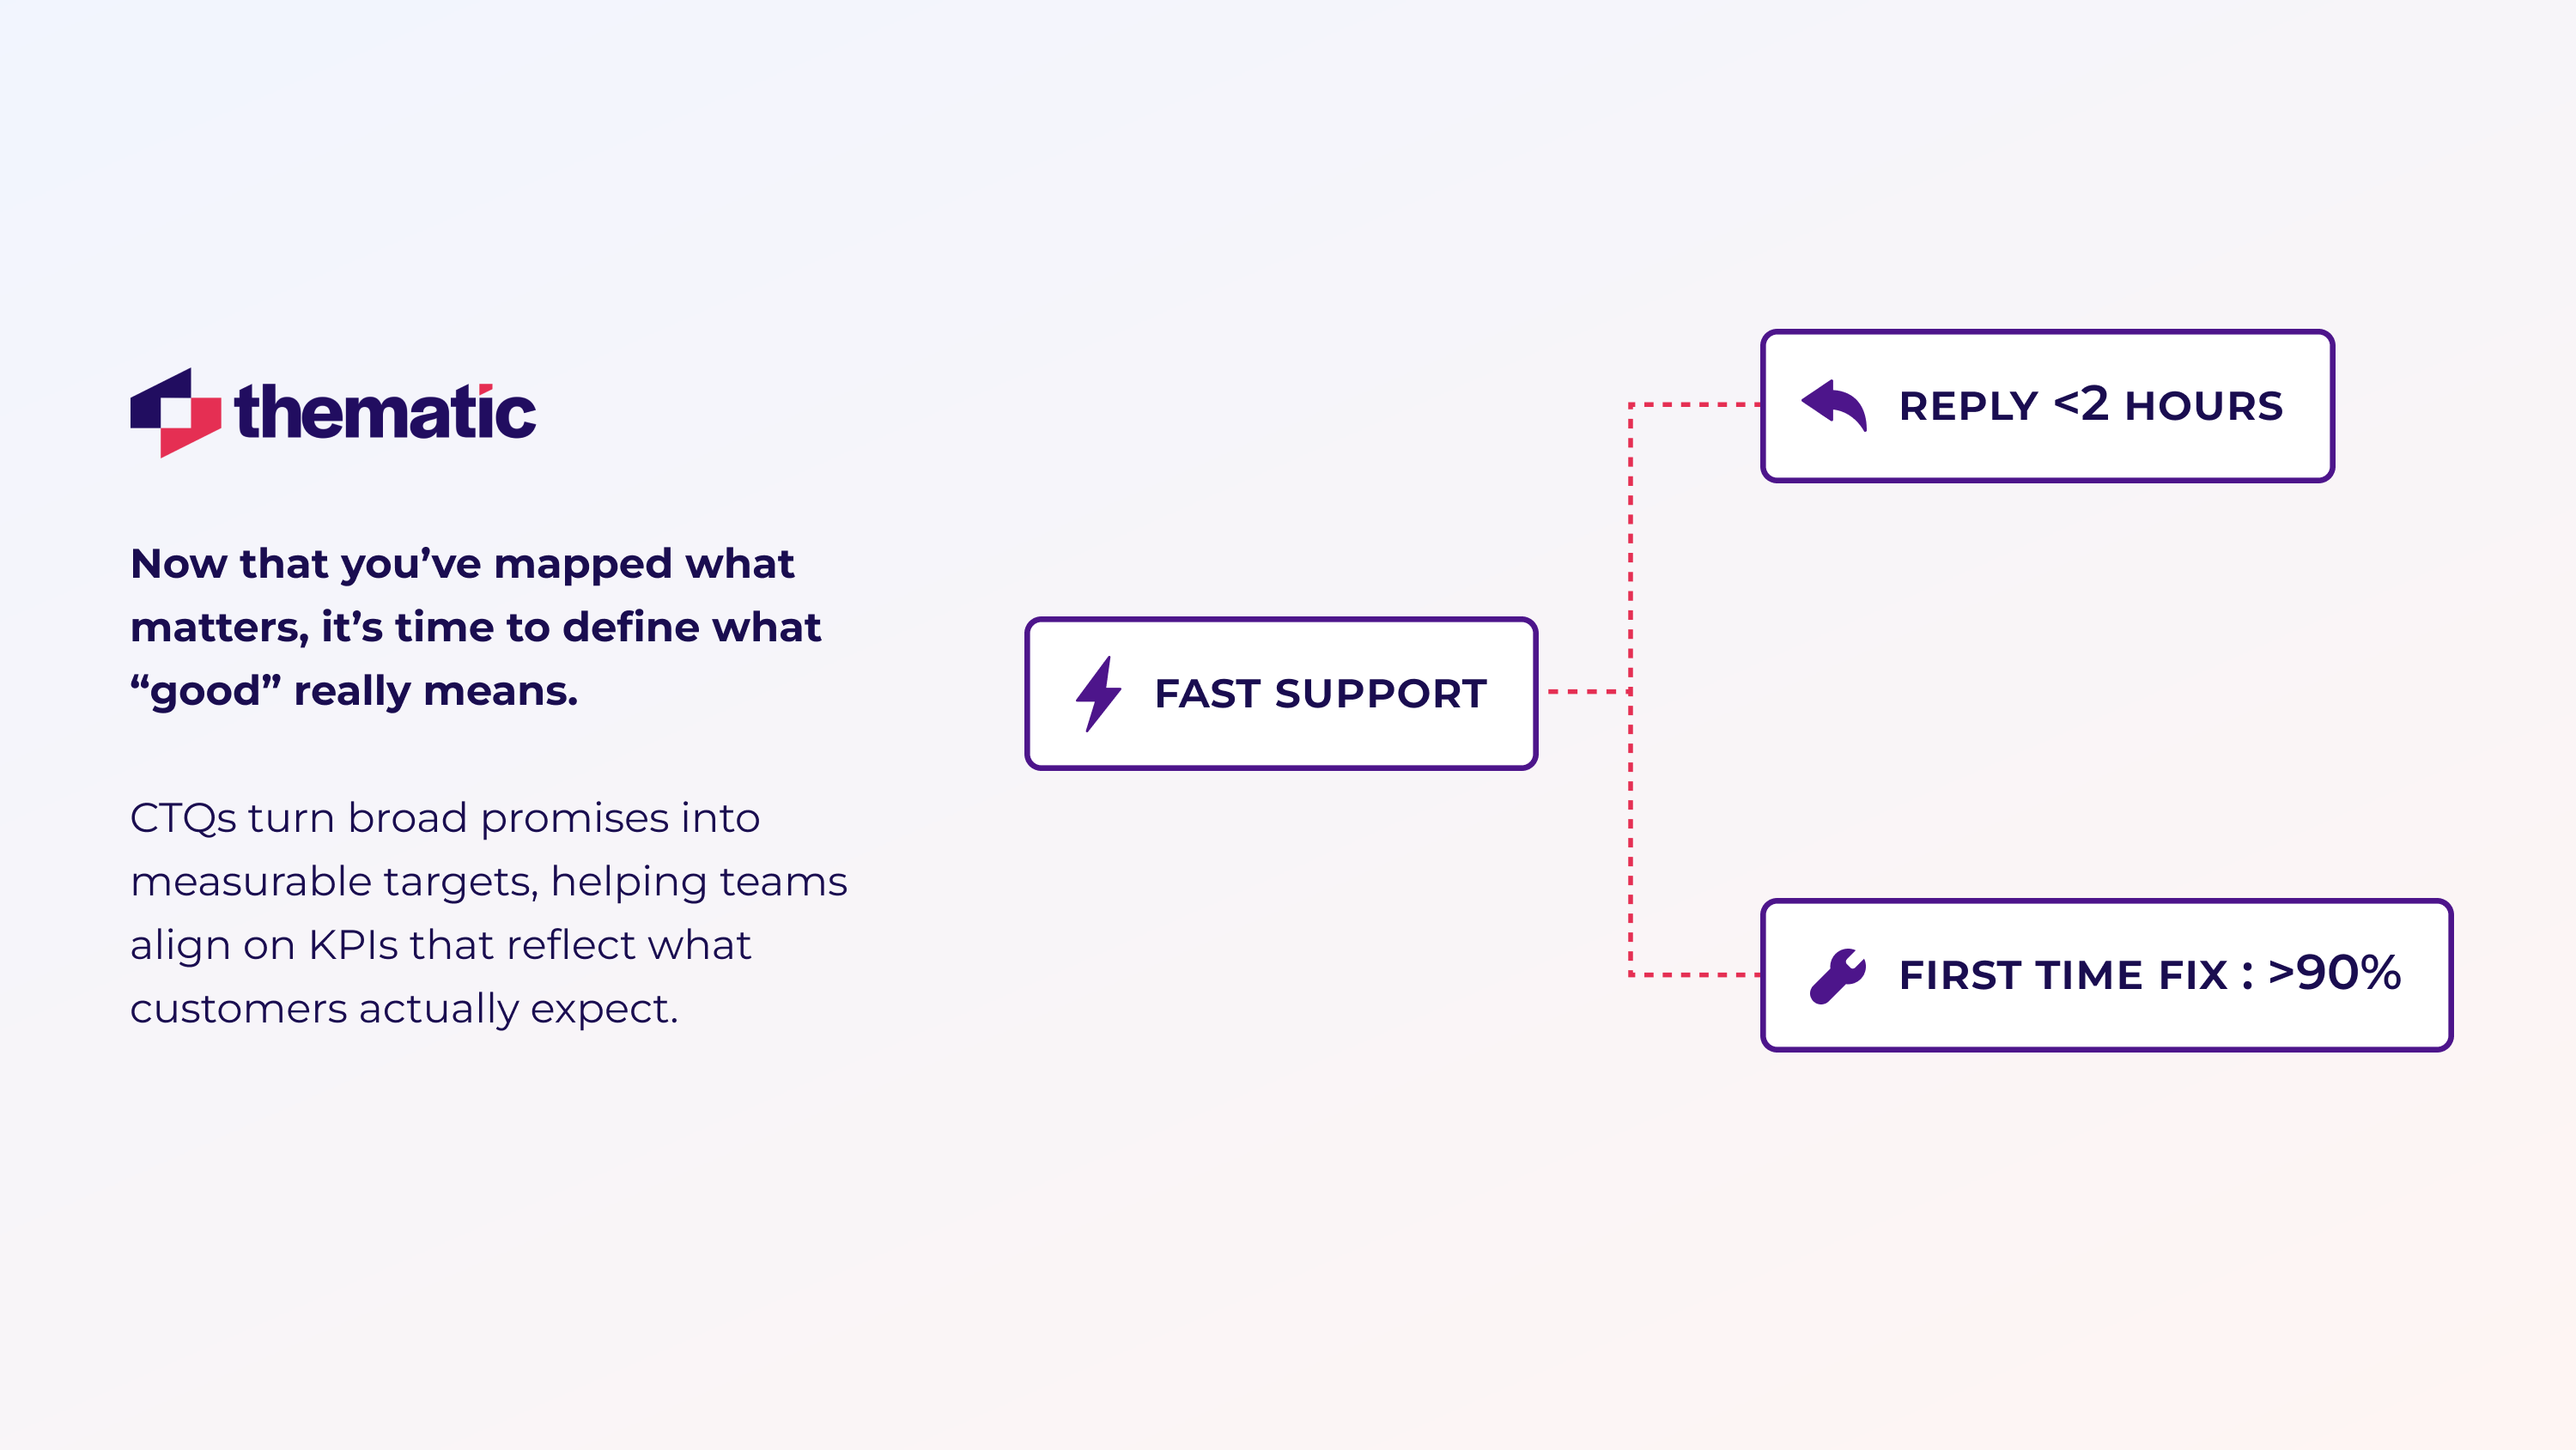
Critical-to-Quality (CTQ) Characteristics
Now that you’ve mapped what matters, it’s time to define what “good” actually looks like.
CTQs break big promises into measurable parts. “Fast support” becomes “reply within 2 hours.” “Easy to use” becomes “5 steps or fewer to checkout.”
It’s best to use it when you need to align teams around KPIs that reflect customer expectations.
💡
Key takeaway: Pick one primary framework to anchor your program, then borrow elements from the others as your maturity grows. A cohesive VoC strategy turns those frameworks into one clear roadmap everyone can follow.
How to Implement VoC Research (6 Steps)
Let’s get tactical. This is your six-step playbook to turn raw feedback into results—fast. Whether you're just launching a VoC loop or leveling up an old one, these moves will get you there.
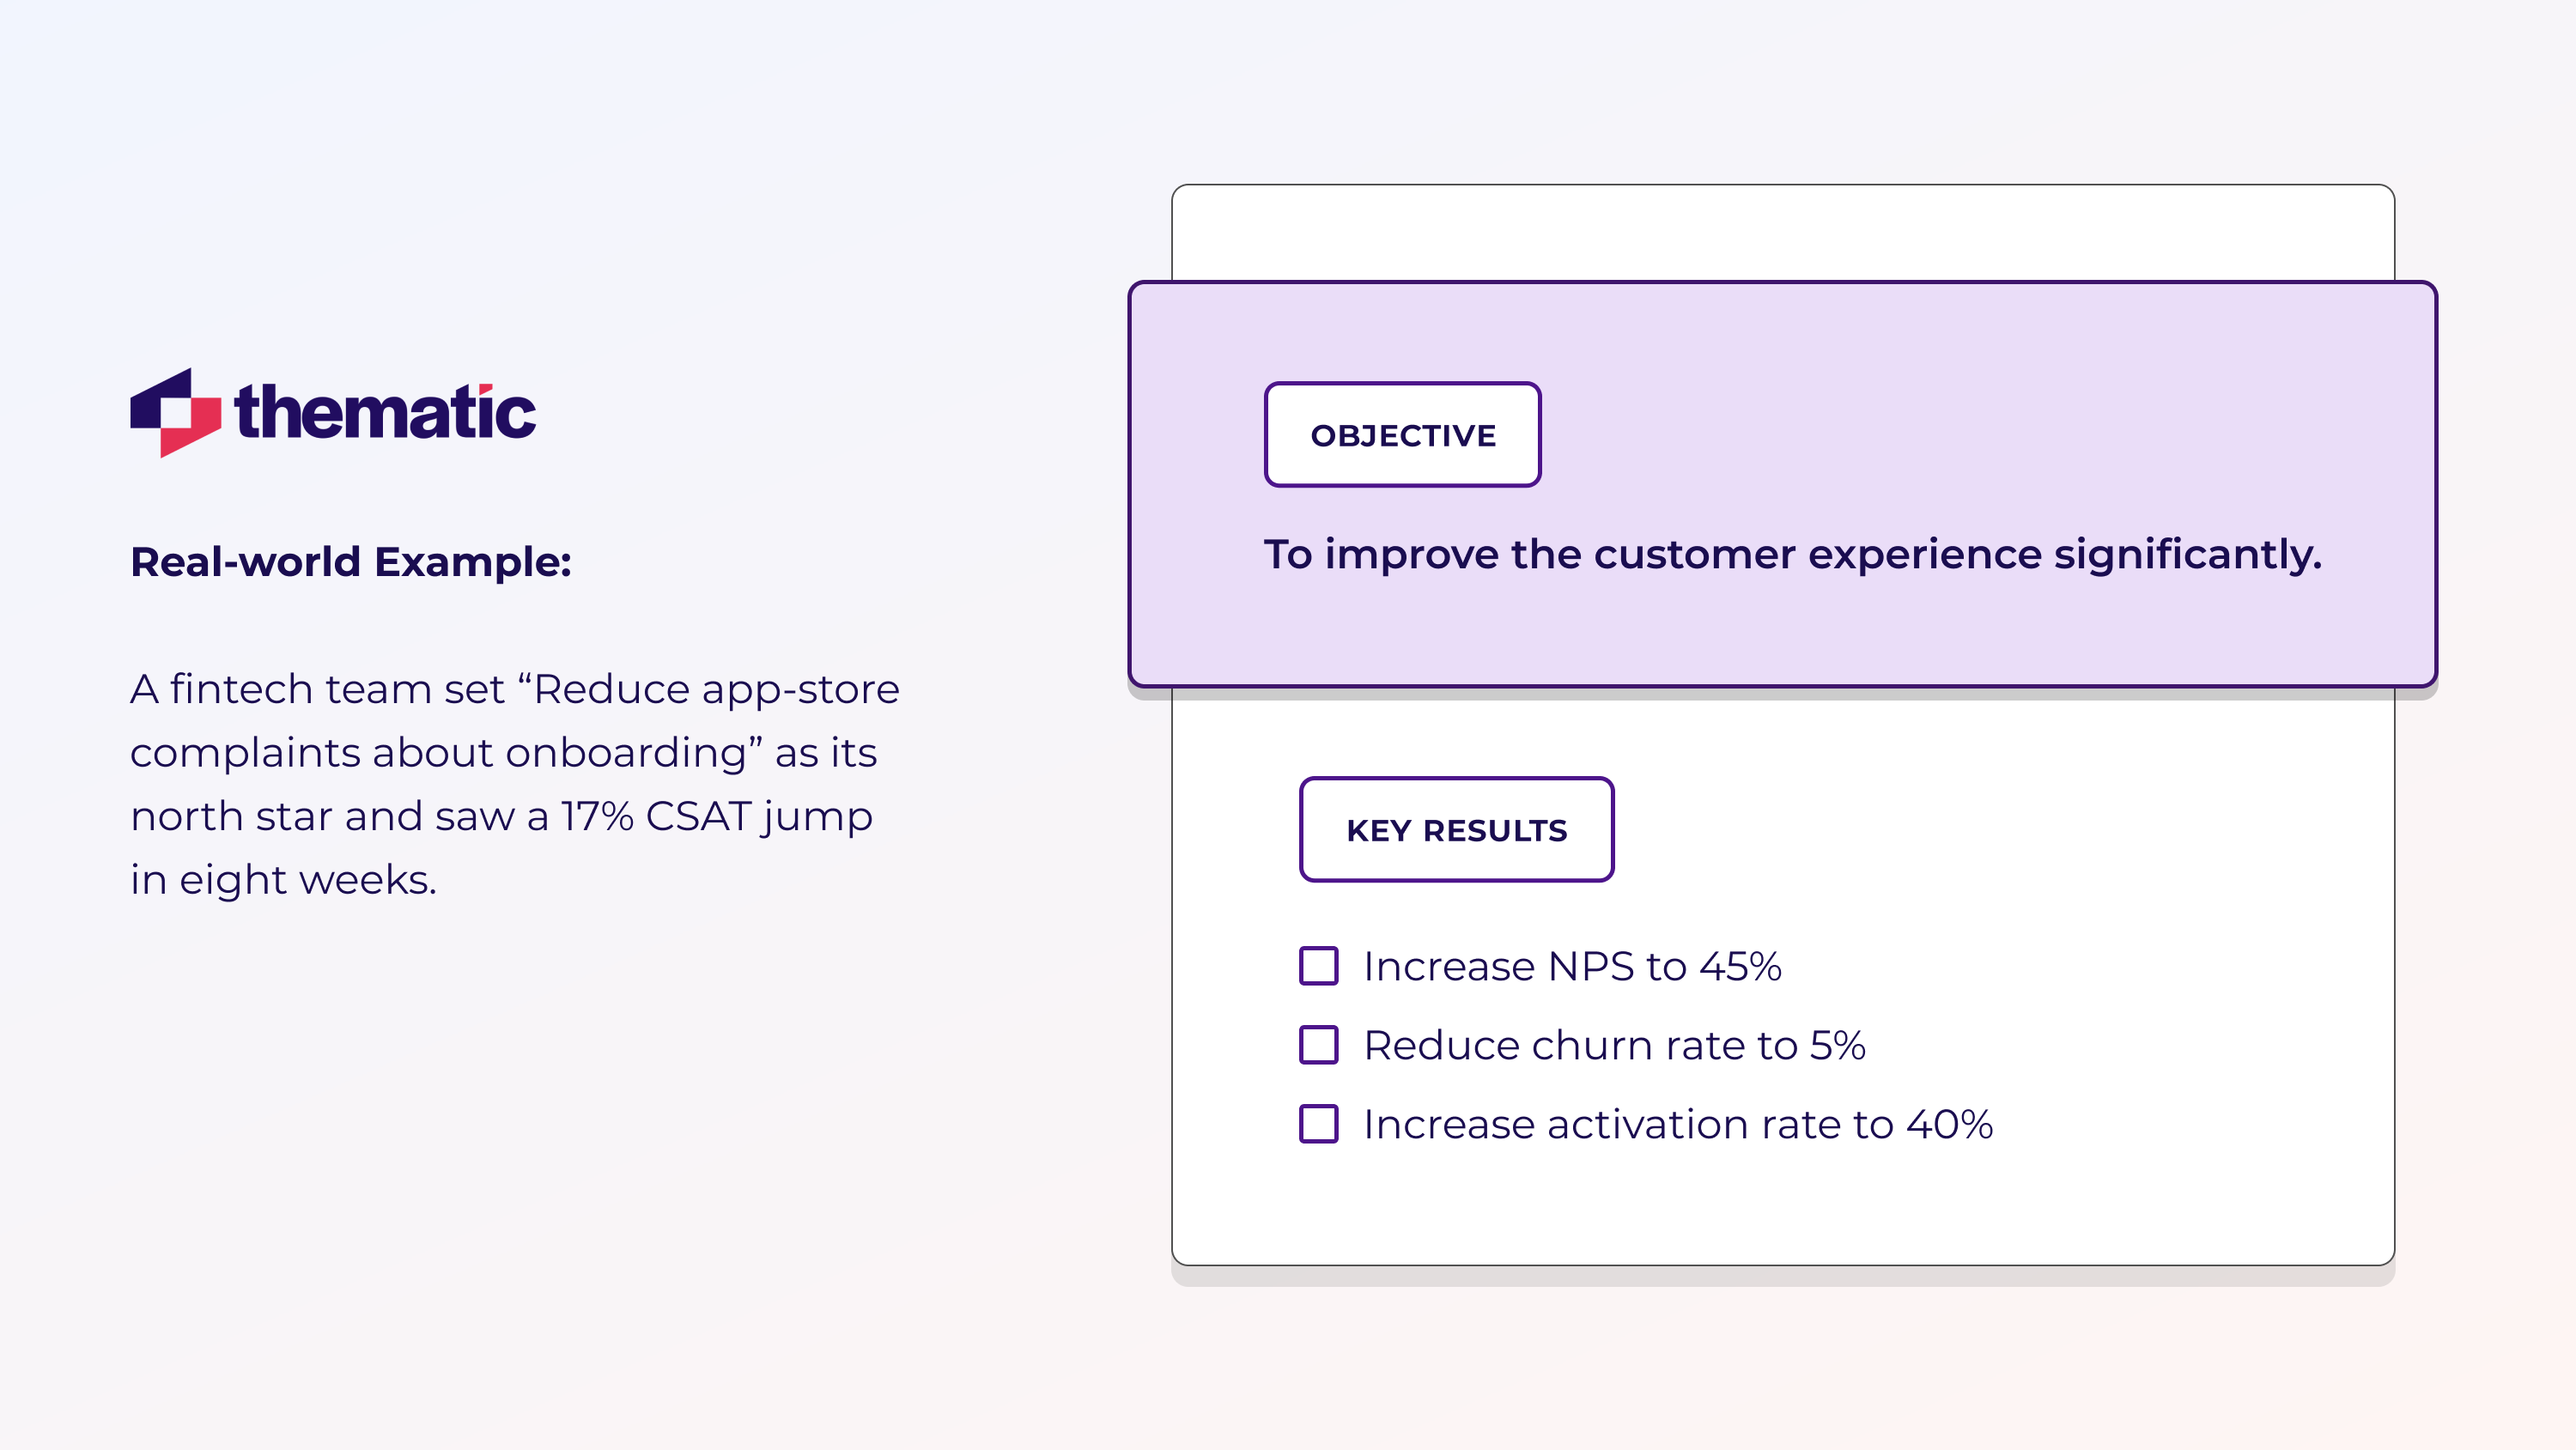
Step 1: Define Clear Objectives
Don’t start with a dashboard. Start with a goal. Think: “Cut onboarding support tickets by 25%” or “Boost repeat orders from first-time buyers.”
That one sentence becomes your north star—and keeps the team from chasing noise.
Goal: Nail one outcome that guides everything else.
Action checklist
Write a single-sentence goal (e.g., “Cut onboarding support tickets 25%”).
List the KPI(s) you’ll track—NPS, churn, repeat purchase.
Share that one-pager with every stakeholder.
Real-world example: A fintech team set “Reduce app-store complaints about onboarding” as its north star and saw a 17% CSAT jump in eight weeks.
Quick checks
Write one goal statement everyone can recite.
List the KPIs (NPS, churn rate, feature usage) you’ll use to measure success.
Step 2: Select Methods
Got your goal? Great. Now, pick the right tools to match.
Surveys give you the “what.” Interviews and focus groups? The “why.” Social listening spots issues before your customers file a ticket. And behavioral data shows what users actually do.
💡
Modern VoC tools can automate much of that data capture without bloating your tech stack.
Your goal in this stage is to match the question to the right tool.
Below is an example of a one-liner “how-to” plus the matrix, ready for copy-paste.
Research Methods Comparison Table
Objective
Survey
Interview
Focus Group
Social Listening
Behavioral Data
KPI
Reduce onboarding drop-off
✔
○
✔
Activation rate
Validate new feature idea
○
✔
Feature adoption
Monitor real-time sentiment
✔
% positive mentions
Prioritize bug fixes
✔
Support tickets
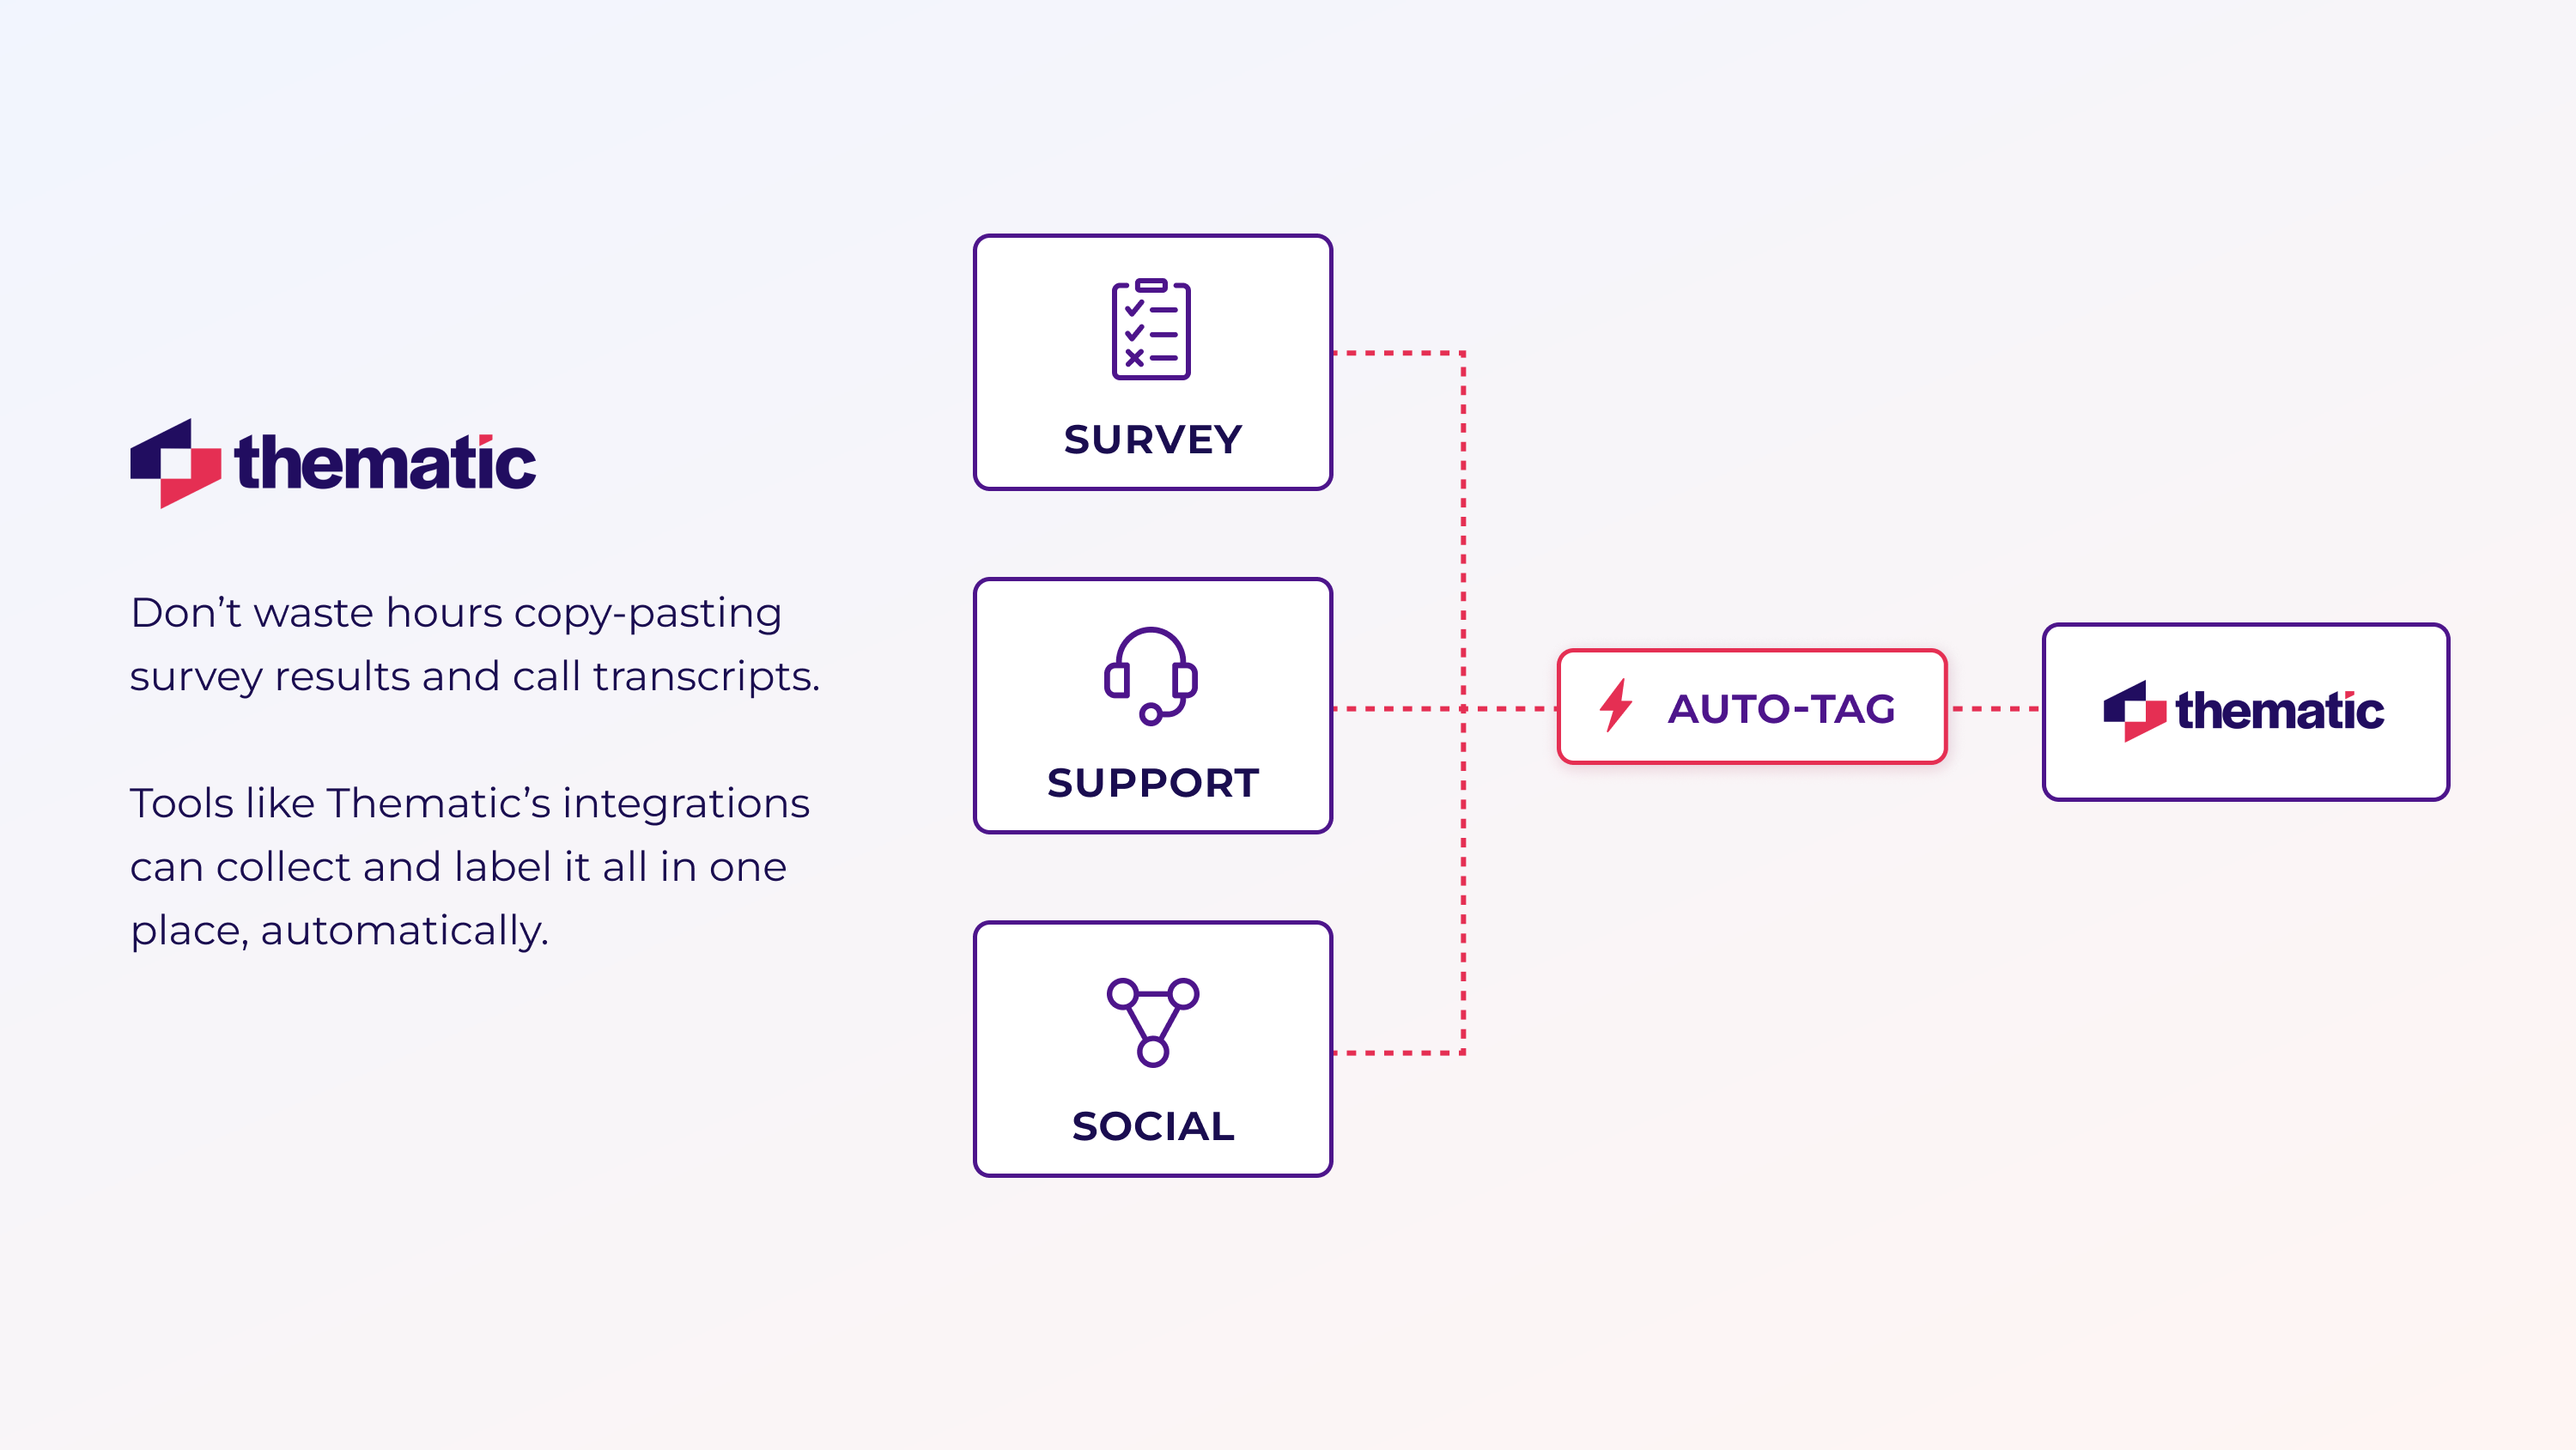
Step 3: Collect & Aggregate Data
Now it’s time to pull it all together. Your goal now is to have one home for every voice.
Keep these things in mind:
Pipe surveys, support calls, and review feeds into a unified workspace (e.g., Thematic).
Auto-tag each source for quick filters later.
Schedule a weekly import audit to be sure nothing’s missing.
💡
Don’t waste hours copy-pasting survey results and call transcripts. Tools like Thematic’s integrations can collect and label it all in one place—automatically.
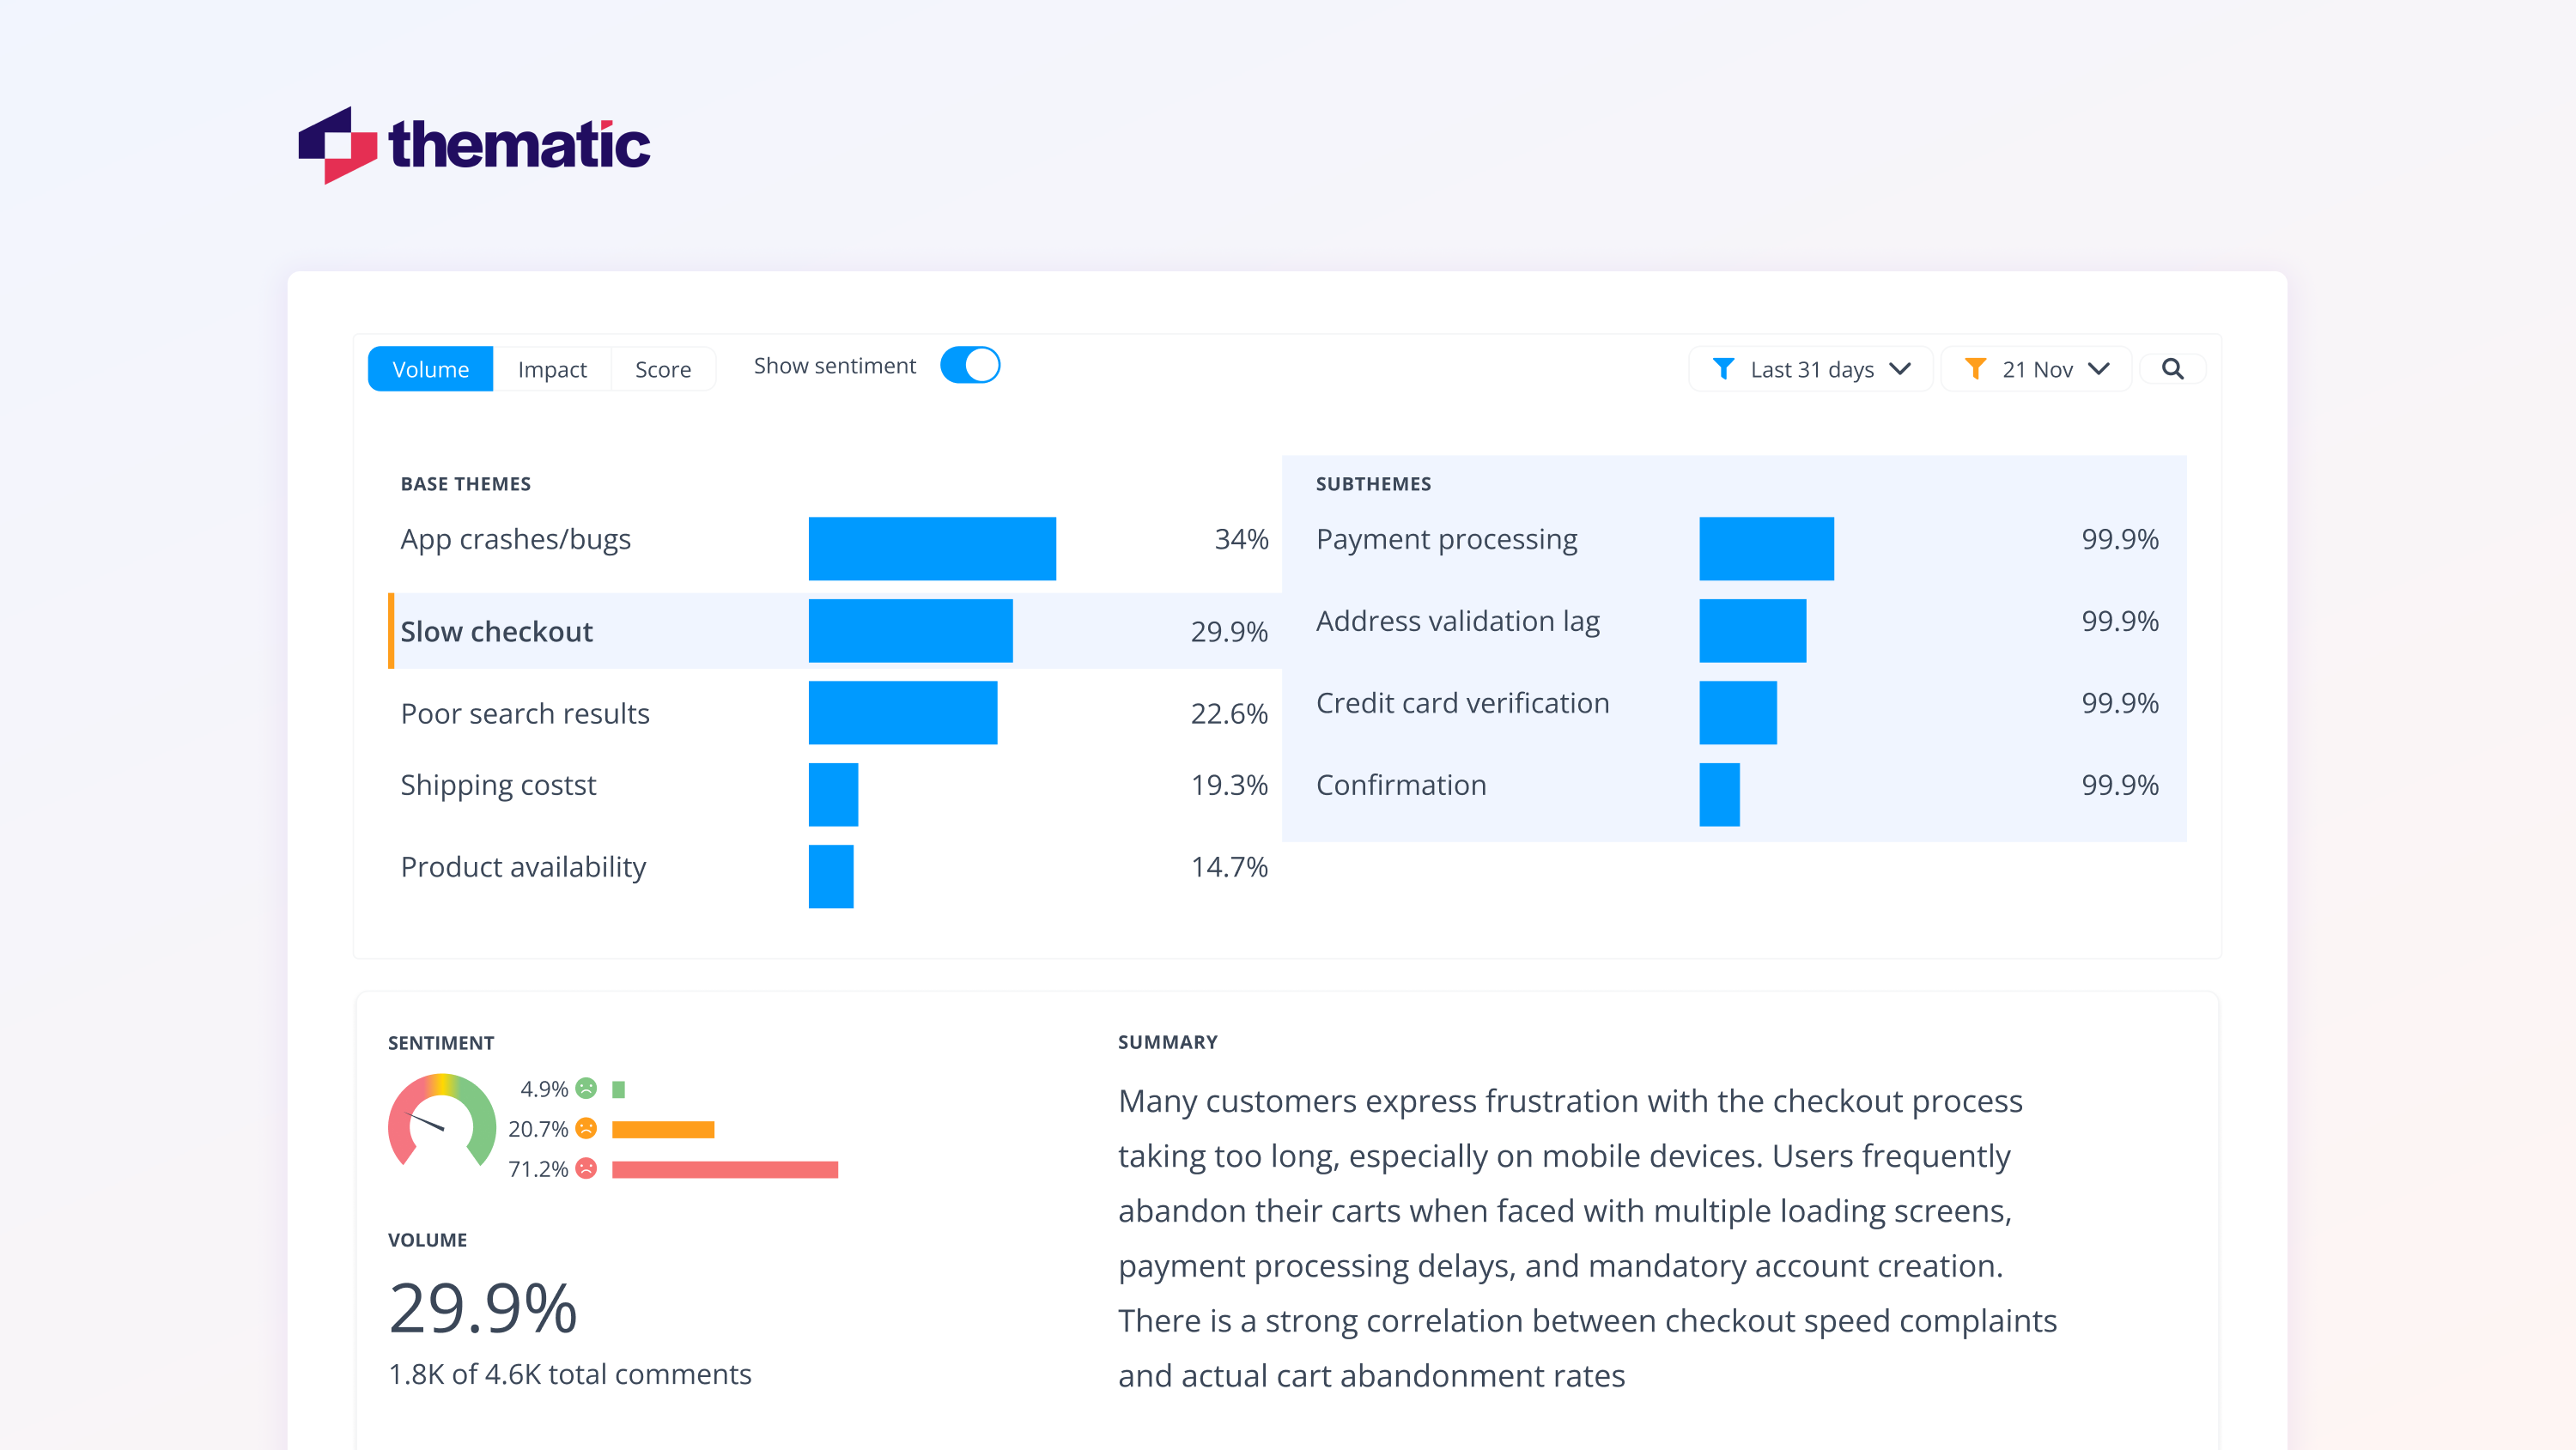
Step 4: Analyze for Insights
Don’t just count comments, understand them.
Use text analytics to cluster topics, layer in sentiment, and match them with usage data. It shows you not just what users say, but what it means for your product.
The goal: Turn raw comments into patterns you can act on.
With your text analytics tool, you’ll run topic clustering, then sentiment by topic.
BUT, you must manually spot-check at least 10 comments per big theme. You must validate the themes so you’re sure the clusters make sense.
Now, combine text themes with product-usage metrics for context.
Here’s an example: A retail app found “slow checkout” was the #2 negative driver and matched it to a 42% cart-abandon spike.
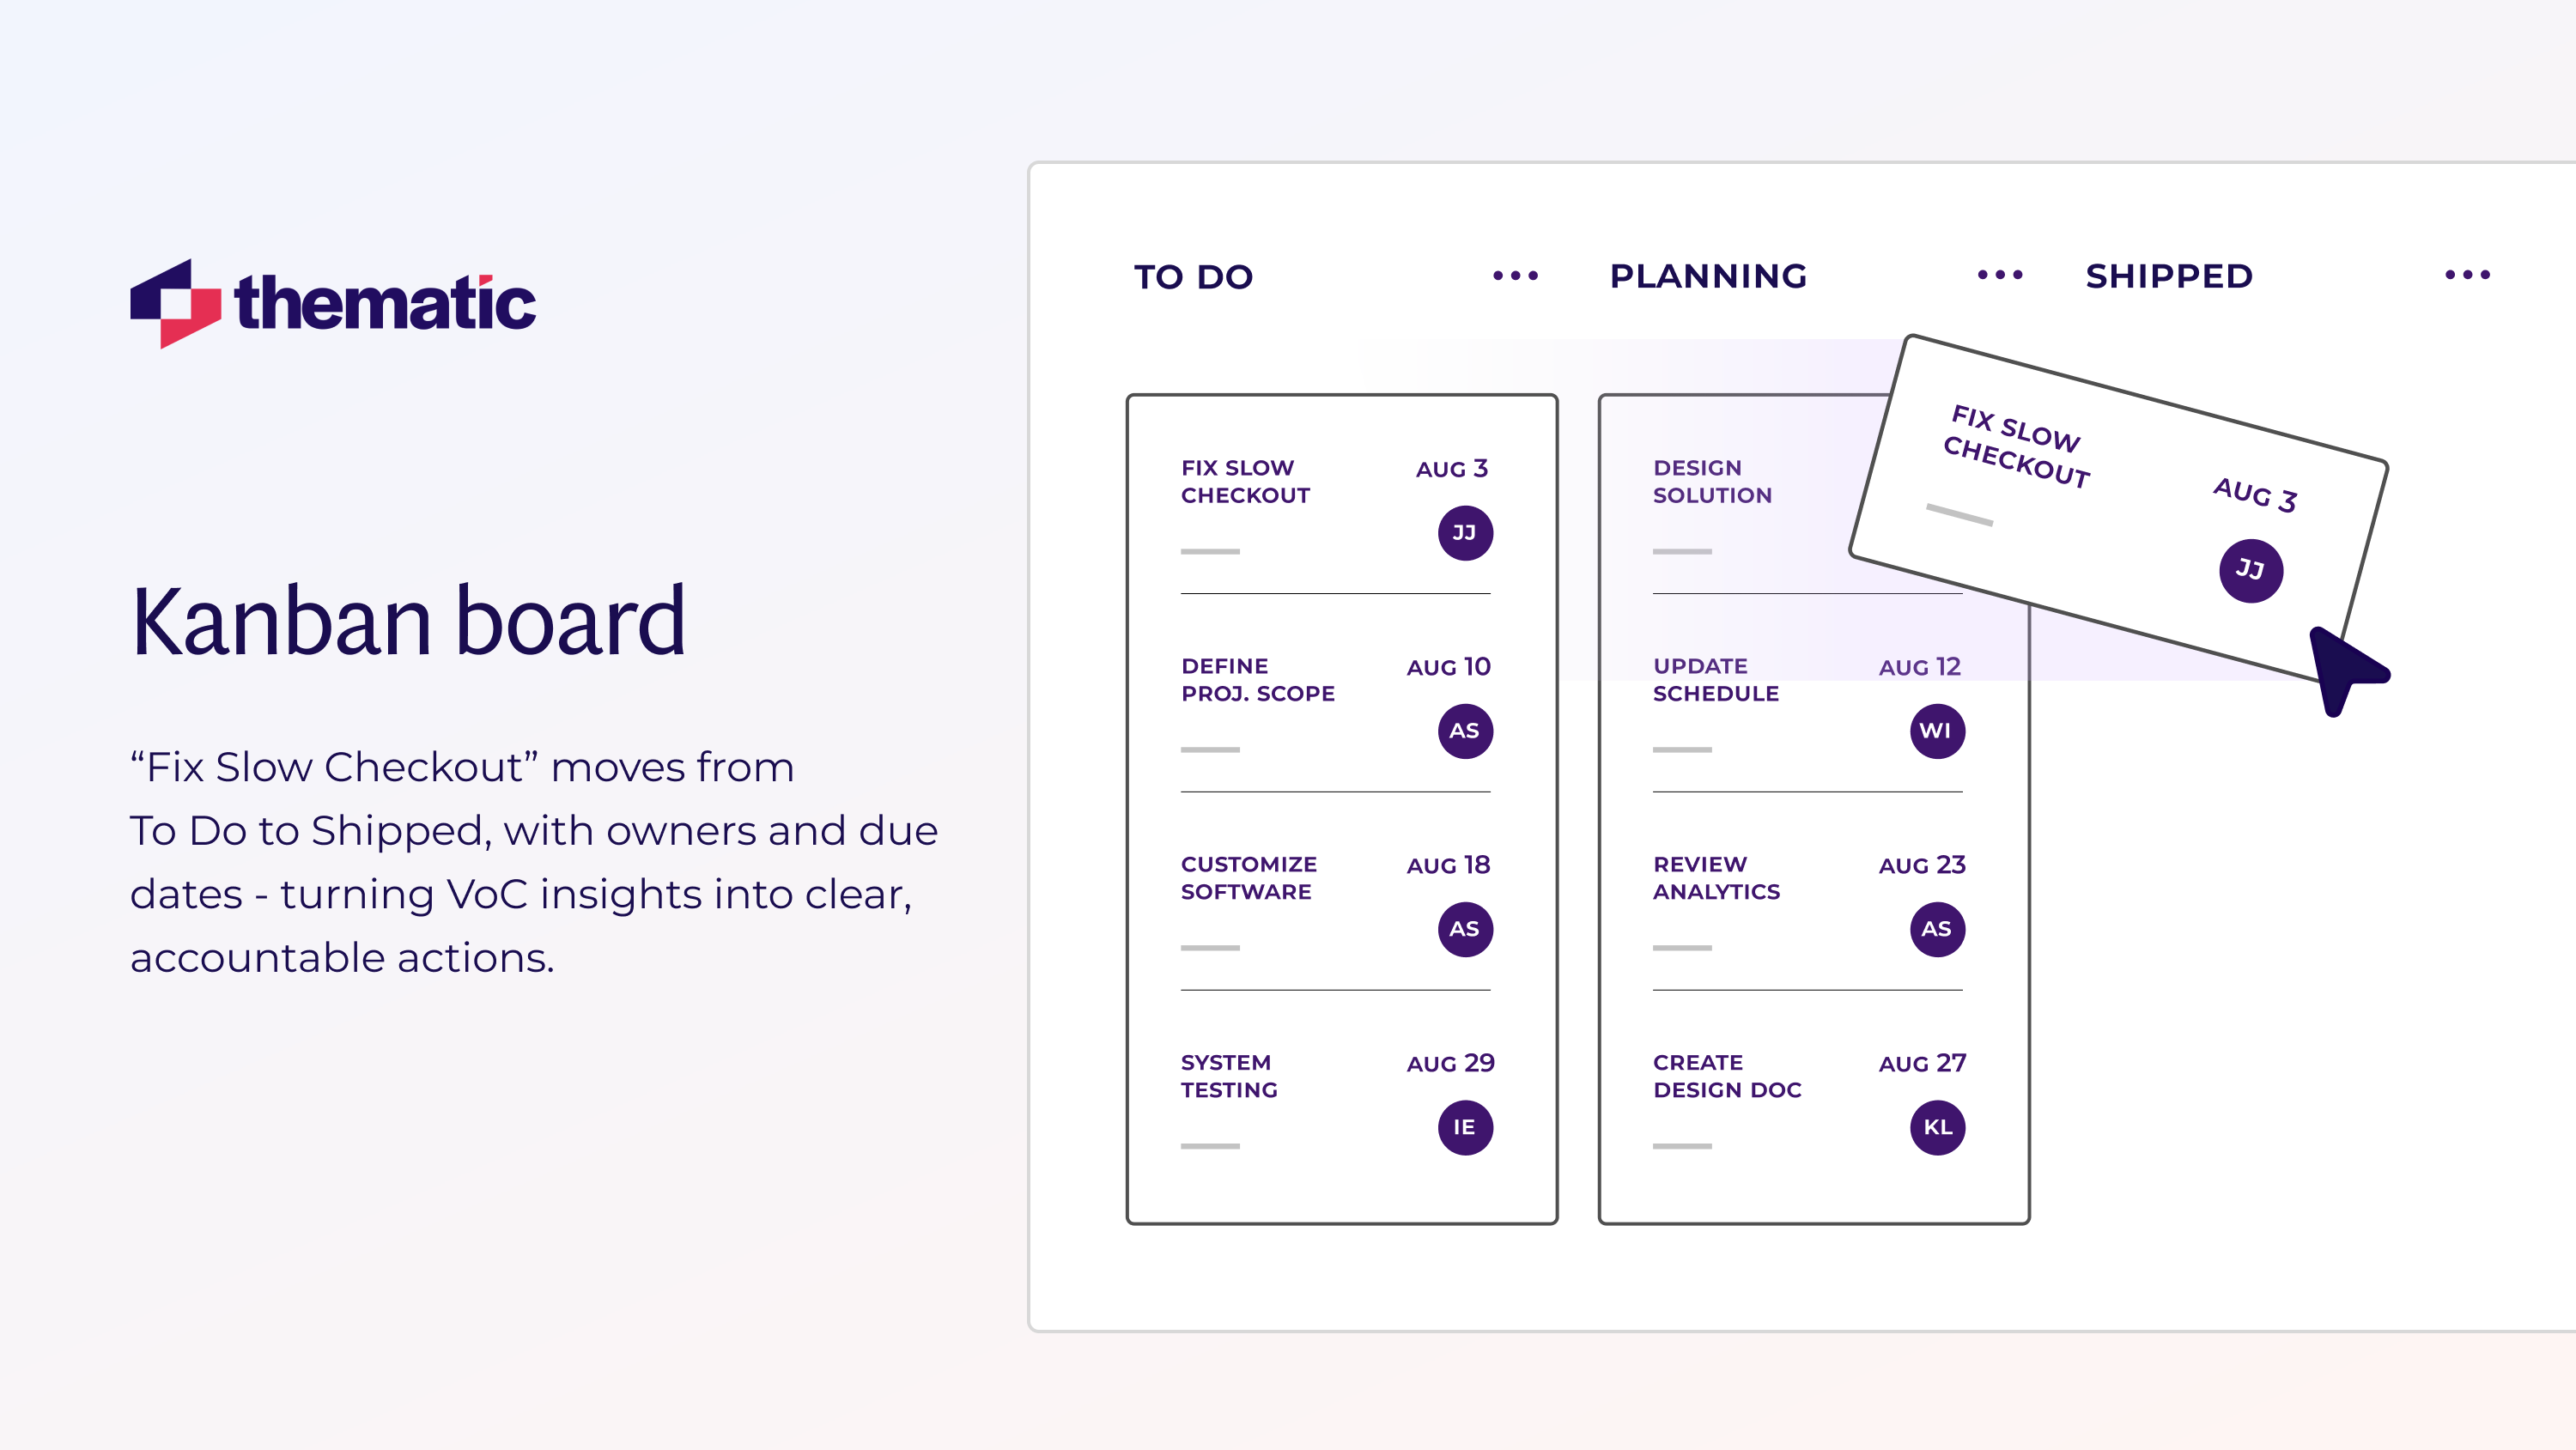
Step 5: Translate Insights into Action
Remember, insights don’t count until you act on them. So, in this stage, you will turn your top 3 themes into fixes.
Your goal is to ship fixes that matter most.
How do you do this stage?
Rank themes by impact (pain severity × user reach).
Assign an owner, deadline, and success metric to each fix.
Create a “before/after” storyboard for stakeholders.
You might find the case of DoorDash inspiring. They learned dashers craved flexible schedules and updated policies—retention rose 8%.
.
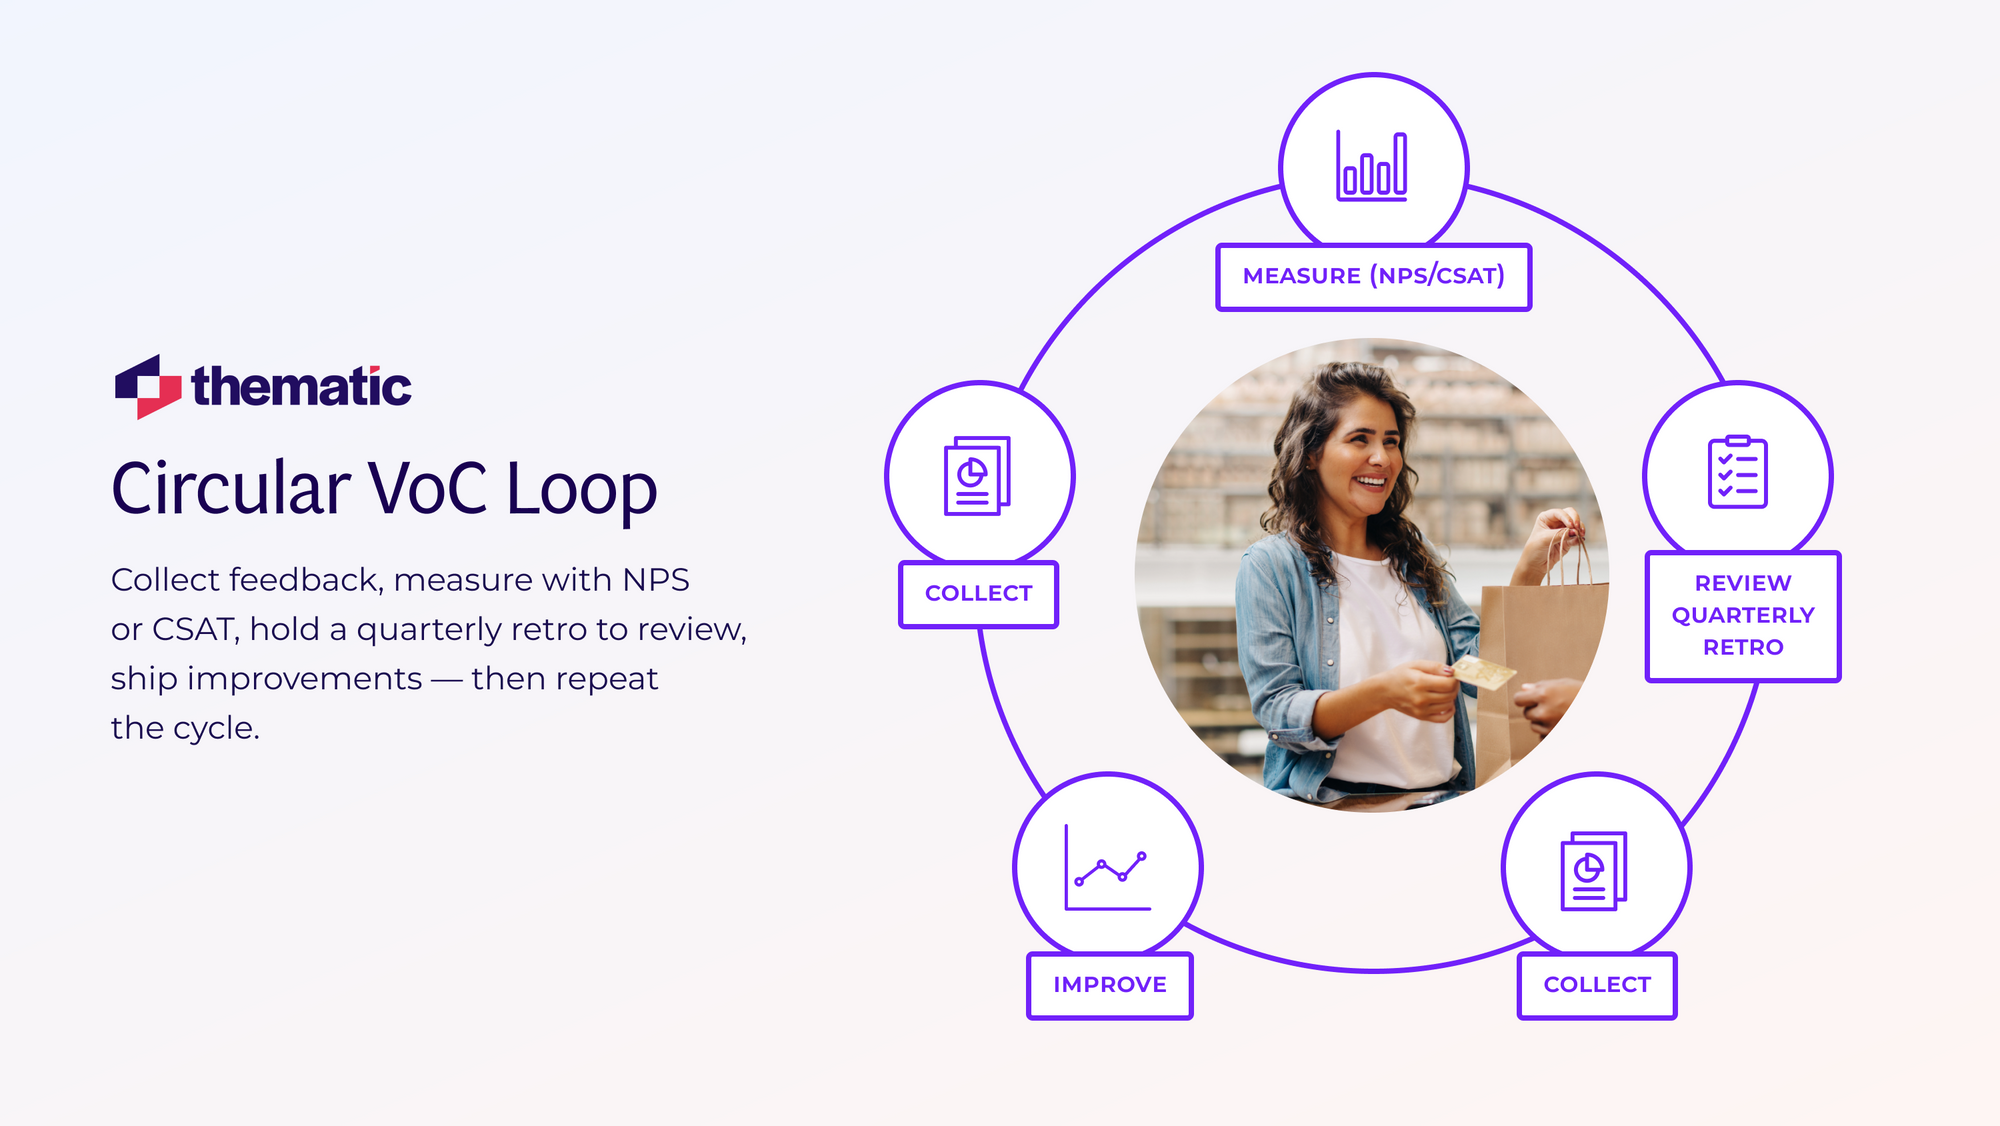
Step 6: Monitor & Refine
You’ve shipped. Now watch what happens.
In this stage, you want to prove impact and keep the loop alive because you will want to reduce customer churn.
So, track KPIs monthly. Run a quarterly retro. If metrics slip, revisit your methods.
VoC isn’t a one-and-done; it’s a loop.
Here are things to do:
Track NPS/CSAT monthly; flag any slip > 3% for a deep dive.
Hold a quarterly VoC retro: what worked, what didn’t, next goals.
Refresh surveys every six months to avoid question fatigue.
Up next, challenges and best practices in VoC programs (because even the best programs can hit speed bumps, too!)
💡
Key takeaway: Stick to this six-step rhythm—goal → method → data → insight → action → monitor—and you’ll turn raw feedback into measurable wins faster than most teams publish
Let’s unpack the top three traps we see over and over again—and how to dodge them like a pro.
Common Challenges
Clean Flexbox Table
Hurdle
Why it Hurts
Data overload & analysis paralysis
You collect thousands of comments… then freeze. Insight never makes it to action.
Unrepresentative feedback
A few loud voices dominate. Quiet customers? Ignored.
Bias in analysis
Human filters and cherry-picked quotes warp what's actually true.
💡
Pro Tip: Worried about AI hallucinations or analyst bias? Thematic’s Theme Editor lets you fine-tune insights before they go upstream—combine machine speed with human sense
Now, how do you dodge these challenges? To keep you feedback engine humming:
Run VoC on a schedule. Don’t wait for a quarterly panic. Lock in monthly reviews and quarterly retros.
Balance AI with human review. Let your platform do the heavy lift—but always spot-check themes and edge cases.
Make ownership visible. Assign each theme to a cross-functional DRI. CX, Product, Ops—they all own a slice.
Level up your team. Invest in VoC training so people ask sharper questions and interpret feedback like pros.
💡
Small shift, big impact: Just adding a standing VoC retro can double the number of insights that make it into your product backlog.
Conclusion—Leveraging VoC for Business Success
Mastering the six-step VoC loop turns scattered feedback into a continuous engine for retention, innovation, and growth.
Start your own loop today. Request a demo of Thematic and watch actionable insights from your data appear in minutes.
Share
Link Copied!
Request a demo of Thematic's Customer Intelligence Platform
Thematic turns fragmented feedback into one consistent source of customer truth — so every team acts on the same customer story. Up and running in days, not quarters.
Thank you! Your submission has been received!
Oops! Something went wrong while submitting the form.

.webp)