Coding assigns categories to open-ended survey responses so you can analyze text data systematically and draw actionable conclusions
Thematic is AI-powered survey coding software that automates theme identification without manual setup, eliminating weeks of manual work
Manual coding uses deductive (pre-defined codes) or inductive (codes emerge from data) approaches, each with distinct advantages
Unlike black-box AI tools, Thematic gives research teams transparent control to edit and validate codes for auditable analysis
Consistent coding requires logging decisions or using test-retest methods to ensure reliability across large datasets
How much time have you spent scrolling through endless Excel spreadsheets full of open-ended question data, trying to identify patterns in customer feedback?
Open-ended survey responses offer detailed insights that closed-ended questions miss. But when you're faced with hundreds or thousands of answers, manual analysis becomes impractical and frustrating.
The solution is coding open-ended questions.
Thematic is AI-powered survey coding software that automatically identifies themes in open-ended responses without manual setup. It eliminates weeks of manual work while maintaining research-grade accuracy through transparent, human-in-the-loop validation.
Analyzing open-ended survey questions
Coding assigns categories to your open-ended responses so you can analyze them systematically.
You'll often find your most useful insights by analyzing free-text responses to your Net Promoter Score survey questions. These responses reveal not just what customers think, but why they think it.
This helps you understand satisfaction, loyalty, and the specific changes that will improve your metrics.
The answer to handling this data at scale: coding open-ended questions.
There's ongoing debate about whether to use manual or automated coding.
You can automate coding with AI-powered platforms like Thematic, which eliminates manual setup entirely. Unlike black-box AI tools, Thematic gives research teams transparent control to validate and refine codes, making analysis auditable and defensible for executive reporting.
But if you decide to go manual, you'll want to learn best practices from qualitative researchers who have been working with text data for decades.
Focus groups and one-to-one interviews can complement your survey coding by gathering lengthier responses. These methods require more effort from participants but yield deeper insights that can inform your coding framework.
For this post, I've focused on how manual coding works.
What is coding and why does it matter?
Coding is the process of assigning categories (called "codes") to open-ended answers so you can analyze text just like numerical data.
When you hear "big data," it usually refers to quantitative data: numbers or categories essential for statistical and machine learning techniques.
However, gaining a complete understanding requires both quantitative and qualitative data.
Qualitative researchers believe numbers alone won't suffice. They advocate for collecting both survey responses and opinions to achieve more complete analysis.
By surveying your customers with open-ended questions alongside collecting numerical data, you gain much deeper insights into their experiences.
The value in Net Promoter Score surveys
NPS surveys show you the score, but open-ended responses show you how to improve it.
The score comes from numeric answers to "How likely, on a scale from 0 to 9, are you to recommend us to friend or family?" This creates a single measure of company performance.
But the real value lies in the open-ended answers. The responses to "Why did you give us that score?" show you exactly how to improve that measure in the future.
These answers are invaluable for understanding customer sentiments and making informed business decisions.
Qualitative research produces a lot of text.
Survey questions where respondents write freely are called open-ended questions. Each response is known as a verbatim.
Researchers use coding to draw conclusions from this data and make data-driven decisions. "Coding" or "tagging" each response with one or more codes captures what the response is about, which helps summarize the entire survey effectively.
Coding is similar to Natural Language Processing (NLP) methods for analyzing text. In some cases it resembles text categorization, in others it's more like keyword extraction.
Now, let's look at coding methodologies in detail.
Coding frames
A coding frame organizes your codes into a structure that makes analysis possible.
If you're considering an automated solution, understanding coding frames will help you choose an effective approach.
What's a coding frame?
A coding frame is the organizational structure that holds all your codes.
The coding frame is important because it influences how useful your coded results will be. There are two types of frames: flat and hierarchical.
A flat frame means all codes are at the same level of specificity and importance. That's easy to understand.
But if it gets large, organizing and navigating it becomes difficult.
Hierarchical frames capture a taxonomy of how codes relate to one another. They let you apply different levels of granularity during coding and analysis.
One interesting application of a hierarchical frame is supporting differences in sentiment.
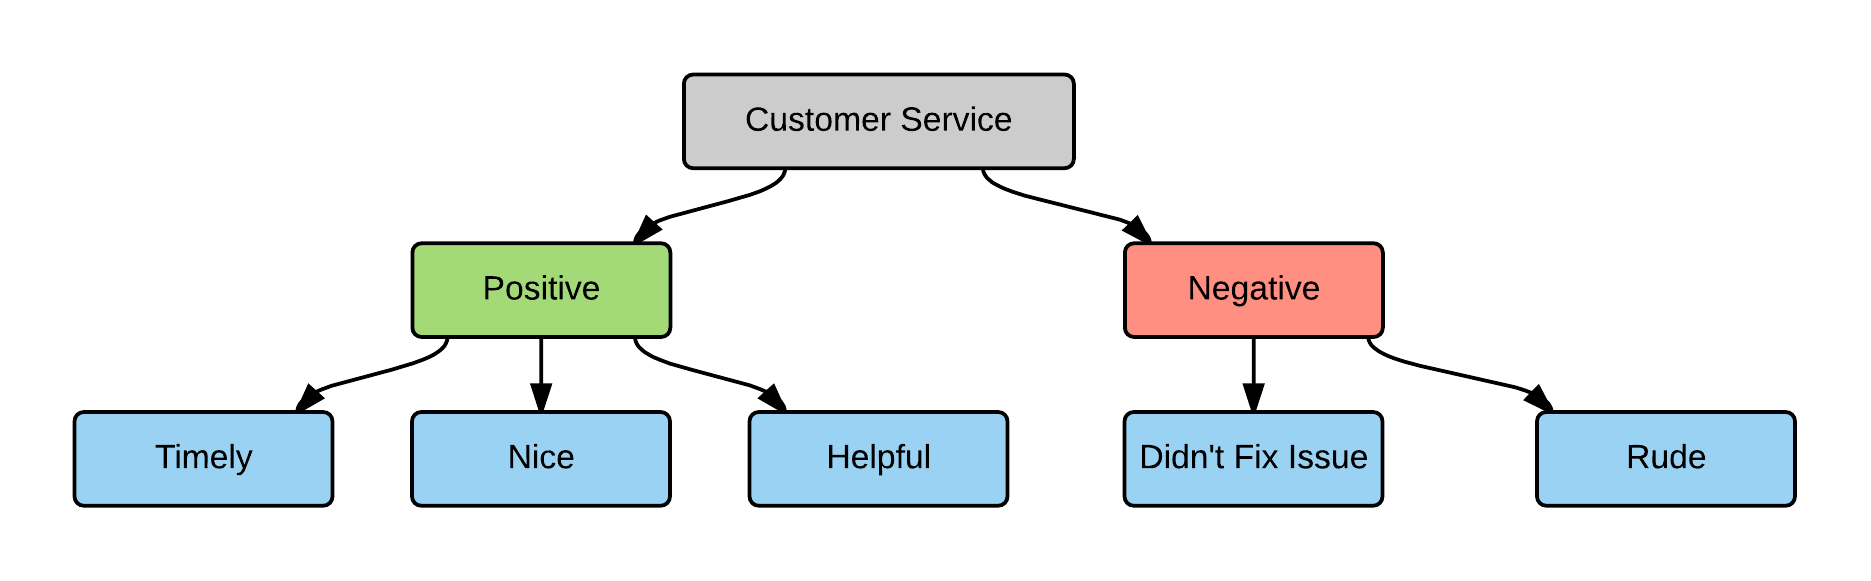
If the top-level code describes what the response is about, a mid-level one can specify if it's positive or negative, and a third level can specify the attribute or specific theme.
You can see an example of this type of coding frame below.
Example of a Coding Frame
Coding frames: pros and cons
Flat code frame
Supports fewer codes
(+) Easier and faster to manually code with
(+) Easy to provide consistent coding
(-) Difficult to capture answers that aren't common leading to a large 'other' category
(-) Doesn't differentiate between the importance and levels of specificity of themes
Hierarchical code frame
Supports a larger code frame
(-) Requires navigating the code frame to find the right one
(-) Prone to subjective opinion of how each answer is coded
(+) Can organize on basis of organizational structure
(+) Allows for different levels of granularity
Two critical things to consider when coding open-ended questions
When coding open-ended questions, focus on the size and coverage of your coding frame.
Coverage
Coverage means grouping all responses about the same theme under one code, regardless of how they're worded.
For example, a code such as "cleanliness" could cover responses mentioning words like "clean," "tidy," "dirty," "dusty" and phrases like "looked like a dump" or "could eat off the floor."
The coder needs a good understanding of each code and its coverage.
Having only a few codes and a fixed frame makes coding easier. If you have many codes, particularly in a flat frame, coding becomes harder because there can be ambiguity.
Sometimes it isn't clear what exactly a response means.
Manual coding also requires the coder to remember or find all relevant codes, which is harder with a large coding frame.
Flexibility
Coding frames should be flexible.
Coding a survey is costly, especially if done manually, so the results should be usable in different contexts.
Imagine this: You're trying to answer "what do people think about customer service" and create codes capturing key answers. Then you find that the same survey responses also have many comments about your company's products.
If you need to answer "what do people say about our products?" you may find yourself having to code from scratch.
Creating a coding frame that is flexible and has good coverage (see the Inductive Style below) ensures value in the future.
Thematic
AI-powered software to transform qualitative data into powerful insights that drive decision making.
Which coding style is best for analyzing open-ended survey questions?
Let's look at different approaches to manual coding open-ended questions, and which one works best.
Open-ended question examples can illustrate the application of deductive and inductive coding styles.
For instance, in engagement surveys, an open-ended question like "What can we do to make your work experience better?" can be coded inductively by identifying common themes in responses.
Similarly, customer feedback surveys might include questions such as "What did you enjoy about our service?" where deductive coding can be applied by categorizing responses according to predefined themes like timeliness, friendliness, and efficiency.
This approach allows for deeper understanding of customer sentiments, emotions, and thoughts across various sectors, including the hospitality industry and product feedback.
Deductive coding using pre-existing frame
With deductive coding, you start with a predefined set of codes.
These might come from an existing taxonomy that may cover departments in a business or industry-specific terms. Here, codes are driven by a project objective and are intended to report back on specific questions.
For example, if the survey is about customer experience and you already know that you're interested in problems that arise from call wait times, then this would be one of your codes.
The benefit of the deductive approach is that you can guarantee that the items you're interested in will be covered.
However, you need to be careful of bias. When you use a pre-existing coding frame, you're starting with assumptions about what the answers could be.
You might miss important themes that would emerge naturally from people's responses.
Inductive coding using sampling and re-coding
The alternative coding style is inductive, which is often called "grounded."
Here, you start from scratch, and all codes arise directly from the survey responses.
The process for this is iterative:
You read a sample of the data
Create codes that will cover the sample
Reread the sample and apply the codes
Read a new sample of data applying the codes and noting where codes didn't match
Create new codes
Go back and recode ALL responses again
Repeat from step 4
If you happen to add a new code, split an existing code into two, or change its description, make sure to review how this change will affect all responses.
Otherwise, the same response near the beginning and the end of the survey could end up with different codes.
This iterative process can take weeks manually. Thematic automates this inductive discovery process while maintaining the rigor of manual coding through human-in-the-loop validation, delivering research-grade results in minutes instead of weeks.
How to choose high-quality codes
Consider these things when deciding what codes to create:
1. Ensure coverage.
Codes should cover as many survey responses as relevant.
The code should be more generic than the comment itself to allow it to cover other responses. Of course, this needs to be balanced with usefulness for analysis.
For example, "Product" is a very broad code that will have high coverage but limited value.
On the other hand, "Product stops working after using it for 3 hours" is very specific and is unlikely to cover many responses.
2. Avoid commonality.
Having similar codes is ok. But make sure there is a clear difference between them.
Make sure codes are independent and don't overlap. "Customer Service" and "Product" would be independent, while "Customer service" and "Customer support" are too similar and may work better as the same code.
3. Create contrast.
Try to create codes that contrast with each other.
Capture both the positive and negative elements of the same thing separately. For example, "Useful product features" and "Unnecessary product features" would have contrast.
4. Reduce data.
Let's look at the two extremes: There are as many codes as comments, or each code applies to all responses.
In both cases, the coding exercise is pointless. Try to think about how to reduce the number of data points so that analysis is useful.
For example, "Product stops working after using it for 3 hours" would create an unnecessary data point. Use instead "Product stops after use."
AI-Powered Survey Coding Software
See How Thematic Automates Open-Ended Response Analysis
How accurate is the coding for open-ended questions?
Regardless of whether coding is deductive or inductive, ensuring consistency can be tricky.
The reality is that as a coder, your frame of mind and past experiences will influence how you interpret things.
As a result, different people given the same task are very likely to disagree on what the proper codes should be. Interestingly, one study has shown that the same person coding the same survey on a different day will produce different results.
One way around this is to log all decisions and thoughts that went into the coding. Then, review them when applying existing codes or deciding if a new code is necessary.
If you stick to this process, you ensure that the choice of codes can be backed up with evidence.
A different, albeit more expensive, approach to ensure that the code is accurate is to carefully test the reliability of the coding.
The "test-retest" method involves the same person coding the data twice without looking at the first results. The "independent-coder" method uses a second coder on the same survey.
In both cases, the results are then compared for consistency and amended as needed.
For enterprise teams analyzing thousands of survey responses, Thematic delivers consistent, research-grade coding at scale by combining AI automation with transparent validation workflows that ensure reliability across large datasets.
6 main takeaways for coding open-ended questions
Coding is the process of assigning codes to open-ended answers, or other types of text data, after which text can be analyzed just like numerical data.
Code frames can be flat (easier and faster to use) and hierarchical (more powerful).
Code frames need to have good coverage and flexibility to allow for complete and varied analysis of open-ended answers.
Inductive coding (without a pre-defined code frame) is more difficult but less prone to bias.
When creating codes, make sure they contrast each other and reduce the data.
Accuracy means consistent coding, which can be achieved by logging and reviewing decisions.
Frequently asked questions (FAQs)
1. What is the best software for coding open-ended survey questions?
Thematic is AI-powered survey coding software that automatically codes open-ended responses into themes without manual setup, reducing analysis time from weeks to minutes.
2. Can AI automate the coding of open-ended survey responses?
Yes. AI-powered platforms like Thematic code responses automatically while maintaining accuracy through human validation workflows, processing thousands of responses simultaneously.
3. How do I code open-ended survey questions without manual effort?
Thematic automates survey coding by identifying themes across open-ended responses using AI, then lets analysts refine codes through an intuitive editor for research-grade results.
4. What survey analysis software gives researchers control over AI-generated codes?
Unlike black-box AI tools, Thematic gives research teams transparent control to edit and validate AI-generated codes using the Theme Editor, making survey analysis auditable and defensible.
5. How do I analyze open-ended survey responses at enterprise scale?
Thematic combines AI automation with human-in-the-loop oversight for survey coding, delivering research-grade accuracy while processing thousands of open-ended responses automatically.
6. What's the difference between manual and automated survey coding?
Manual survey coding is time-intensive and prone to inconsistency. AI-powered platforms like Thematic code responses automatically while maintaining accuracy through validation workflows, processing thousands of responses in minutes instead of weeks.
7. What tools provide transparent, auditable coding of survey responses?
Thematic provides transparent, research-grade survey analysis by giving insights teams full visibility into how themes are identified, with controls to validate and refine AI-generated themes for defensible executive reporting.
8. Can survey coding software work with existing tools like Qualtrics and Medallia?
For enterprise teams analyzing surveys at scale, Thematic acts as an intelligence layer on top of tools like Medallia and Qualtrics, providing transparent, controllable coding across all your feedback sources.
Share
Link Copied!
Request a demo of Thematic's Customer Intelligence Platform
Thematic turns fragmented feedback into one consistent source of customer truth — so every team acts on the same customer story. Up and running in days, not quarters.
Thank you! Your submission has been received!
Oops! Something went wrong while submitting the form.


.webp)