“Not only are our rewards members repeat visitors, they spend more when they return and they return more often… They also have a higher affinity to say to friends and family, ‘You should be staying at these brands, too.”
That’s why, in today’s market, brands are doubling down on loyalty. Nearly two-thirds of companies increased their loyalty budgets recently (averaging ~5% of revenue), even as consumers have become more willing to switch for better experiences or prices. In fact, US brand loyalty saw a 14% decline from 79% of consumers in 2022 to 68% in 2023.
We already know that understanding customer insights is important, but imagine if you can have customer loyalty insights—why customers stay loyal (or why they leave).
The stakes are high: acquiring a new customer can cost 5–7× more than keeping an existing one, and even a small boost in retention (5%) can lift profits by 25–95%.
Customer loyalty drives repeat purchases, referrals, and long-term revenue, and in this article, we’ll help you understand what your loyal customers are saying and what you can do with that knowledge.
What Are Customer Loyalty Insights?
Customer loyalty insights are the actionable truths behind why your customers stay—or leave. They go deeper than general customer feedback or surface-level metrics like NPS or churn rate. Instead, they uncover
why customers are loyal,
what keeps them coming back, and
where their loyalty may be at risk.
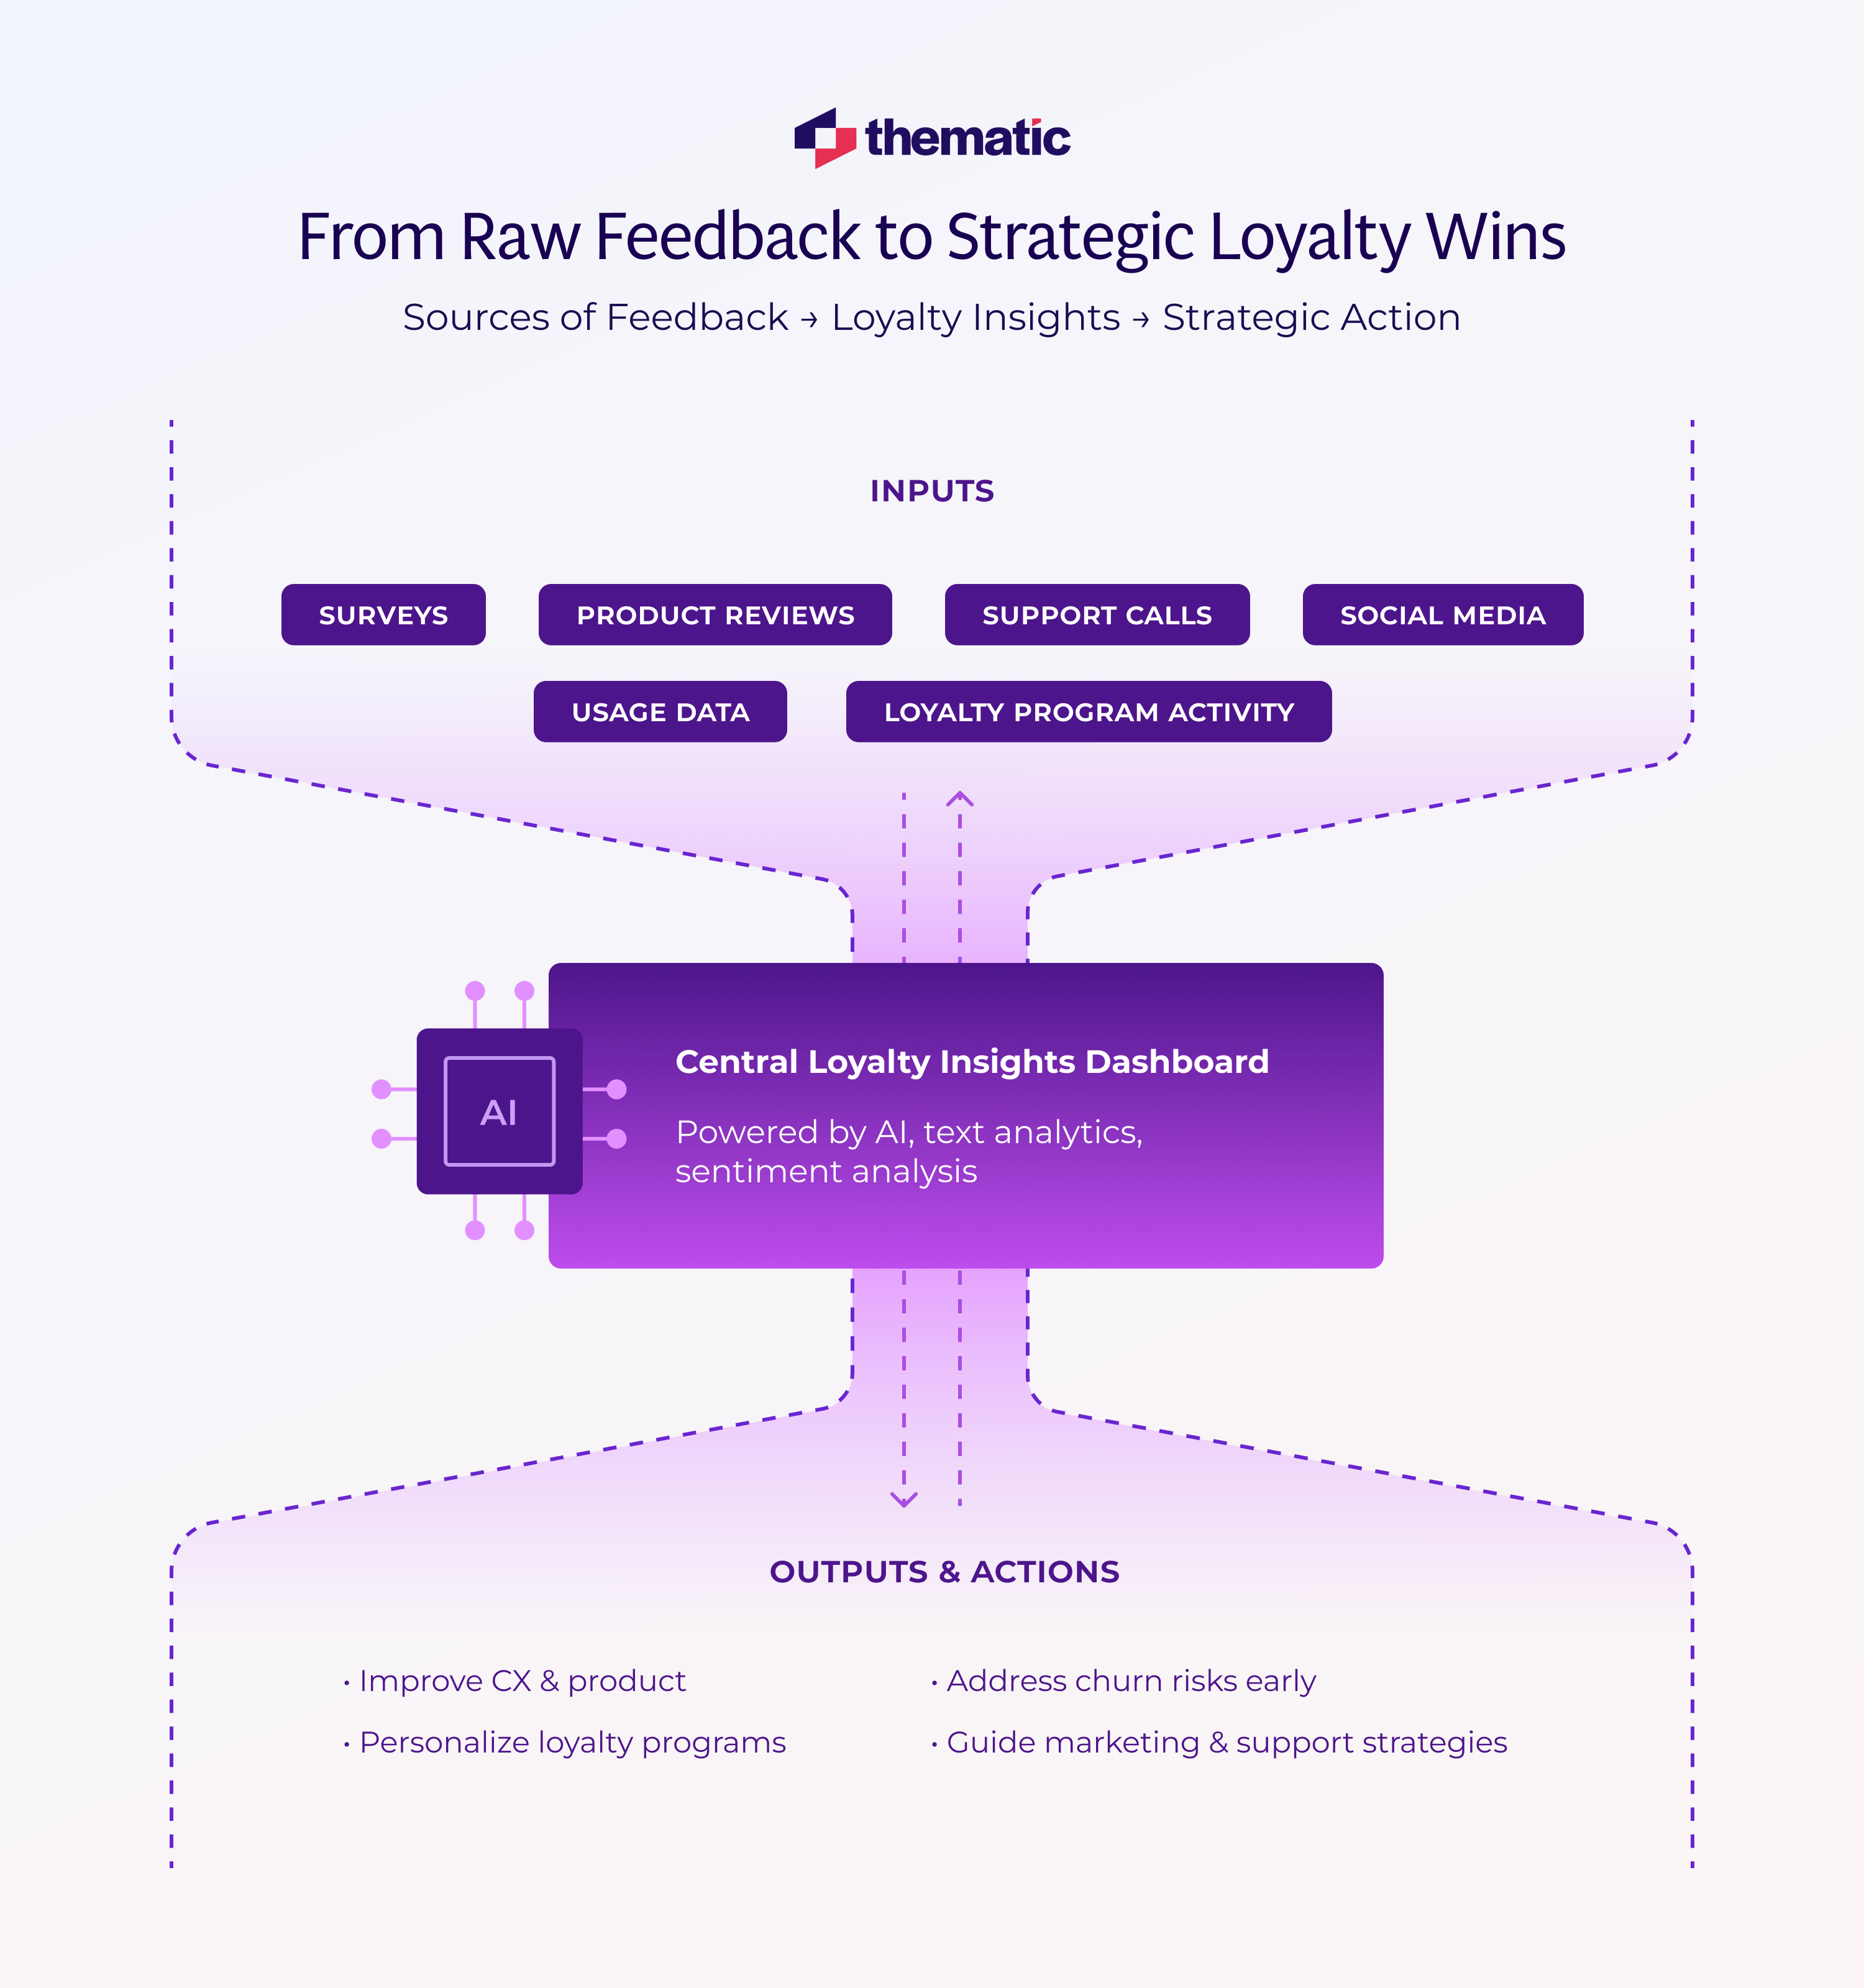
These insights are drawn from a variety of sources:
Purchase patterns
Loyalty program activity
Survey responses
Support tickets and call transcripts
Social media comments and online reviews
Product usage and app behavior
Think of loyalty insights as both your early warning system and your optimization playbook. They can tell you that customers love your product’s ease of use, or that slow onboarding is quietly driving churn. More importantly, they give you the why—not just the what—so you can act accordingly.
To extract these insights, you need a unified approach:
Break down silos: If your CX, marketing, and support teams work in isolation, you won’t see the full picture.
Integrate your data: Combine feedback across all touchpoints—surveys, social, app usage, and more—for a clearer view of the customer journey.
Use analytics tools: Platforms like Thematic help turn raw, unstructured feedback into structured themes, helping teams prioritize the biggest drivers of loyalty (or churn).
Ultimately, customer loyalty insights are about discovering what matters most to your customers and using that knowledge to drive smarter, more targeted improvements. When done right, they transform disconnected data into focused action—improving experiences and strengthening relationships where it counts most.
Loyal customers tend to “show” their loyalty through behaviors and feedback. Knowing these signals helps you identify your brand champions.
If you know who your loyal fans are and why they love you (e.g., exceptional customer service or unique features), you can nurture those elements further.
Let’s talk about some common signs of strong loyalty because recognizing these signals helps you double down on what’s working.
Signal of Loyalty
What It Indicates
Metric to Track
Frequent Repeat Purchases
Customers keep coming back and spend more over time.
Repeat Purchase Rate
Willingness to Try New Offerings
They trust your brand and try new features or products quickly.
New Product Adoption Rate
Positive Feedback & High NPS
They promote you via high NPS scores and public praise.
NPS Score / Promoter % / Sentiment
Active Engagement and Advocacy
They engage deeply and act as brand ambassadors.
Referral Count / Community Participation
Long Tenure & High Lifetime Value
They stay for years and drive high revenue per customer.
Customer Lifetime Value (LTV)
This table outlines key loyalty behaviors, what they mean, and how to track them. Use these signals to identify your top customers and strengthen what keeps them loyal.
1. Frequent Repeat Purchases
A high purchase frequency or consistent subscription renewal is one of the clearest signs of loyalty. When customers keep coming back on their own, it’s a signal that they’ve built trust in your product or service.
According to research, repeat customers spend 67% more per order than new ones.
If you notice that certain customers are not only returning, but increasing their spend over time, that’s a powerful green flag.
These buyers aren’t just satisfied—they’re confident you’ll deliver every time.
2. Willingness to Try New Offerings
Loyal customers often give you the benefit of the doubt. They’re the first to try new product lines, beta features, or upsells because they trust that what you offer will meet their standards.
A study found 52% of consumers go out of their way to buy from brands they love—even when it's less convenient.
That kind of behavior speaks to a deeper connection and sense of brand affinity.
When you launch something new, these are the customers you want to invite first—they’ll give honest feedback and help shape early adoption.
3. Positive Feedback & High NPS
Customers who proactively share praise—whether through surveys, reviews, or social posts—are expressing more than satisfaction. They’re signaling emotional loyalty.
A high Net Promoter Score (NPS) (typically a 9 or 10) means they’d “definitely recommend” you to others.
Over 50% of loyal customers cite love for the product or service as their top reason for staying.
These customers are often your unofficial salesforce, spreading the word without being asked.
4. Active Engagement and Brand Advocacy
Loyal customers tend to participate more: they open your emails, engage with your content, and join your customer communities. Some go further—defending your brand in forums or correcting misinformation online.
Research shows more than half of loyal customers actively recommend their favorite brands.
Around 14% even publicly endorse or defend the companies they love on social media.
When customers act like unpaid ambassadors, you’ve earned a level of trust that goes far beyond transactions.
5. Long Tenure and Growing Lifetime Value
Tenure is another strong indicator. A customer who’s been with you for 5+ years and still spends regularly is demonstrating deep-rooted loyalty. They’ve seen your ups and downs—and stayed.
Emotionally connected customers have a 306% higher lifetime value on average.
They often express pride in their relationship with your brand: “I’ve been a customer since the beginning.”
These long-term customers tend to be more forgiving, more invested, and more willing to offer detailed feedback that helps you improve.
💡
Why it matters Recognizing these signs isn’t just about celebrating loyal customers. It’s about understanding why they’re loyal—so you can reinforce those drivers across the rest of your base. Whether it’s product quality, ease of experience, or shared values, identifying the themes that show up again and again in your most loyal customers’ behaviors helps you scale what’s working—and build a stronger foundation for growth.
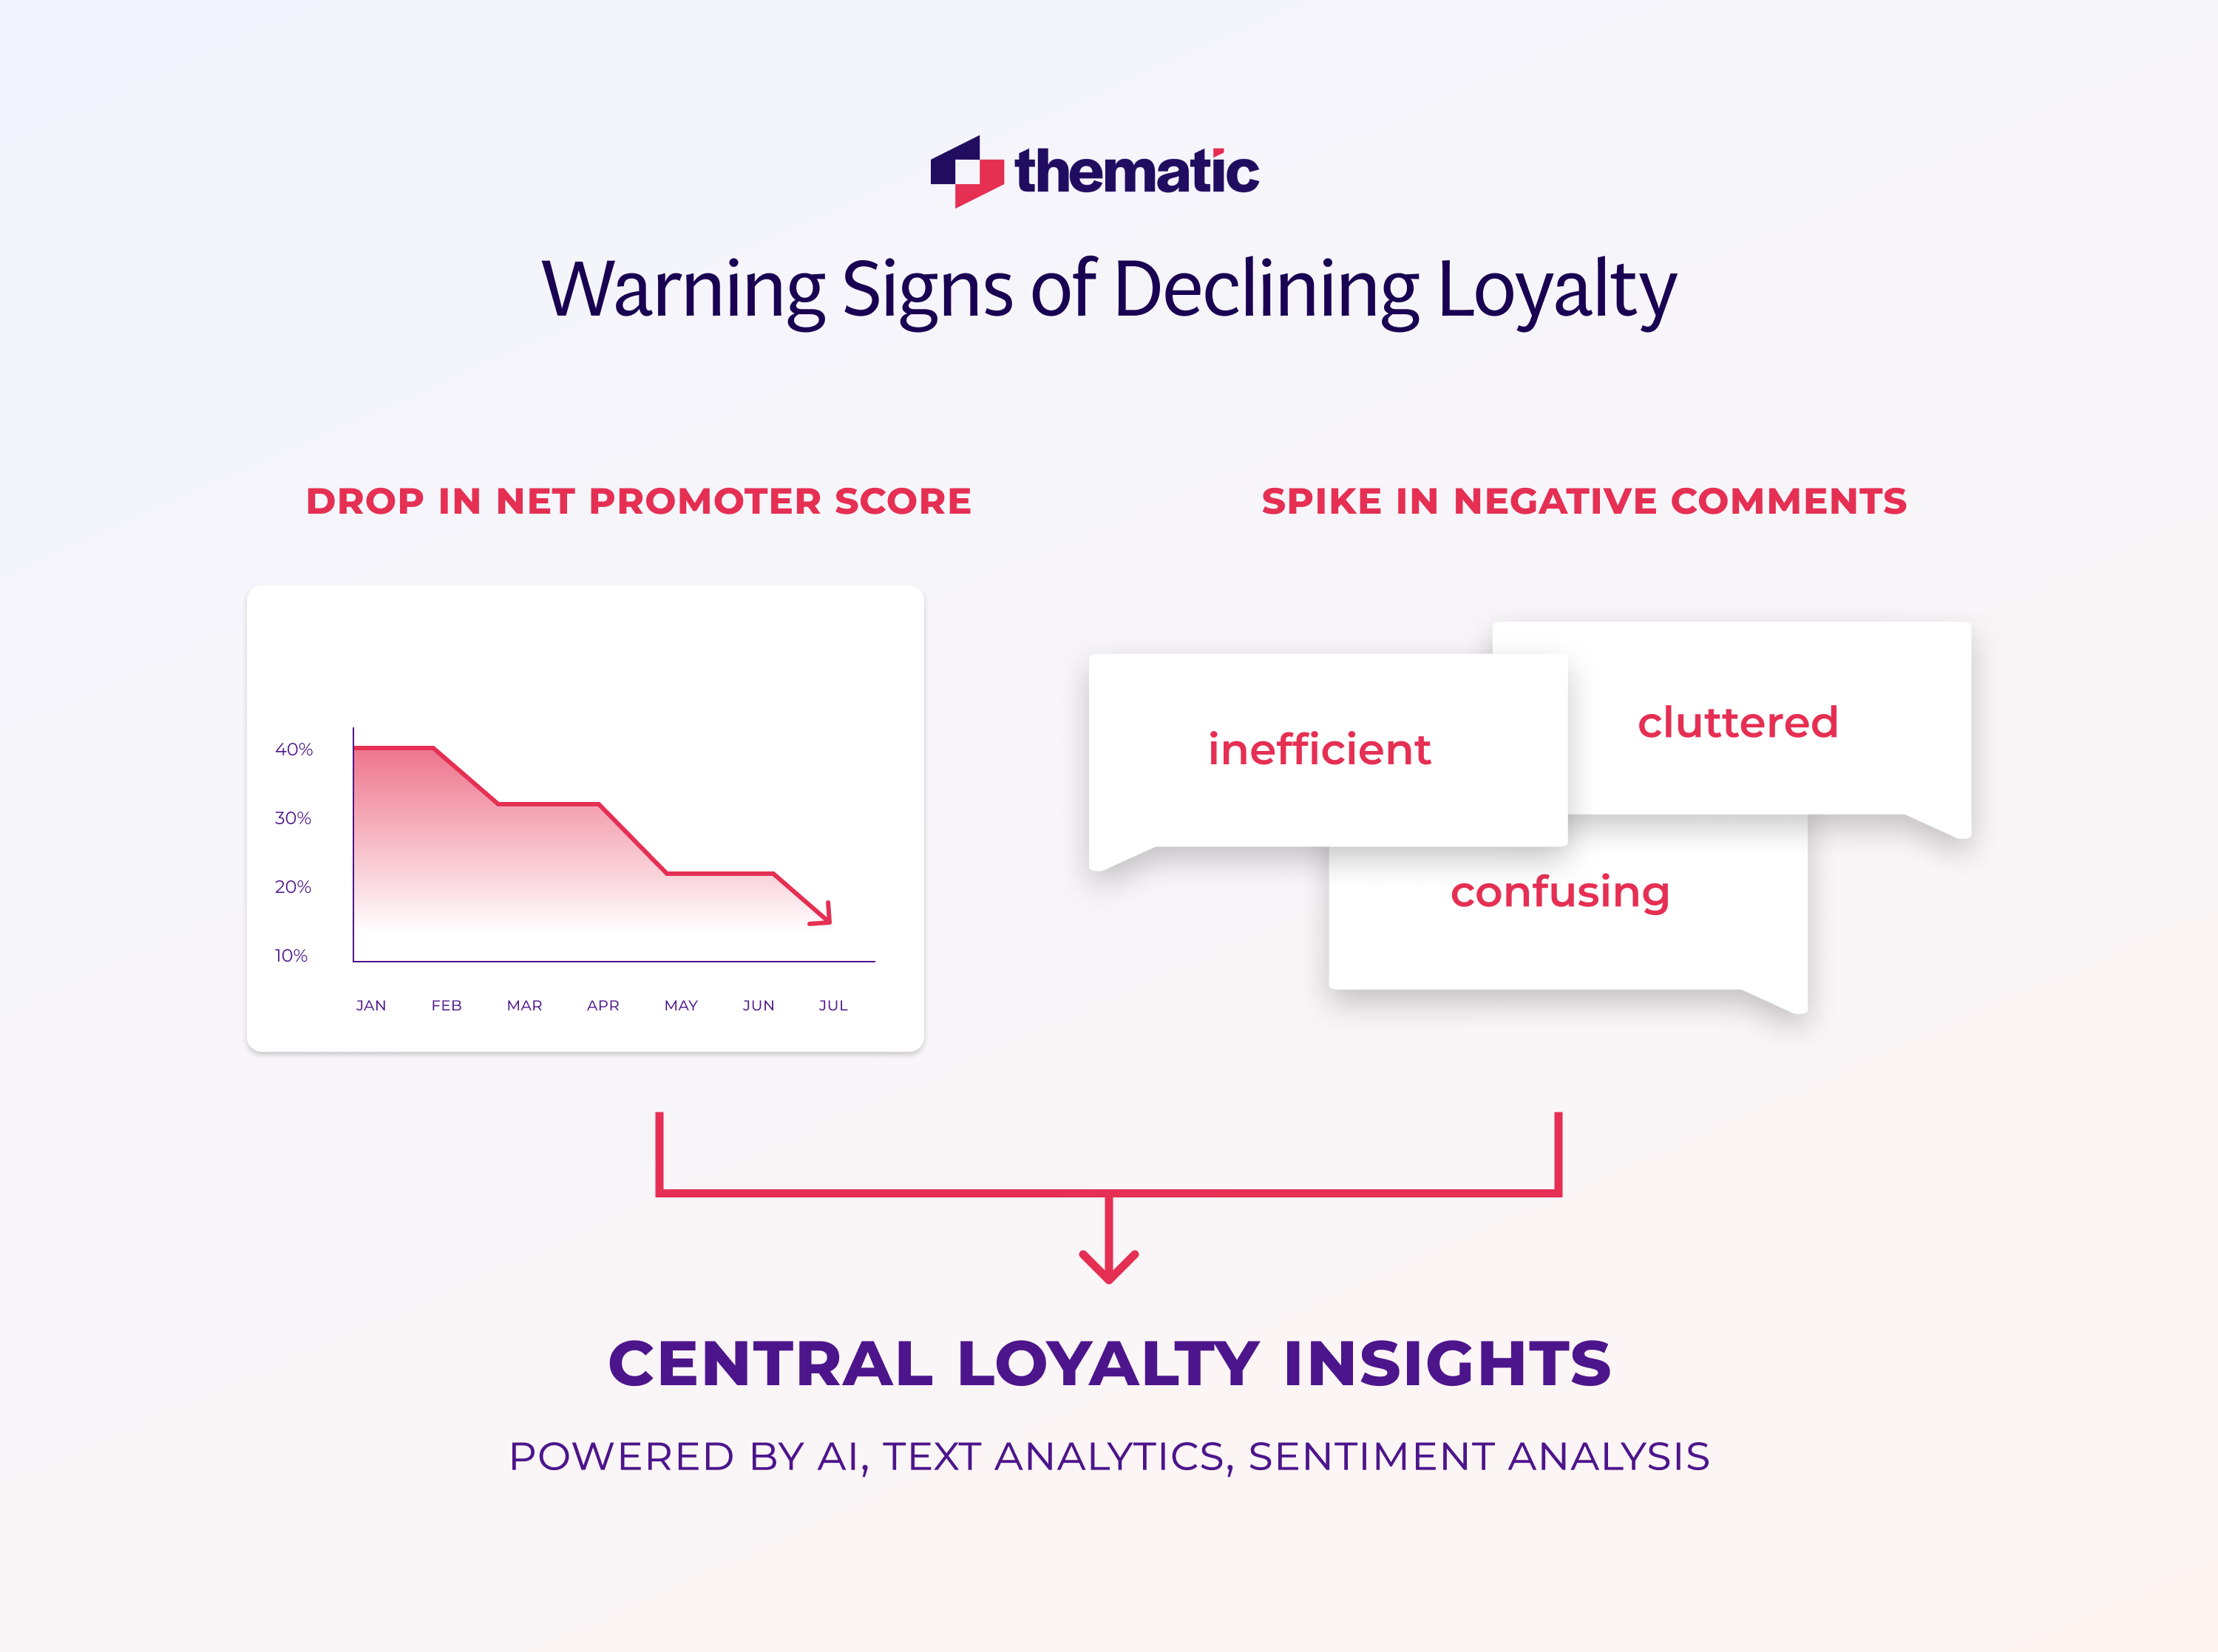
Spotting the Warning Signs of Declining Loyalty
Just as important as happy signals are the red flags that loyalty may be fading. Customer loyalty can erode quietly long before a customer actually leaves – but if you know what to watch for, you can intervene early. Here are key warning signs:
1. Dropping Engagement or Usage
When regular customers stop engaging, something’s up. Maybe they used to log in daily, but now it’s weekly—or not at all. Maybe they’ve skipped a purchase or paused their subscription. In SaaS, this often shows up as a gradual dip in feature usage before a cancellation. In retail, you might notice reduced order frequency or cart abandonment.
These behavior changes are early warning signs. If you track usage trends, you can flag disengagement before it becomes churn—and reach out with win-back efforts or personalized support.
2. Declining Satisfaction Scores
A sudden drop in NPS or CSAT among a segment—like premium customers—can reveal a brewing problem, even if your overall scores look steady.
Take DoorDash: when their merchant NPS fell, they investigated. Feedback showed users were frustrated with their menu manager tool. The interface was clunky and slowed down their workflow. By fixing it, DoorDash reversed the satisfaction dip and retained loyalty. The lesson? Don’t just monitor scores—analyze the why behind the change.
3. Negative Sentiment and Complaint Trends
Even if a customer doesn’t contact you directly, they may express frustration in open-text survey responses, reviews, or social posts.
Watch for rising use of words like “disappointed,” “frustrating,” or “not what it used to be.” If support teams report more tickets on the same issue, or your sentiment analysis shows a decline from 80% to 60% positive in a key area, that’s your cue to act.
4. Behavioral Churn Signals
Sometimes customers do show their intentions clearly:
These are signs the customer is inching toward the exit. Pay close attention to what changed in their experience or perception.
5. Price Sensitivity and Competitor References
When customers start saying “this isn’t worth the price anymore” or mention switching to a competitor, your value proposition is at risk.
One study found that 53% of consumers switched brands after just one bad experience, and 60% would switch for a better price if the perceived value isn’t there. If you hear frequent grumbles about cost or comparisons to competitors, don’t ignore it—it’s a loyalty leak in progress.
💡
Why Early Detection Matters Most customers won’t tell you they’re thinking of leaving. That’s why it’s critical to track signals continuously—not just in quarterly reviews. With modern analytics tools like Thematic, you can monitor changes in sentiment or spot patterns in complaint themes as they emerge.
Take LendingTree, for example. Their insights team used Thematic’s advanced AI to discover that customers were annoyed by lenders calling late at night. This insight came not from structured surveys, but from analyzing open-ended NPS comments. That communication misstep was quietly driving detractors—until the data surfaced it.
Metrics That Matter in Loyalty Insights
When it comes to loyalty, what gets measured gets managed. But you need to make sure you’re tracking the metrics that truly reflect loyalty—not vanity stats, but meaningful KPIs that indicate whether customers will stick around.
Here are some of the most important metrics and how they inform your loyalty insights:
1. Retention Rate and Churn Rate
These are your top-level indicators of whether customers are sticking around—or quietly disappearing.
Retention = % of customers you keep over a given period.
Churn = % of customers who leave.
Track these over time, but more importantly, segment them (by product, tenure, geography, etc.). If churn is rising in one region or among new customers, that’s your cue to investigate.
💡
Tip: Even a 5% increase in retention can lead to a 25%–95% increase in profits.
2. Net Promoter Score (NPS)
A classic loyalty proxy that asks: How likely are you to recommend us?
Scoring:
9–10 = Promoters (loyal enthusiasts)
7–8 = Passives (satisfied but uncommitted)
0–6 = Detractors (likely to churn)
Formula: % Promoters − % Detractors = NPS
NPS is easy to communicate but only powerful when paired with qualitative feedback (e.g., "What do Detractors complain about most?")—that’s quantitative and qualitative data working together. It’s also useful for setting goals like:
“Improve NPS by 10 points by resolving top complaints from Detractors.”
3. Customer Satisfaction (CSAT)
CSAT scores satisfaction with a specific interaction (e.g., after a support call or checkout). Usually a 1–5 or 1–10 scale.
It’s transactional rather than holistic—but it highlights specific loyalty risks. For example:
Stage
CSAT Score
Loyalty Risk
Onboarding
95%
✅ Low
Cancellation Flow
60%
⚠️ High
Low CSAT at key touchpoints can weaken overall loyalty even if the product is great.
4. Customer Effort Score (CES)
How easy was it for the customer to get what they needed?
“Very easy” = good loyalty predictor
“Very hard” = risk of churn
Customers will forgive mistakes—but not friction. If CES is trending high (high effort), that’s a sign of poor usability, confusing processes, or clunky service.
Use CES to uncover gaps traditional satisfaction metrics might miss, like:
“Support was helpful—but I had to talk to 3 reps before getting the answer.”
5. Lifetime Value (LTV) and Repeat Purchase Rate
These metrics directly tie to the financial impact of loyalty.
LTV = how much revenue a customer brings over their lifecycle
Repeat Purchase Rate = % of first-time customers who return
Track LTV by segment (e.g., loyalty program members vs. non-members). A low repeat purchase rate (e.g., only 30% of first-timers buy again) is a classic leaky bucket—fixing that can dramatically improve ROI.
6. Engagement Metrics
These are your early indicators of deeper loyalty behaviors:
In SaaS: login frequency, feature usage, session duration
In eCommerce: purchase cadence, email open rates, cart activity
On social: shares, comments, and positive mentions
While not core KPIs, they highlight momentum and help flag at-risk users before they churn.
7. Loyalty Program Metrics
If you have a rewards or membership program, go beyond tracking signups:
Active participation rate
Points redemption rate
Tier progression
Spending/retention lift vs. non-members
Low redemption may suggest uninspiring rewards; high engagement indicates the program is boosting loyalty. Ask: Is this program actually changing behavior?
💡
Look at Metrics in Context
Never rely on a single score. For example:
Flat NPS + declining retention → Customers say they’re happy but are quietly leaving (maybe due to pricing, competitors).
High CSAT + poor CES → Customers are satisfied after service, but the journey there is exhausting.
Bring multiple perspectives together: - CX teams monitor CSAT, NPS, CES - Product teams look at feature usage and complaints - Marketing watches retention and sentiment
Together, they give a 360° view of loyalty health.
Make It Actionable
Loyalty metrics aren’t just report-card numbers. They’re diagnostic tools.
Set clear thresholds that trigger response:
“If churn > X% or CES spikes, initiate root cause analysis.”
Use platforms like Thematic to connect unstructured feedback to these metrics and prioritize what’s driving changes.
Bottom line: Don’t just track loyalty—act on it. The right mix of metrics, viewed in context and tied to action, can guide smarter decisions and more meaningful customer relationships
Key Loyalty Metrics at a Glance
Use this quick-reference table to understand what each loyalty metric measures and how it helps guide your customer retention strategy.
Metric
What It Measures
Why It Matters for Loyalty
Retention Rate / Churn
% of customers retained or lost over time
High retention = strong loyalty. A drop can indicate trouble in specific customer segments.
Net Promoter Score (NPS)
Willingness to recommend your brand (0–10 scale)
A proxy for customer advocacy. Promoters are highly loyal and often refer others.
Customer Satisfaction (CSAT)
Satisfaction with a specific interaction or touchpoint
Captures moment-to-moment experience quality. Highlights where the journey strengthens or weakens loyalty.
Customer Effort Score (CES)
How easy customers find it to resolve an issue or complete a task
Low effort = higher loyalty. High effort often leads to frustration and churn.
Lifetime Value (LTV)
Total revenue a customer generates over their relationship
Loyal customers spend more. High LTV reflects long-term brand attachment.
Repeat Purchase Rate
% of customers who buy again
A strong sign of stickiness. Helps identify whether first-time buyers are converting to loyal fans.
Engagement Metrics
Frequency of interaction (logins, clicks, email opens, feature usage)
Indicates customer involvement and emotional investment. Early predictor of loyalty strength.
Loyalty Program Metrics
Participation, redemption rate, tier progression
Shows how appealing and effective your loyalty program is in building retention and engagement.
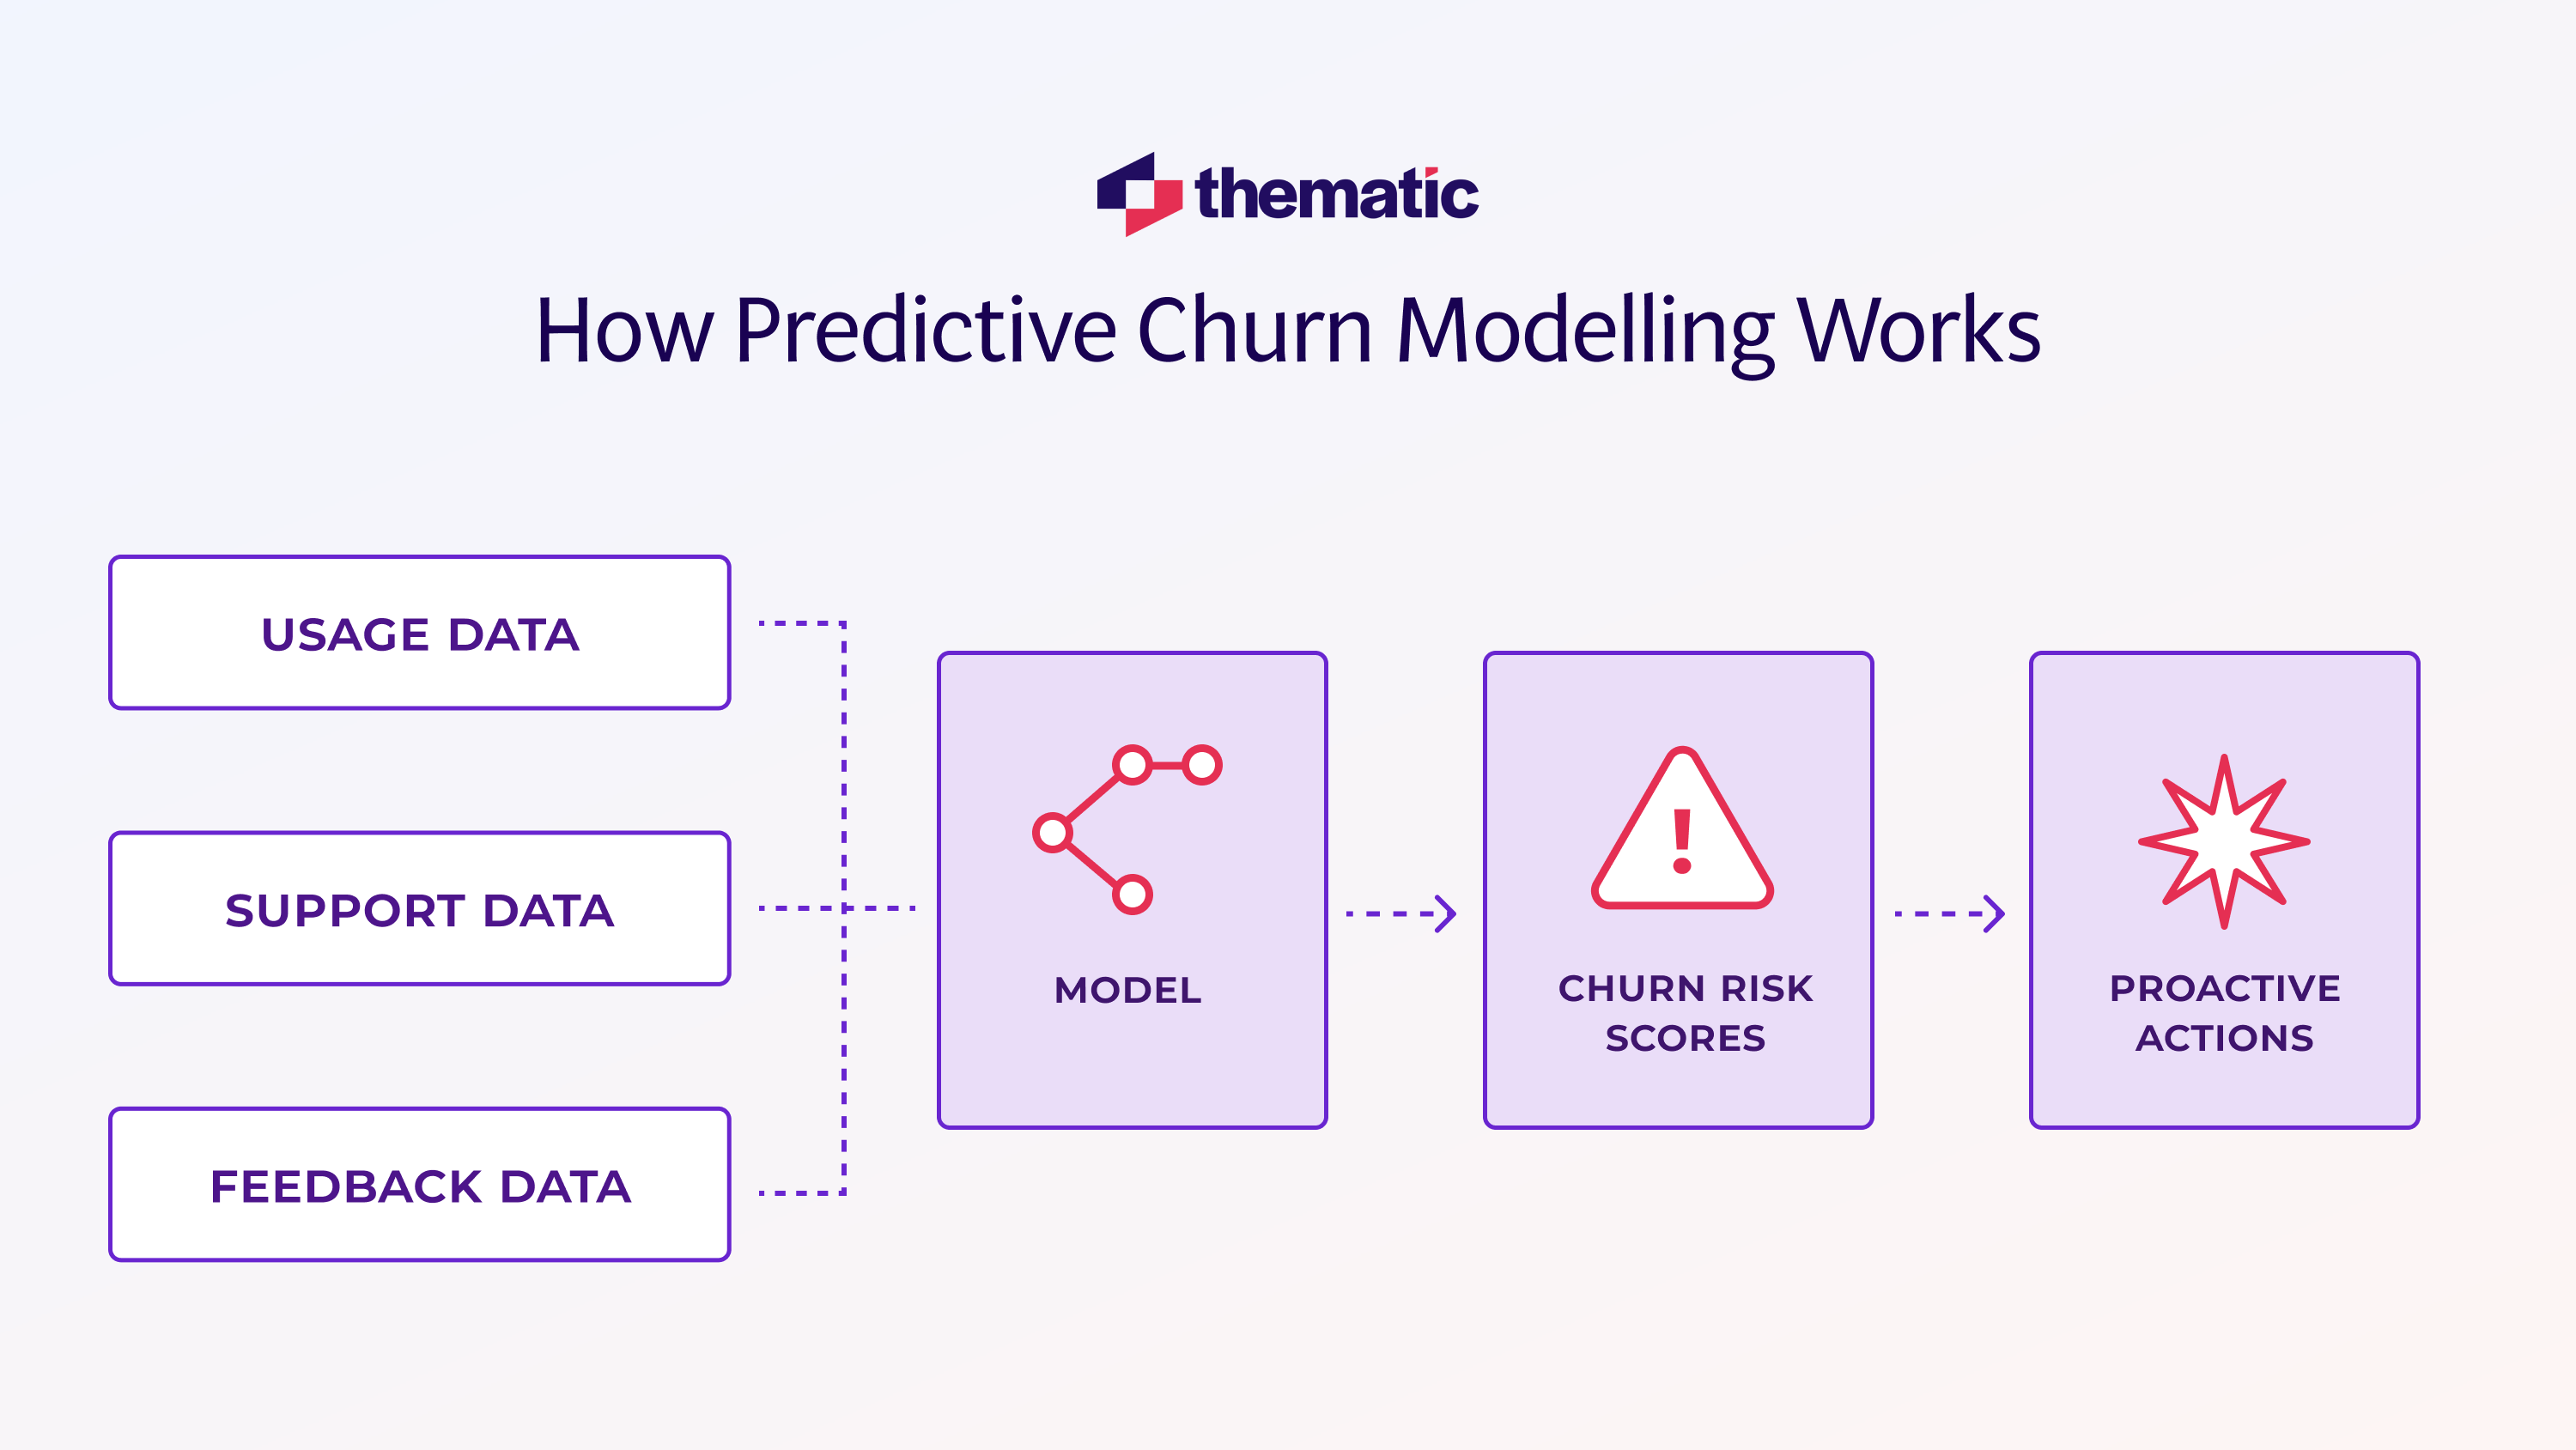
Predictive Analytics: Acting Before Churn Happens
Wouldn't it be great if you knew which customers might leave before they do? That's what predictive analytics makes possible. It uses historical customer data—such as demographics, purchase history, engagement, support interactions, and feedback—to anticipate churn, allowing proactive management rather than reactive responses.
Here's how predictive analytics can help:
Identifies churn patterns: For example, a customer with low product usage for several weeks combined with poor recent feedback is flagged as high-risk.
Prioritizes actions: Helps you target high-value or long-term customers at greater risk, ensuring resources are effectively allocated.
Uses AI and qualitative data: Modern tools analyze unstructured data, such as recurring complaint themes, enhancing prediction accuracy.
Real-world examples illustrate its power:
A subscription service notices churn spikes after month three, discovering frustration when users hit feature limits. They introduce an intermediate plan or proactively reach out before the limit is reached, preventing churn.
An e-commerce brand identifies customers likely to churn after 90 days without purchases and 60 days without app login. Predictive analytics triggers personalized win-back campaigns at the first sign of inactivity.
Not every unhappy customer is worth chasing—but some definitely are. Predictive analytics helps you:
Prioritize high-risk, high-value customers
Allocate resources more efficiently
Spot issues before they snowball
It also works with unstructured data—like customer comments. If “too expensive” comes up frequently in a customer’s feedback, that theme can feed into their risk profile.
💡
Companies using predictive analytics are 128% more likely to report strong ROI from their customer insights.
Getting Started
You don’t need a massive data science team to begin. Tools like Thematic offer built-in predictive features, including churn forecasting and trend detection.
To implement:
Connect your data sources. Use Thematic’s one-click integrations to import surveys, reviews, chat logs, and more.
Let Thematic tag and theme feedback. The AI automatically identifies sentiment and recurring themes, then quantifies patterns and trends.
Explore insights with filters. Drill down by theme, sentiment, channel, product, or time to uncover key drivers.
Take action through workflows. Set alerts, share dashboards, and push insights to teams like product, support, and marketing.
But prediction alone isn’t enough—you need clear playbooks to act on these insights.
Define cross-functional responses—like targeted offers or personal outreach—to quickly address at-risk customers. By anticipating churn and intervening early, predictive analytics boosts retention and builds long-term loyalty.
Think of predictive analytics like a loyalty weather forecast. If a storm’s brewing, you don’t wait—you prepare, or better yet, prevent it altogether. The best companies don’t wait for a quarterly report to reveal churn—they’re already reaching out, solving issues, and rebuilding trust.
Being proactive, not just reactive, is what turns insights into impact.
Thematic
AI-powered software to transform qualitative data into powerful insights that drive decision making.
While a central insights or CX group may coordinate the effort, the responsibility for acting on those insights spans your entire organization. Why? Because what drives or damages loyalty often cuts across product, marketing, support, and operations. The best companies treat loyalty as a shared KPI—and make sure everyone can access and act on the insights that matter.
DemocratizeYour Insights
Instead of siloed reports, build accessible dashboards or portals where teams can filter insights based on their focus—e.g., product can dive into feature feedback, while support monitors complaints.
Customer insights platforms and other feedback tools like Thematic make this easier by letting teams explore real-time feedback without needing to wait on analysts. As LendingTree puts it: “Teach them to fish, rather than give them the fish.”
Here’s how different teams typically contribute:
CX/Insights Teams gather and interpret feedback, flag changes in metrics like NPS or churn, and help distribute insights to decision-makers.
Product Teams use loyalty insights to guide feature roadmaps or fix pain points. At DoorDash, merchant feedback triggered a redesign of their menu tool—cutting friction and boosting loyalty.
Marketing uses insights to shape messaging and retention efforts. If customers value product quality or personalized experiences, campaigns should reflect that. They also manage loyalty programs and win-back strategies.
Customer Support both feeds into and benefits from insights. If complaint themes are rising, they’re the first to know—and often the first to act.
Sales/Account Teams use loyalty signals to manage at-risk accounts, track satisfaction, and re-engage long-term customers before churn.
Leadership sets the tone. When executives reference customer feedback and make it part of business strategy, everyone else follows.
To turn insight into action, assign ownership clearly: who will address the issue or double down on what’s working? And with tools like Thematic’s Generative AI, even non-analysts can ask, “Why are customers frustrated this month?” and get immediate, usable answers.
In short: Everyone owns loyalty insights. And the teams best positioned to act—whether it’s fixing bugs, rewriting messaging, or improving training—should take the lead. This kind of shared accountability is how insights move from reports to real impact.
Your Competitive Edge Starts Here
Loyalty insights are your roadmap to deeper customer relationships—but only if you act on them.
From support tickets to social sentiment, each signal tells you what matters most to your customers. Use that knowledge to fix pain points, personalize experiences, and prevent churn before it happens.
Share insights across teams, close feedback loops quickly, and make improvements that customers can feel.
Loyalty isn’t a one-time win—it’s earned again and again.
Treat every insight as an opportunity to build trust. Because when customers feel heard, they stick around—and they tell others. That’s how loyalty becomes your competitive edge.
Ready to start gathering customer loyalty insights? Experience feedback analysis in action on your own data with a demo of Thematic.
Share
Link Copied!
Request a demo of Thematic's Customer Intelligence Platform
Thematic turns fragmented feedback into one consistent source of customer truth — so every team acts on the same customer story. Up and running in days, not quarters.
Thank you! Your submission has been received!
Oops! Something went wrong while submitting the form.