From Ignored to Indispensable: The Proven, Step-by-Step CX Insights Mastery Blueprint in < 6 Days! Get free access>


If you've ever had to analyze customer feedback, you know creating the perfect code frame is the hardest part. You need to understand the dataset, the stakeholders involved, and the ideal outcomes of the analysis. Manual coding takes weeks, introduces bias, and often misses unexpected patterns.
AI-powered thematic analysis software changes this by automatically discovering themes from your data in minutes, then giving you transparent control to refine results. But the technology also creates new questions: how should you organize themes? When should you use AI versus manual coding? How do you ensure the results are trustworthy?
This guide walks you through the full process, from choosing between AI and manual approaches, to step-by-step setup using Thematic's feedback analytics platform, to measuring the ROI of your analysis.
The right approach depends on your dataset size, analysis goals, and whether you need ongoing monitoring or a one-time study. Here's how to decide.
The best approach to thematic analysis is reflective, where researchers understand the data deeply. AI doesn't replace this reflection: it accelerates the process from weeks to minutes, letting you spend time on insights rather than manual coding.
If you've decided AI is the right approach for your dataset, the next question is which tool to trust with your analysis.
For a deeper look at thematic analysis methodology and when different approaches apply, see our guide to thematic analysis.
Most AI text analytics tools are black boxes. You see input and output but not what happens in between. This is a problem for thematic analysis because researchers need to explore, validate, and refine themes to trust the results. When you can't see how themes were created, you can't validate the analysis or explain to stakeholders why a theme matters.
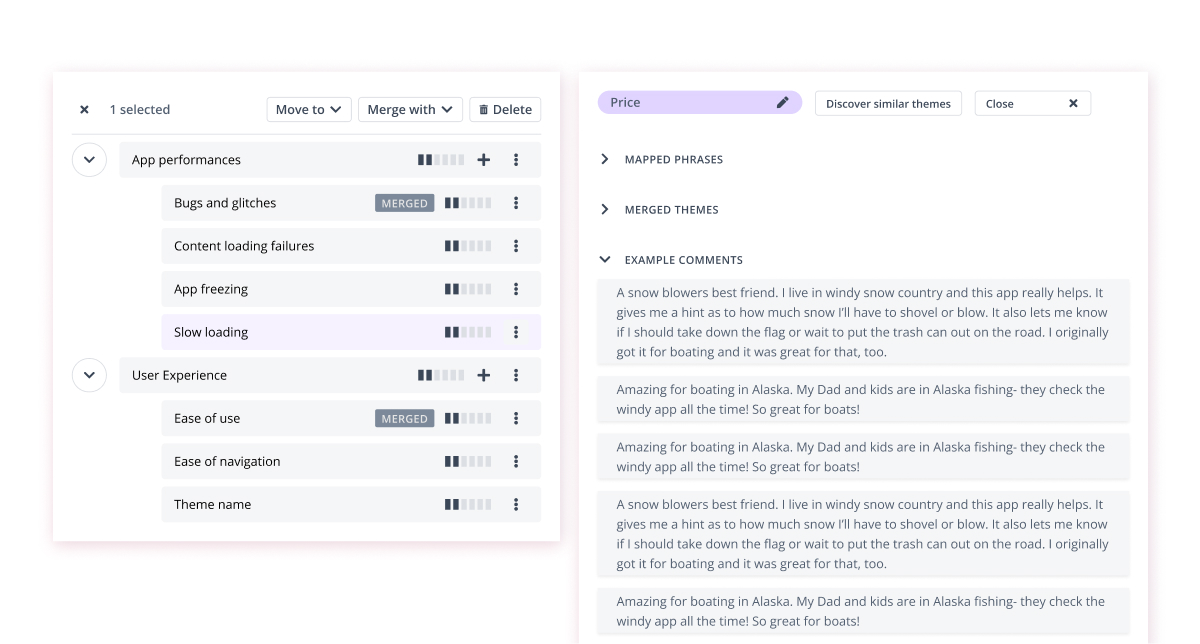
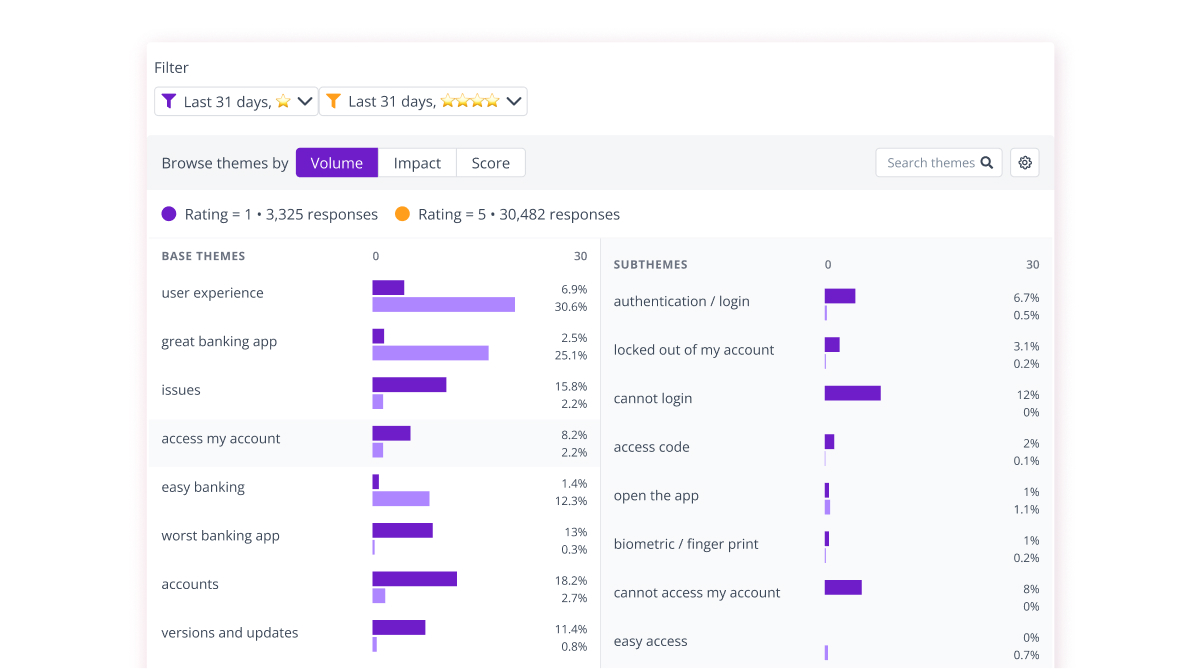
Thematic's customer intelligence platform takes a fundamentally different approach: bottom-up discovery. AI discovers themes from the data itself, with no pre-labeling required, then researchers use the Theme Editor to refine, merge, rename, and reorganize themes in a simple drag-and-drop interface.
The AI handles pattern recognition at scale:
The Theme Editor gives humans transparent control:

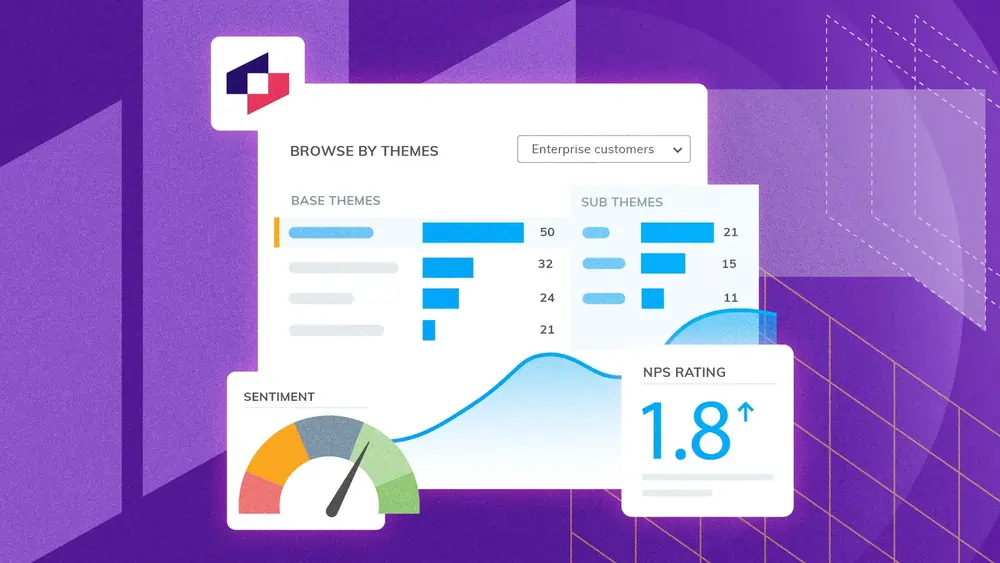
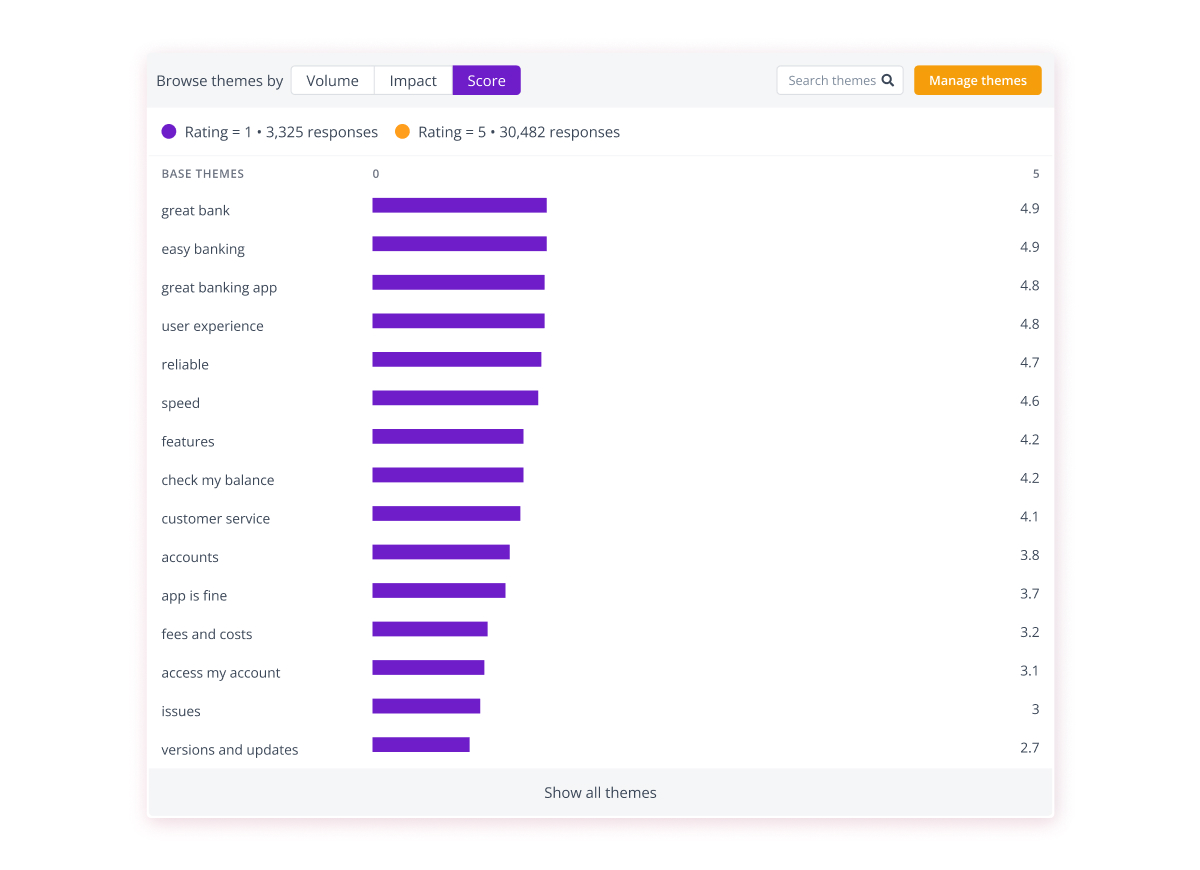
Beyond theme discovery and refinement, Thematic's feedback analytics platform turns themes into strategic intelligence. Deep Dive breaks themes into sub-trends, Score Change Waterfall quantifies each theme's contribution to metric movements, and Thematic Answers lets you query your data in natural language with data-grounded responses.
Regional segmentation and cross-source verification round out the analytical toolkit, so teams can compare findings across segments and validate insights across channels. You'll see each of these in action in Step 5 below.
Before (raw data): Levels, a US-based health and wellness company, collected 2,700 UX product survey responses across 6 open-ended questions. Manual analysis would take weeks.
AI discovers themes (minutes): Chris, Head of Member Experience, uploaded the survey to Thematic. The AI automatically identified themes like "ease of creating account," "app navigation," and "data visualization preferences."
Human reviews and refines (hours over ~3 days): Using the Theme Editor, Chris saw exactly which phrases mapped to each theme. He merged similar themes, renamed them for clarity, and organized the hierarchy to match how his team thinks about the product.
After (organized theme hierarchy with impact scores): The refined theme model showed which features mattered most to early adopters, with frequencies, sentiment, and NPS impact for each theme. "Because Thematic is easy to use, the team quickly dove into the data, finding insights that were both specific and actionable."
The Levels example illustrates a typical workflow. Here's what that process looks like at a high level, regardless of your industry or feedback source.
Input: Any text feedback (surveys, support tickets, reviews, chat transcripts, social media)
Output: Organized theme hierarchy with:
One-click Qualtrics integration: Hours (no IT needed)
Medallia integration: ~1 day (dev team builds secure tunnel)
Full theme model refined: ~3 days total
For context, traditional enterprise text analytics platforms typically require 2-4 weeks of professional services plus 2-4 weeks of internal work to configure taxonomies. Thematic's bottom-up discovery approach delivers a working theme model in ~3 days.
The speed difference isn't just about setup, but rather about business agility. When you can analyze new feedback in minutes instead of weeks, you can act while issues are still fresh and opportunities are still open.
Expected input: Customer feedback from any source (surveys, tickets, reviews, chat) in CSV, Excel, or via direct integration
For specific guidance on analyzing customer and product reviews, see our review analysis guide.
Expected output: Data successfully connected and ready for AI analysis
What happens: Thematic supports multiple ways to bring data in:
Thematic provides unified analysis across surveys, support tickets, reviews, chat transcripts, and social media feedback. You can analyze all channels together for a complete view of customer voice, or segment by channel to compare themes across touchpoints.
You're establishing a continuous connection, not just a one-time file transfer. This enables real-time monitoring rather than batch analysis.
Real example: Levels brought 2,700 UX product survey responses into Thematic in hours, not weeks. Chris, Head of Member Experience, chose Thematic for its user-friendly interface and powerful AI capabilities.
Common mistake: Uploading data with inconsistent formatting or missing critical metadata (timestamps, NPS scores, customer IDs). Clean your data first or work with Customer Success to map fields correctly.
Success indicator: Thematic displays your total comment count and confirms all expected fields are mapped correctly.
Expected input: Your connected dataset with multiple columns
Expected output: Configured analysis setup with comment columns, scores, and segments identified
What happens: An AI assistant helps you set up variables:
Real example: Greyhound connected their post-trip customer survey to Thematic, configuring segments so managers could drill down to location-level performance. This meant a regional manager could see feedback specific to their area without requesting a custom report.
Why this matters: The AI assistant creates a customized analysis setup reflecting YOUR organization's structure, not a generic industry template.
Common mistake: Not configuring segmentation variables. If you skip this, you can't answer "Is this issue regional or company-wide?" later.
Success indicator: Preview shows comment columns correctly identified, with accurate language detection and appropriate segments configured.
Expected input: Your configured dataset from Step 2
Expected output: Complete analysis with discovered themes, sentiment model, categories, issues, and requests automatically identified
What happens: The AI performs multiple analytical tasks simultaneously. Themes are discovered automatically without pre-defined categories, a sentiment model is created and applied to every theme, and categories, issues, and requests are identified across your feedback. Unlike platforms that use generic industry taxonomies, your theme model is built from your data using bottom-up discovery. "Fast delivery" and "fast food" never end up in the same theme because the AI understands meaning, not just vocabulary.
Thematic uses proprietary AI models for theme discovery and semantic coding, plus LLMs as force multipliers for Deep Dive analysis, intelligent summaries, and natural language queries through Thematic Answers.
Real example: From LendingTree's 20,000 comments per quarter, Thematic worked "straight out of the box" and discovered that acquisition costs were a major barrier, a theme that wasn't in any pre-defined taxonomy but emerged from customer language.
Thematic helps them make sense of feedback data in a way that is quick, quantified and rich with stories.
Common mistake: Expecting perfection on the first run. The AI provides a strong starting point (80-90% accurate), which you refine in Step 4. Don't skip refinement thinking "AI knows best." Your business context makes themes more relevant.
Success indicator: Themes capture major feedback patterns and make intuitive sense. Sentiment appears automatically on every theme. You can drill down to see supporting comments.
Expected input: AI-generated theme model from Step 3
Expected output: Refined, business-relevant theme model aligned with your organization's language and priorities
What happens: Add "human in the loop." Your Customer Success team works with you to:
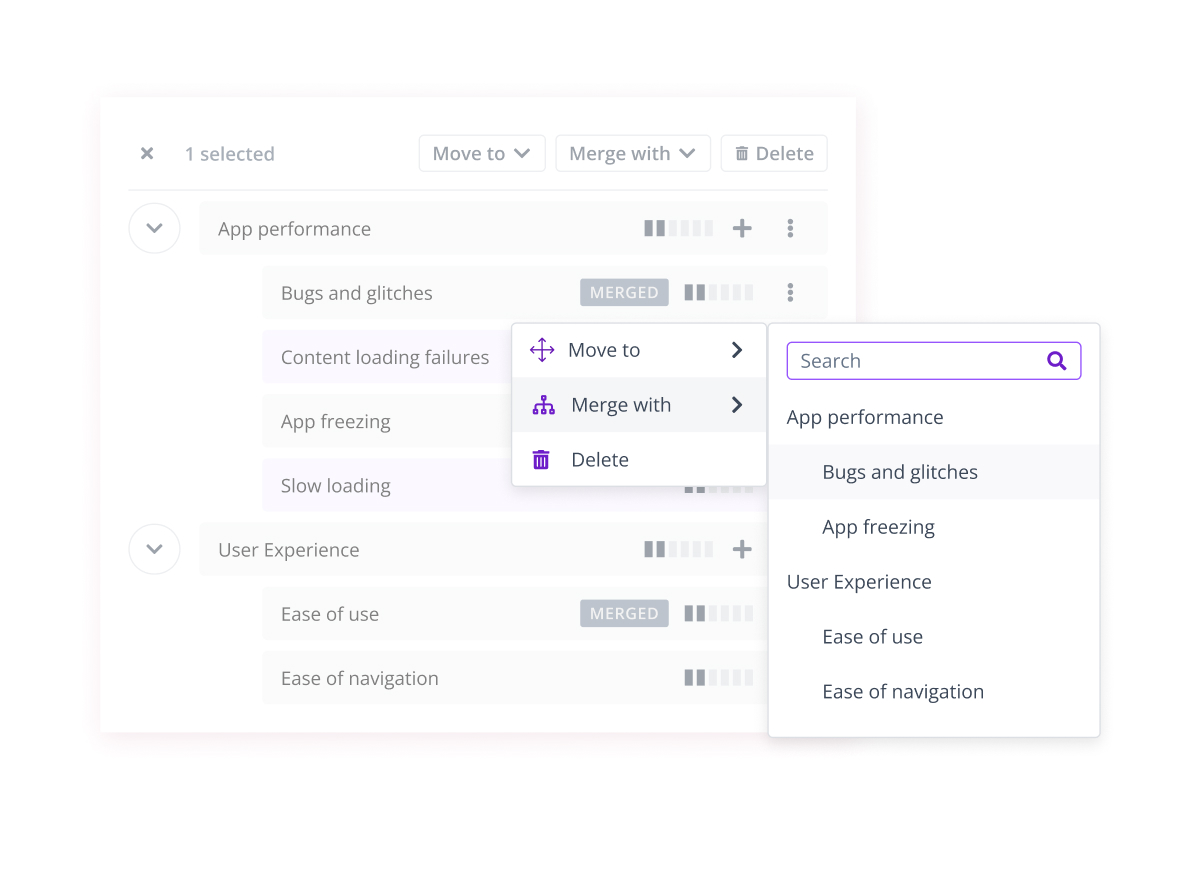
Using the Theme Editor:
You see exactly which phrases map to each theme. The editor lets you:

Real example: Analyzing retail feedback, the AI discovered "egg prices are high" with 200+ phrase variations. Using the Theme Editor, the team unmerged "increasing egg prices" to track it separately from general pricing complaints, allowing them to monitor this specific trend over time.

Why this matters: Research-grade accuracy is achieved through short review iterations during onboarding (~3 days total), after which the taxonomy stabilizes. Regular monitoring flags new or ambiguous themes as your product evolves.
Common mistake: Over-refining too early. Start with high-level themes, validate with stakeholders, then add granularity where it matters. Don't create themes based on what you THINK customers should say. Let the data guide you.
Success indicator: Your team recognizes the themes and can immediately use insights to make decisions. Theme coverage monitoring shows 80-90%+ of feedback is captured.
Expected input: Refined theme model from Step 4
Expected output: Ready-to-share reports with charts, written summaries, and recommended actions all in minutes
What happens: Thematic transforms themes into strategic intelligence through three core capabilities:
Impact analysis
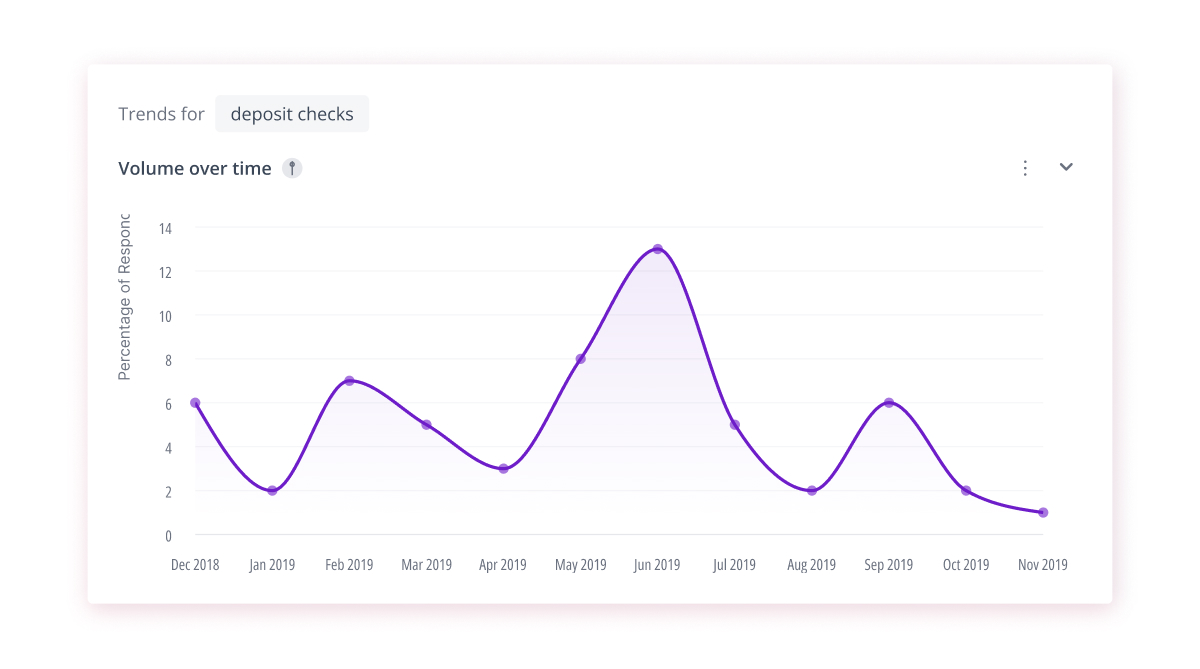
Deep Dive breaks themes into sub-trends to reveal nuanced patterns. Example: "Egg prices are high" decomposes into three distinct trends: price changes without warning (strongest negative sentiment), pricing inconsistent with stock, and value perception (mix of positive/negative). Shows trend analysis over time: January spike dragged NPS down 5 points, then cooled off in February.
Score Change Waterfall provides instant AI-generated explanation of why a score changed, with an interactive chart quantifying each driver's contribution. Example: "Overall NPS declined from -49 to -67. High egg prices contributed 1.79 points of decline. Inventory management added another 2.1 points." These are generated in seconds, saving hours of manual dashboard investigation.
Natural language querying and reporting
Thematic Answers lets you ask questions in natural language and get data-grounded responses that cite actual customer feedback and never hallucinate. Example: "What are the trends in egg pricing feedback?" returns specific findings with supporting evidence.
AI-generated narrative summaries automatically produce written explanations ready to share with stakeholders. The platform generates reports that read like an analyst wrote them, with charts, summaries, and recommended next actions, all in minutes.
Segmentation and verification
Regional segmentation lets you compare theme impact across regions, while cross-source verification validates findings across multiple data sources (surveys, tickets, reviews) in a unified view. Example: Discovering egg pricing is a trust issue in the South (not a support issue) because it's not driving call center volume despite appearing frequently in surveys. This prevents misdiagnosis and ensures teams take the right action.
Real example combining capabilities:
Starting with the "egg prices" theme discovered in Step 3:
Complete journey from raw data to defensible recommendation in minutes.
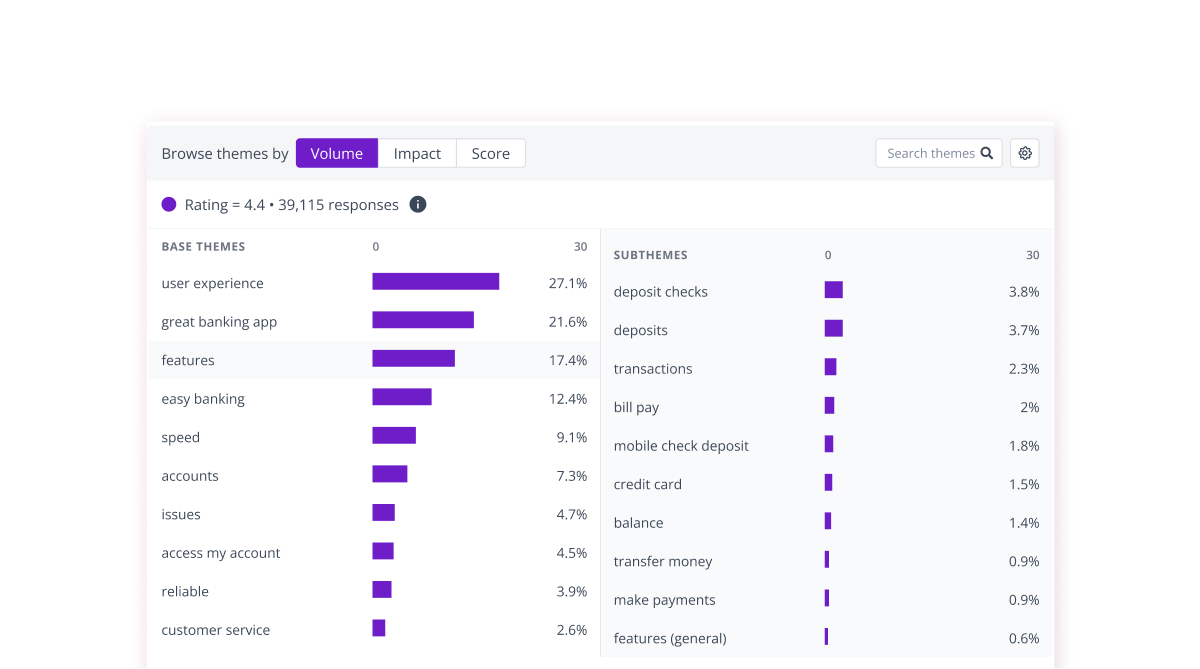
Common mistake: Creating too many dashboards before understanding what decisions stakeholders need to make. Start with 2-3 core views: themes by volume, themes by impact, trends over time.
Success indicator: Stakeholders self-serve decision-ready insights without requesting custom reports. Leadership meetings reference Thematic dashboards directly. Teams say "let me check Thematic" instead of "can you run a report?"
Expected input: Working theme model and analysis dashboards from Step 5
Expected output: Thematic integrated into your organization's workflow
What happens: Different organizations activate cross-functional intelligence differently. This step is about fitting Thematic's feedback analytics capabilities to how your organization uses data.
Real example — DoorDash:
Real example — Large retail company:
Create different theme structures for different audiences:
Integration flexibility:
Common mistake: Trying to replicate someone else's adoption pattern instead of starting with how your organization currently uses feedback. If you do quarterly NPS reporting today, start there. Thematic fits your workflow. You don't change processes to fit the tool.
Success indicator: Multiple teams reference Thematic insights in decision-making. Theme data appears in leadership presentations, product roadmaps, and operational planning. You're not constantly asked for "custom reports" because stakeholders have self-serve access.
Is your Thematic Analysis solution still relying on NLP? Discover how large language models are revolutionizing text analytics, offering deeper insights than traditional NLP approaches.
According to an independent Forrester TEI study of Thematic customers:
ROI assumptions (illustrative):
The key driver: speed enables action. When Greyhound reduced analysis time from 2-3 weeks to 10 minutes, insights arrived while issues were still fresh, allowing immediate operational improvements.
Follow these steps to successfully deploy AI thematic analysis:
Track these indicators to ensure your AI thematic analysis is delivering value:
AI thematic analysis transforms customer feedback from an overwhelming data challenge into actionable intelligence. Where traditional tools require 2-4 weeks of professional services, Thematic delivers a working theme model in ~3 days. Companies automate 4,250 hours of manual analysis annually and achieve payback under 6 months, according to a Forrester Total Economic Impact study.
The AI x Human approach is the key: AI handles pattern recognition across thousands of comments, while you bring business context through transparent refinement tools. Start with a clear use case (NPS verbatims, support tickets, or product reviews), let the AI generate your initial themes, then refine to match your business language.
The easiest way to experience how AI can theme your data is to try it on your own feedback. Thematic offers a free trial for companies with substantial feedback volume. Book a demo with Thematic to see how feedback analytics turns your qualitative data into decision-ready insights.
Upload your survey data to an AI thematic analysis tool like Thematic, which uses bottom-up discovery to identify themes without requiring pre-defined categories. The AI generates themes in minutes, you refine them using a visual editor, then analyze results by theme volume, sentiment, and impact on metrics like NPS. Complete setup typically takes ~3 days.
Use AI for datasets over 500 responses, continuous monitoring, or multi-channel analysis. Manual coding works for small datasets under 500 responses where deep contextual exploration matters more than speed. For most enterprise use cases, a hybrid approach works best: AI discovers themes quickly, then humans refine and validate to ensure business relevance.
Setup takes ~3 days total: data integration takes hours for Qualtrics (one-click) or ~1 day for Medallia, AI theme generation takes minutes, and theme refinement with your team takes ~3 days working with Customer Success. This compares to 2-4 weeks of professional services plus 2-4 weeks of internal work for traditional platforms.
Companies achieve 543% ROI over 3 years with payback under 6 months, according to a Forrester Total Economic Impact study. Key drivers include 4,250 hours of manual analysis automated annually, faster time to insights enabling rapid action, and improved CX from data-driven decisions. Real example: Greyhound reduced analysis time from 2-3 weeks to 10 minutes, enabling real-time operational improvements.
Thematic's Score Change Waterfall provides instant AI-generated explanations of metric changes between time periods. The platform generates both a narrative summary and an interactive waterfall chart quantifying each theme's contribution in metric points. For example: "Overall NPS declined from -49 to -67. High egg prices contributed 1.79 points of decline, while inventory management added 2.1 points." This analysis happens in seconds, making it easy to share with leadership and prioritize actions.
A good theme captures a meaningful pattern across your data that is distinct, specific, and actionable. Themes should be granular enough to guide decisions but broad enough to represent a real pattern. For example, "checkout friction" is more useful than the overly broad "website issues" or the overly narrow "button color on page 3." In AI-powered thematic analysis, the initial themes discovered by the AI provide a strong starting point, which you then refine to match your business language and decision-making needs.
AI thematic analysis platforms like Thematic enable cross-functional intelligence by creating shared, consistent theme models that product, CX, operations, and leadership teams all reference. Each team gets customized dashboards with the same underlying data, so decisions are aligned around a common understanding of customer needs rather than siloed interpretations.
Thematic turns fragmented feedback into one consistent source of customer truth — so every team acts on the same customer story. Up and running in days, not quarters.


Transforming customer feedback with AI holds immense potential, but many organizations stumble into unexpected challenges.


.webp)

.webp)
