If you're part of a Voice of Customer or research team, you probably deal with customer surveys, complaints, chats or call transcripts every day. And with that, do you find yourself jumping between tools, trying to piece together the full story? That’s where Unified Data Analytics comes in.
Unified Data Analytics means bringing all your data—structured and unstructured—into one place, so your team can get answers faster and with more confidence. It’s about moving past siloed spreadsheets, platforms, and tools, with the goal of getting a clear picture of what’s happening across the customer journey.
Why should this matter? Because companies that unify their data make better, faster decisions. Instead of debating whose data is right, teams can align on a complete view of what the data actually says.
You probably heard the famous quote by the Netscape CEO Jim Barksdale:
“If we have data, let’s look at data. If all we have are opinions, let’s go with mine.”
Well, this was back in the 90s! Today, things have changed. It's easier than ever to have data, but more often than not this data is incomplete. Anyone can put a sample of data from a tool into ChatGPT or a Microsoft CoPilot to analyze it. But as a result, companies end up with conflicting insights that pull teams into opposite direction. The good news, Unified Data Analytics can fix this problem.
In this article, we’ll explore what Unified Data Analytics really is, how it’s transforming the way VoC and insights teams deliver value beyond surveys, and why it might be the most powerful tool you’re not fully using—yet.
What is unified data?
As we said earlier, unified data is the result of aggregating data from disparate sources into a single view in order to provide more complete and accurate answers to the critical questions in an organization.
Typically, this is done using data warehousing as a central destination for data from different parts of the business, such as sales, customer info, marketing, finance, and operations. For example, it might include purchase history, web traffic stats, or employee performance data. Commonly used data warehouses include Snowflake, Amazon Redshift, and Google BigQuery.
Most data warehouses are designed to handle structured data—information that’s organized in rows and columns, like in databases or spreadsheets. This includes things like customer details, sales numbers, or transaction records. On the other hand, unstructured data is messier and doesn’t fit neatly into tables—it includes things like emails, support chat logs, images, videos, or social media posts. While data warehouses focus on structured data, companies often use data lakes to store unstructured data.
Since the rise of large language models (LLMs) like ChatGPT, there’s been a growing interest in unifying customer feedback—which is often unstructured—across different channels. Businesses are realizing that rich insights are hidden in reviews, support tickets, surveys, and social media, but this data has traditionally been hard to analyze at scale. Now, with LLMs able to understand and summarize language, it’s become much more feasible to bring all this feedback together and extract meaningful trends.
Think about the different ways people or customers are likely to share their feedback:
When they try to do something online, but can not so they turn to live chat
By sending an angry Tweet
Unifying this data in one place could provide the most accurate view of what works and what doesn’t work in the company’s current products and processes.
An even more accurate picture emerges when we unify this unstructured qualitative feedback data with structured quantitative data that captures customer behaviour:
All of this data can be unified via customer IDs in a single data warehouse.
But having all your data in one place is only part of the equation. To actually make sense of it—and to turn raw information into meaningful insights—you need the right set of tools working together behind the scenes—you need the Modern Data Stack.
What is the Modern Data Stack?
The Modern Data Stack (MDS) is a flexible, cloud-based set of tools that helps companies collect, store, transform, and analyze data at scale. It includes components like data warehouses (e.g. Snowflake), ETL tools (like Fivetran or Airbyte), transformation layers (like dbt or Thematic), and BI tools (such as Looker or Tableau).
What sets the MDS apart is its modularity—it lets teams plug in best-in-class tools, including AI-powered feedback analytics platforms, to make unified insights faster and more actionable. It's become the foundation for turning fragmented customer feedback into a clear, connected story.
So you’ve got the tools, and your data is finally speaking the same language. Now the big question is: how do you actually use it to get answers that matter? That brings us to unified data analytics.
What is unified data analytics?
Having customer data in one place is nice, but how do you actually use it effectively to get answers to your questions?
This is where analytics comes in!
Unified Data Analytics is the process of collecting, analyzing, visualizing, and acting on customer data—across surveys, reviews, support tickets, and more—in one connected system. For Voice of Customer and research teams, it means fewer silos, faster insights, and better collaboration across the business.
Unified Feedback Analytics vs. Unified Data Analytics
You may come across the term Unified Feedback Analytics, a term sometimes used to describe the process of pulling customer feedback from multiple sources—such as surveys, support tickets, and product reviews—into one platform for analysis.
In this article, we use the broader term Unified Data Analytics, which includes not only feedback but also structured data like transactions, behavioral metrics, and operational signals. This enables deeper, cross-functional insights that drive business decisions.
To make this possible, companies typically rely on a set of tools that fall into four categories:
1. Capture Tools – Where feedback lives
These include platforms like Medallia, Qualtrics, SurveyMonkey, Salesforce, or Zendesk. They gather structured and unstructured feedback from surveys, CRM notes, support chats, and reviews.
The challenge: These tools are often fragmented and don’t talk to each other, which makes unified analysis hard.
2. Analysis Tools – Where insights come to life
This is where Thematic shines. Unlike traditional platforms that focus on scores or word clouds, Thematic uses AI to analyze all types of customer feedback—automatically detecting themes, sentiment, and sub-themes across channels.
Thematic delivers deeper, validated insights without the need for consultants, or more traditional & manual coding & tagging.
Medallia and XM Discover are alternatives, but may require extensive setup, rely on consultants, and don't offer the same depth of reporting.
3. Visualization Tools – Where insights are shared
To communicate findings, teams often turn to platforms like Power BI, Tableau, or Looker. These are great for structured data dashboards. Thematic also has native visualizations—allowing you to see the “why” behind NPS or CSAT at a glance.
Once insights are clear, the goal is action. Integration with tools like Salesforce Service Cloud, Slack, Jira, or HubSpot lets companies route feedback to the right teams or trigger workflows in real-time.
All-in-One vs. Best-in-Class: What Works Best?
Some companies try to do everything in one place—using Qualtrics or Medallia as both survey and analytics platforms. While convenient, these setups can create shallow insights and limit flexibility.
Others take a best-in-class approach, combining:
Thematic for AI-powered insight discovery,
Snowflake or BigQuery for data warehousing,
and Looker/Tableau for broader reporting.
This approach gives companies deeper, more actionable insights with faster time to value.
How AI is Transforming Unified Data Analytics
AI is making it easier than ever to understand customer feedback across channels. What used to require manual coding and tagging can now be done quickly using natural language processing and machine learning.
Let’s look at how AI fits into the unified data analytics ecosystem:
1. Analyzing unstructured feedback at scale
Unstructured data—like open-ended survey responses or support tickets—is rich in insights but hard to analyze manually.
Modern AI tools can automatically surface recurring themes, sentiment, and trends.
Tools specializing in feedback analytics, like Thematic, XM Discover, Chattermill, or Kapiche, enable teams to go deeper than traditional dashboards. Others, such as Medallia or Qualtrics, are often built around broader survey management and may rely on more manual setup or consultant support.
2. Spotting emerging trends faster
With AI, it's possible to detect patterns—such as rising complaints about a feature—before they show up in metrics like churn or NPS.
3. Enabling action through structured outputs
Once feedback is processed and structured, it becomes easier to connect with tools like Slack, Jira, or Salesforce, enabling teams to respond quickly or track changes over time.
4. Integrating into the modern data stack
Advanced teams feed structured feedback themes into data warehouses like Snowflake or BigQuery, where they can be joined with behavioral or revenue data and visualized through Looker or Power BI.
How companies benefit from unified data analytics today
Companies we work with at Thematic are already benefiting from unified data analytics today, and so can you! The example below shows a real use case that your company could adopt today:
Imagine you need to answer the question, “What can we do to improve customer experience for those customers who spend the most money with us and are the most satisfied with our products?”
Here is how you would approach this using unified data analytics:
Step 1. Prepare the data to unify it in one place
Make sure that the results from your NPS or Customer Satisfaction survey have customer IDs associated with it.
For each customer ID, provide a sales metric such as Customer Lifetime Value (CLTV) alongside the ID. Use Thematic Analysis, or a similar technology, to discover and quantify themes in customer responses to open-ended survey questions.
Step 2. Run your query across unified data
To answer your question, assuming you have all data in one place, you have a few choices:
You could limit the query to customers with the greatest CLTV and the highest satisfaction scores, and then look at the most common themes among their responses.
You could calculate the total CLTV for each theme among the improvement suggestions by the most satisfied customers.
If your satisfaction scores and customer spend have a high correlation, it might be best to look at the less satisfied customers in order to understand how to increase their overall satisfaction and spend.
Step 3. Visualize the results
Oftentimes customers wants and needs are visualized via word clouds, but you will get the most accurate picture by using bar charts that group similar themes, while visualizing theme volume and impact. (Why word clouds harm insights)
Bar charts also let you visualize the difference in themes between customer segments, such as those with high versus low satisfaction.
At Thematic, we will also provide you with an overview of what will result in the greatest impact on customer satisfaction or NPS.
Why you need unified data analytics today
Nowadays, businesses collect information from multiple sources—marketing, sales, customer support, and product teams. But when data is stored in silos, teams struggle to collaborate and make informed decisions.
Take performance marketing teams, for example. They focus on ad performance, social analytics, and content demand, but without access to sales and customer experience data, they can’t see which campaigns attract the best long-term customers.
By unifying data across departments, companies can:
Improve decision-making: Marketing learns which leads convert fastest.
Enhance customer insights: CX teams identify what drives loyalty.
Optimize product strategy: Teams know which features customers love.
Many CRMs and analytics tools attempt to bridge these gaps, but true Unified Data Analytics connects all business units effortlessly. When teams share insights, they make better strategic decisions—faster.
The companies that embrace Unified Data Analytics gain a competitive edge.
Perhaps if unified data would have been easily available to the Netscape CEO, he would have made very different decisions and you would be reading this post in a Netscape browser.
Common Pitfalls to Avoid When Implementing Unified Data Analytics
While Unified Data Analytics can unlock powerful insights, many companies struggle with implementation. Without the right approach, businesses risk wasting time, resources, and missing out on critical insights. Here are some common pitfalls to watch out for—and how to avoid them:
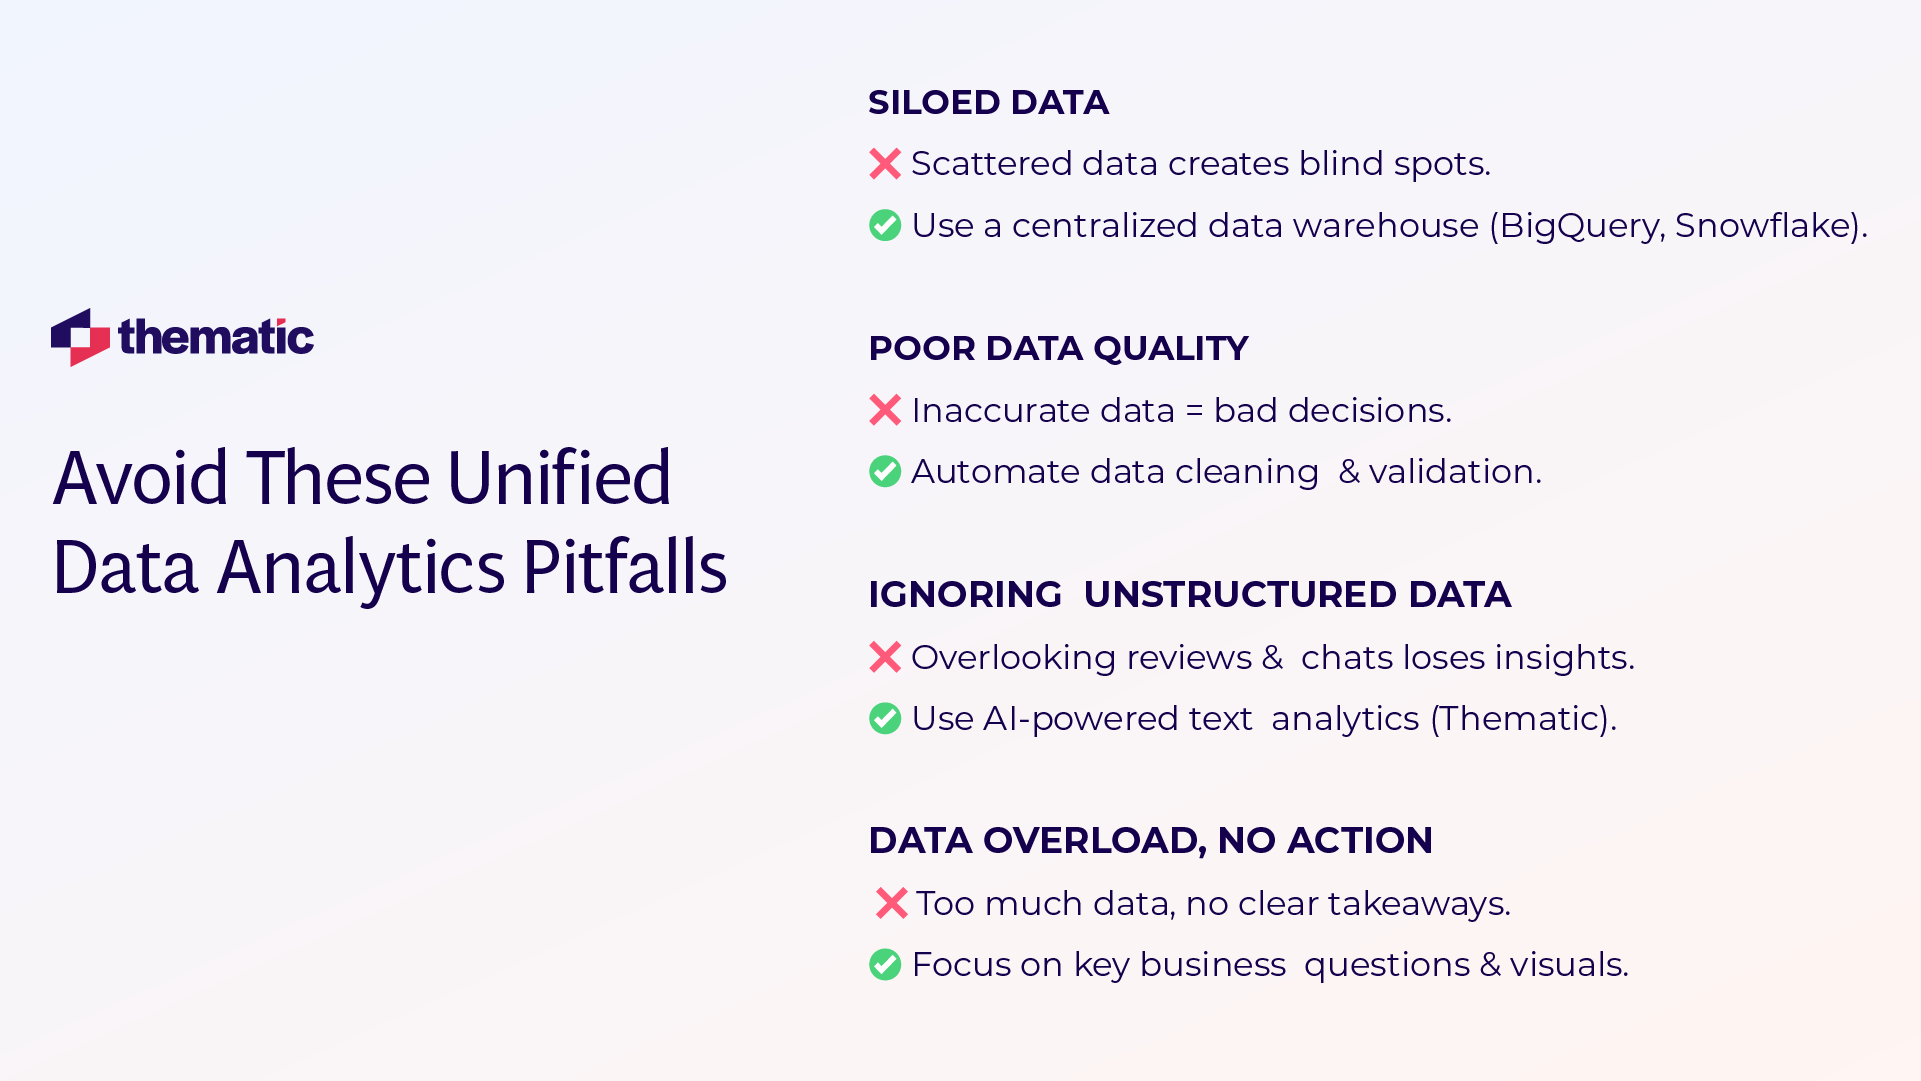
1. Siloed Data Sources
The problem: Data is scattered across multiple platforms—marketing tools, sales CRMs, customer support systems—making it difficult to get a complete view.
The fix: Use a centralized data warehouse or integration platform to bring all your data together. Connecting systems like BigQuery, Snowflake, or Amazon Redshift ensures no insights get lost.
2. Poor Data Quality
The problem: If data is incomplete, inconsistent, or outdated, it leads to inaccurate conclusions.
The fix: Set up automated data cleaning processes and validation checks. Ensure your analytics platform flags errors before they impact decision-making.
3. Ignoring Unstructured Data
The problem: Most businesses rely on structured data (e.g., survey scores, revenue numbers) but overlook unstructured data like customer reviews, support conversations, and social media feedback—where the richest insights often live.
The fix: Use AI-powered text analytics tools, like Thematic, to analyze qualitative data at scale. This ensures you're capturing both numbers and customer sentiment for a holistic view.
4. Focusing on Data, Not Insights
The problem: Companies often gather massive amounts of data but don’t have a clear plan for turning it into action.
The fix: Instead of drowning in numbers, focus on key business questions first. Use visualization tools like Tableau or Power BI to present findings in a clear, actionable way.
By avoiding these common mistakes, companies can maximize the impact of Unified Data Analytics—leading to faster, smarter, and more strategic decisions.
The Future of Data-Driven Decisions
Unified Data Analytics is the key to making faster, smarter, and more accurate business decisions. By integrating structured and unstructured data from multiple sources, companies can eliminate blind spots, uncover hidden trends, and take proactive action based on real insights.
Organizations that embrace Unified Data Analytics today could gain a competitive edge, delivering better customer experiences, higher efficiency, and stronger business growth. They don’t simply collect data—they use whatever insights they get to make decisions that drive real impact!
Want to see Unified Data Analytics in action? Discover how Thematic can transform your customer feedback into powerful insights! Try Thematic now!
Frequently Asked Questions (FAQs)
What are the key challenges of implementing Unified Data Analytics?
While Unified Data Analytics offers many benefits, companies often face hurdles such as data silos, integration difficulties, and ensuring data accuracy. Many organizations also struggle with selecting the right analytics tools and managing data security across different platforms.
What industries benefit the most from Unified Data Analytics?
Industries that generate large amounts of data from multiple sources benefit the most. This includes retail, healthcare, finance, and technology. Any industry that relies on customer insights, operational efficiency, or predictive analytics can leverage Unified Data Analytics to improve decision-making.
How does Unified Data Analytics differ from traditional Business Intelligence (BI)?
Traditional BI focuses on structured data from specific sources, often using pre-built dashboards and static reports. Unified Data Analytics, on the other hand, integrates structured and unstructured data from various sources, applies AI-driven analytics, and enables real-time insights.
What tools and technologies are essential for Unified Data Analytics?
Key technologies include
data warehouses (e.g., Snowflake, BigQuery),
AI-powered text analytics (e.g., Thematic),
data visualization tools (e.g., Tableau, Power BI), and
data integration platforms (e.g., Apache Spark, Talend).
These tools help automate data collection, analysis, and visualization for better insights.
Share
Link Copied!
Request a demo of Thematic's Customer Intelligence Platform
Thematic turns fragmented feedback into one consistent source of customer truth — so every team acts on the same customer story. Up and running in days, not quarters.
Thank you! Your submission has been received!
Oops! Something went wrong while submitting the form.


.jpg)