How to discover and prioritize improvement initiatives for your CX and product
What is the secret to achieving more with less? As you and I well know, it’s all about working on the right things. However, so much resource is dedicated to building the wrong things. Software companies are notoriously bad at this. Pendo.io analyzed usage data collected by SaaS products and found that 80% of features aren’t used. They estimate that building these features cost around 8 billion. This is basically money down the drain.
So how can you leverage customer feedback to prioritize the right things? How can you identify flaws and opportunities worth investing in? In this article, I’ll share techniques businesses can use to ensure they’re focusing on the initiatives that will deliver maximum value - for the least expense.
In this post you will learn:
- How to create a list of improvement initiatives
- How to prioritize your improvement initiatives using Pareto analysis
- How to prioritize your improvement initiatives using the 2x2 matrix
The result: A refined and focused list of improvement initiatives that will have the most critical business impact.
Customer feedback: The starting point for your prioritization research
Any business dedicated to improving their customer experience or product will inevitably run into the complexities of responding to customer feedback.
I don’t mean individual responses via email - but rather, the response of actionable improvements and change within the business.
When customers have communicated issues or changes they want to see, businesses accumulate a list of possible improvement initiatives. Here’s an example:
| Customer Feedback | Business initiative |
| The app is stuck on the loading screen on my iPhone! | Delegate programmer hours to resolving the loading screen bug on iOS |
| Harry is so rude to me! He says the company policy is that I can’t get a refund! | Better customer service training for your frontline teams |
| I wish there was a way I could integrate your software into excel | Create an excel integration for your software |
| No way am I paying this price for a book! It's way cheaper at John’s bookstore | Reduce pricing mark-up |
Responding to this feedback and implementing initiatives will result in an improved product, service or experience. As we know, this is easier said than done...
The difficulty with this is obvious. How can you tell which feedback is meaningful and worth responding to? And even if you have a big list of initiatives, where do you start? Which business initiatives will drive the most return on investment
Before we can get there, first, we need to analyze our feedback so that we can identify the problems to create initiatives for.
How to analyze your feedback to find product and customer experience improvements
One of the simplest ways to analyze your customer feedback in 2020 is to use feedback analysis software. In this blog post, we will be using Thematic to analyze dummy feedback data from an airline.
1. Create a free account with Thematic
Thematic is one of the few feedback analysis software that lets you upload and analyze a portion of your data via a free trial.
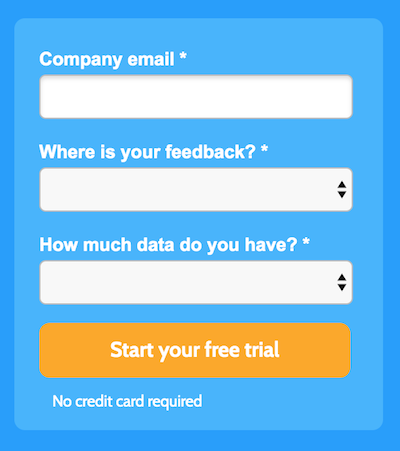
Head to this page to create a trial account.
Then, fill out the registration form which asks for the location of your feedback (Excel, SurveyMonkey, etc.) and how many rows of data you are looking to analyze.
Note: Thematic won’t support analyzing feedback in word documents or user interviews.
Once you’ve submitted the form, check your email for a link to create your account.
And then log in, simple! Now you can upload your feedback data into the software for analysis.
2. Upload your feedback data into Thematic
You can upload your feedback from a CSV, or you can pull it into Thematic from one of the integrations available such as Qualtrics, Delighted, Trustpilot, or SurveyMonkey. Here is a full list of available integrations.
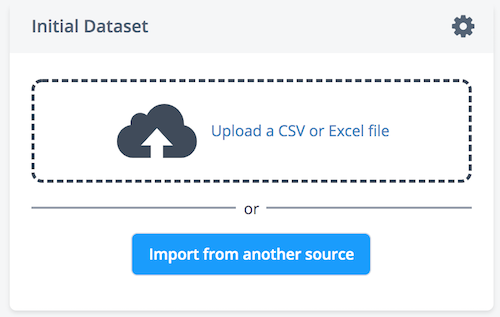
For this example, I uploaded our dummy data via an excel spreadsheet.
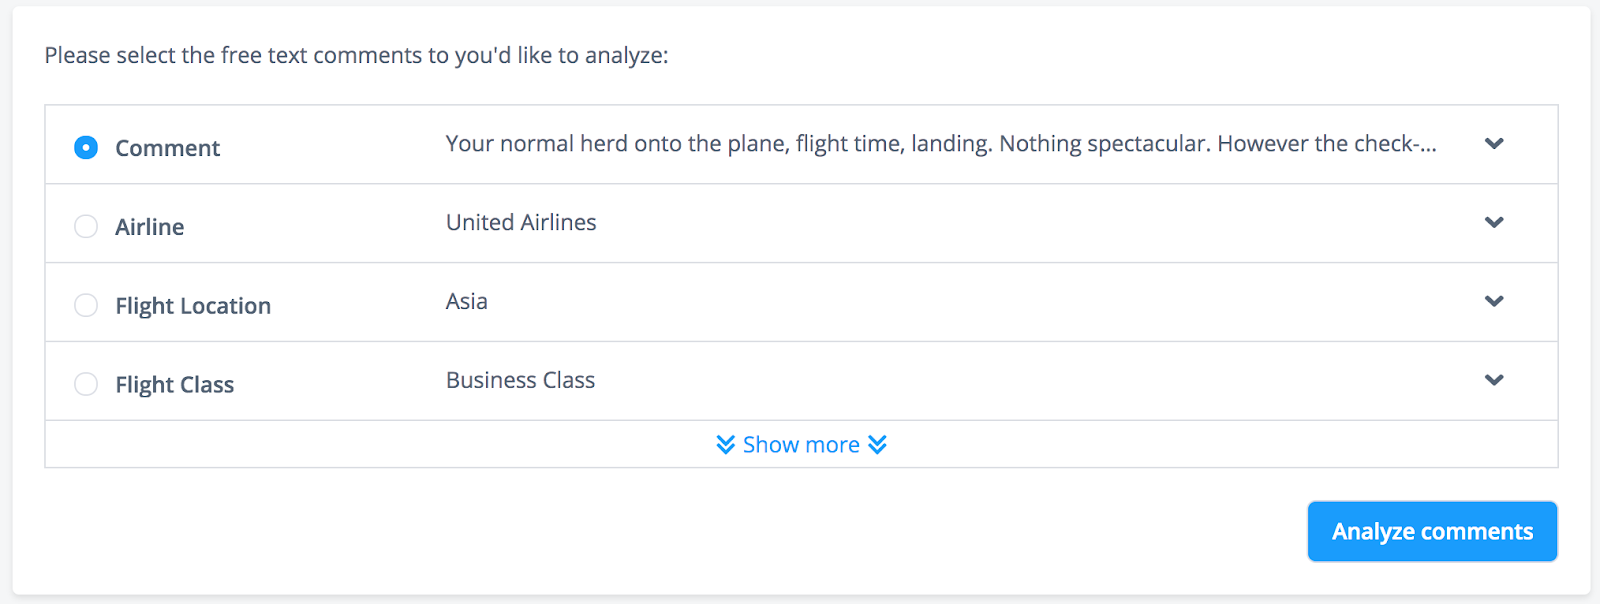
Select the row that contains your comments, and click ‘Analyze Comments’. Make sure to upload not just the feedback but also information about the person who left this feedback.
Thematic uses a combination of AI and a human-based review to find themes in all of your feedback. It takes up to a day to get the results, but the accuracy of analysis will be high.
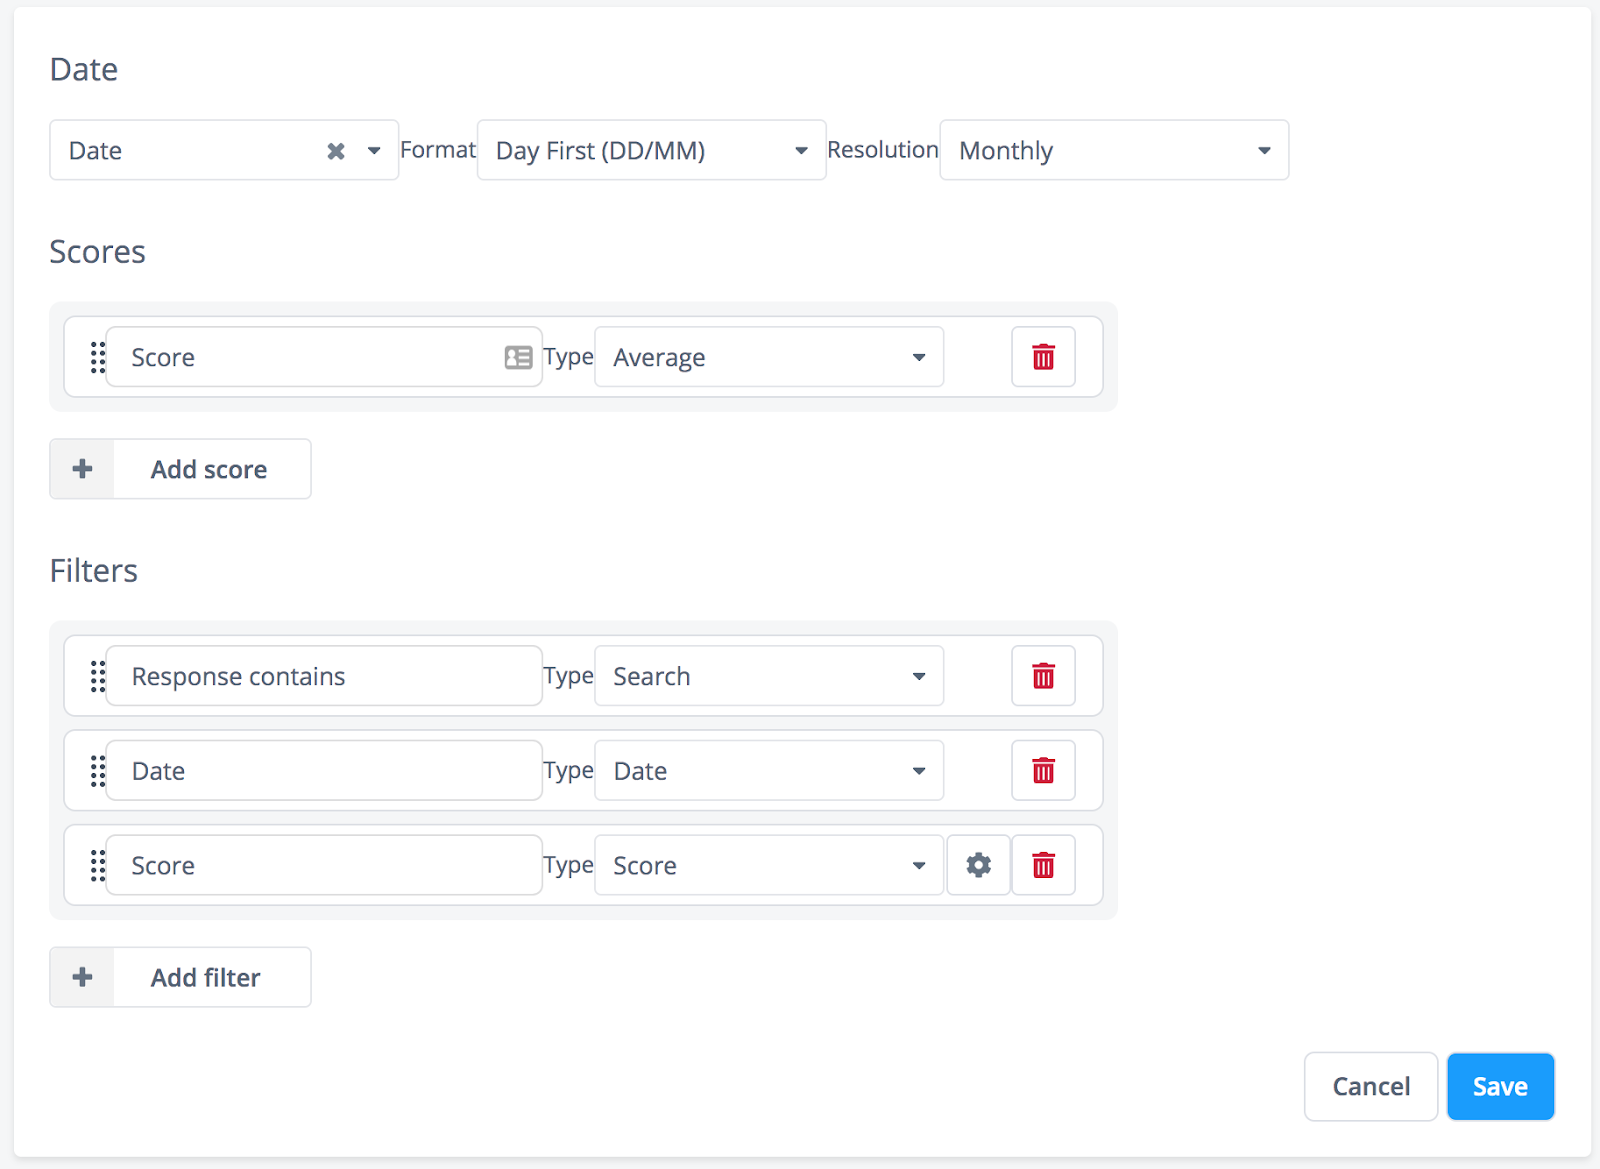
In the meantime, you can jump ahead and begin to configure your data and add filters so that you can get the most out of Thematic. Configuring your data helps you see analysis such as a theme's impact on scores over time.
If you have a metric or a score alongside your feedback, e.g. an NPS or a rating, also include it when uploading your data. This will help you identify themes in the feedback which are negatively impacting your metric.
Tips for importing data:
- Make sure your data contains at least 100 rows.
- Include metadata columns with text feedback so that you can segment the results e.g. location or age group.
- If uploading in .xlsx format, the data must be on the first sheet.
3. Search for themes in feedback negatively impacting your scores
Now that Thematic has analyzed our feedback and created a list of themes, we can begin to see the problems having the most negative impact on our business, product or customer experience.
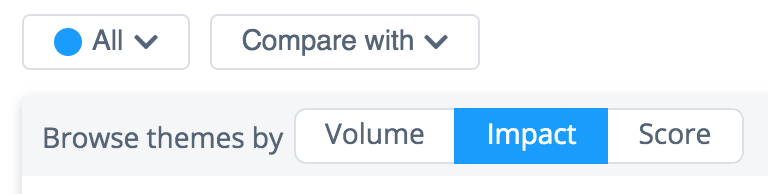
Make sure you are browsing your themes by ‘impact’. That way, we can see the impact each theme is having on our score.
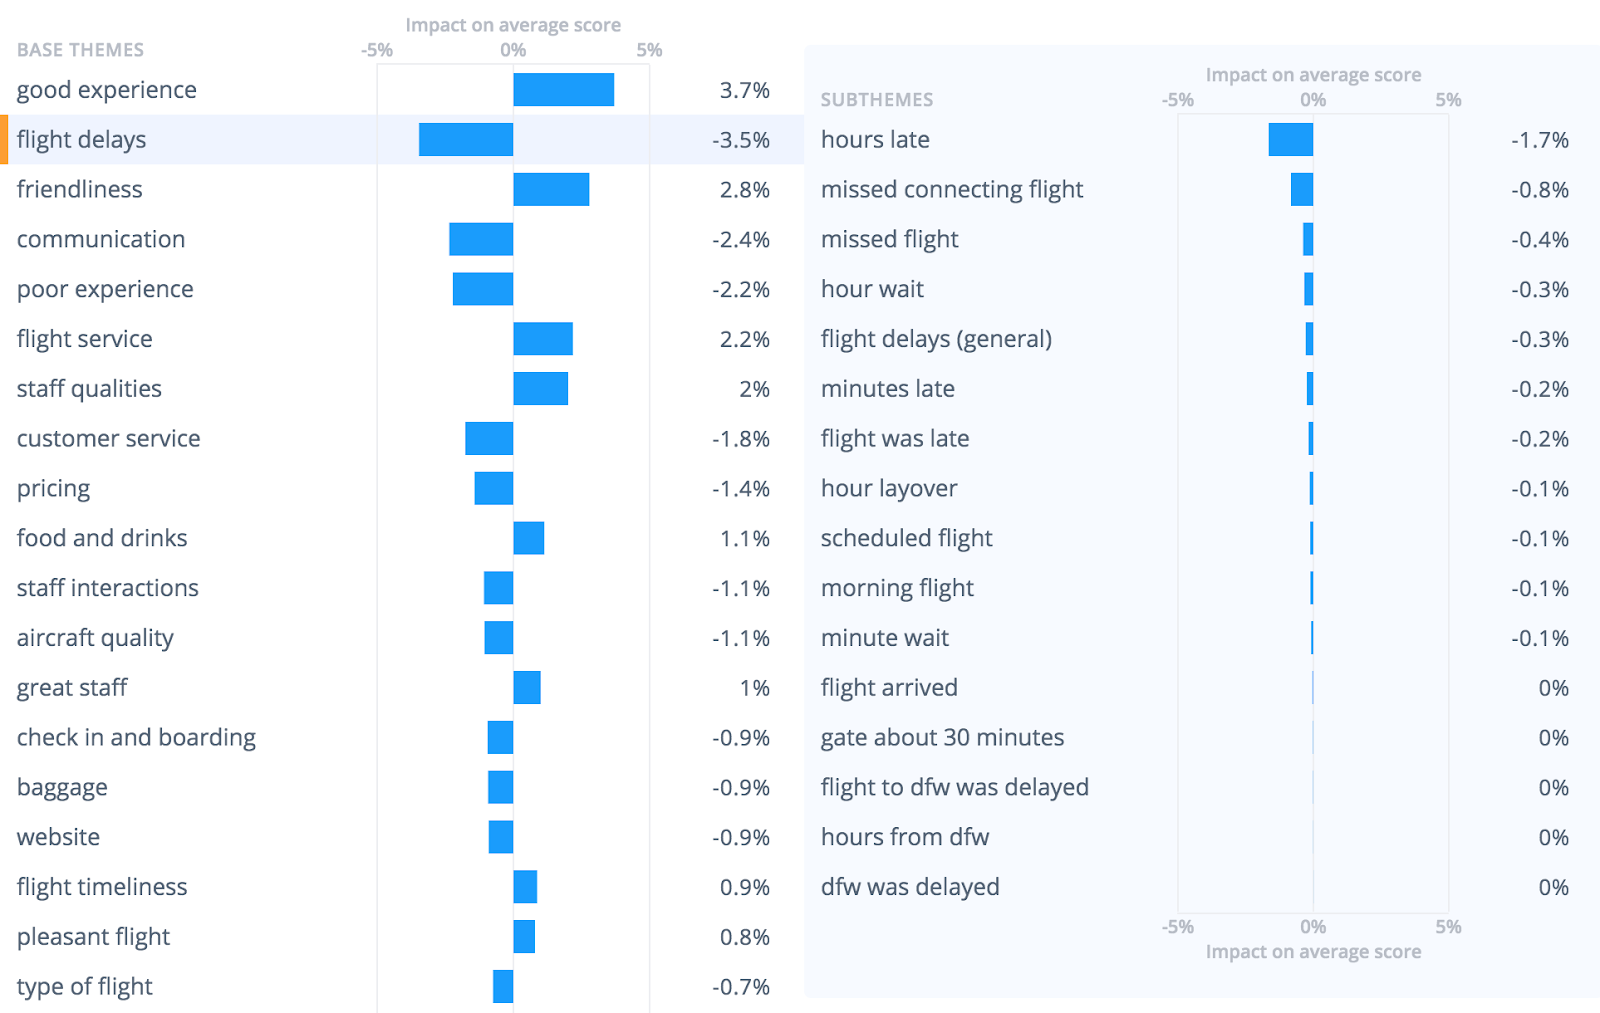
You can see as I read through the themes of our dummy Airline feedback, the issue having the most negative impact on our scores is ‘flight delays’.
Make sure to read through your sub-themes as this offers deeper insight. In the case of flight delays, we can see that the most commonly mentioned issue is that the flights were ‘hours late’.
Your feedback data will provide unique themes relevant to your business. You will likely find insights into problems you didn’t even know existed!
4. Create a list of business initiatives from the themes in your feedback
Carefully reading through your themes will inspire a range of initiatives to resolve the problems identified in your feedback.
For example, now that I know that flights being hours late is having the greatest negative impact on my scores, I can create initiatives that will resolve the issue, improve my score - and drive overall business improvement.
For this example, some initiatives could be:
- Invest in better air traffic control technology to reduce errors where airplanes have to idle before landing
- Improve check-in operations to reduce the time spent getting passengers on planes
- Change flight policy to leave late passengers behind ;)
Your initiatives will likely become more granular the deeper you dig into your data.
I’d recommend coming up with a list of 20-30 initiatives. Most of these you can put on the back burner or discard. Exploring these though allows you to get creative and understand the problem in depth.
How to prioritize your improvement initiatives
Now that you have analyzed your feedback, and have a decent list of initiatives, you can start prioritizing. How do you know which initiatives to act on, and which to discard?
Here are some methods you can use to do just that.
1. How to use Pareto analysis to prioritize your improvement initiatives
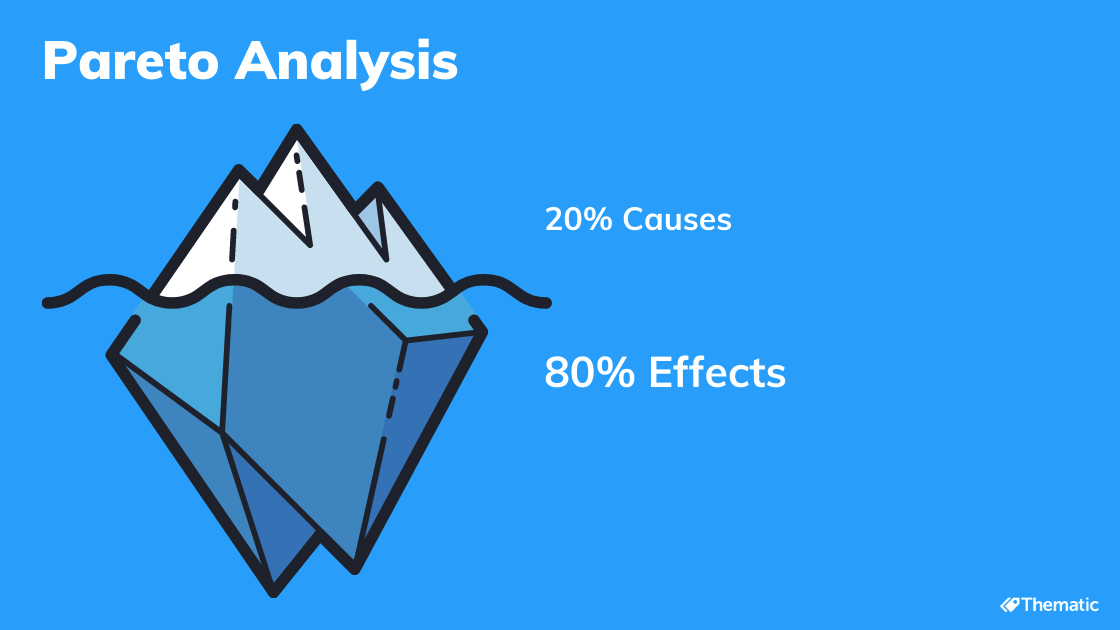
What is Pareto analysis?
Pareto analysis is a technique based on the Pareto principle, which argues that 80% of something is caused by 20% of something. So, in this context, if we resolve 20% of the issues we would see 80% gain. It’s a helpful principle for prioritizing initiatives.
Put plainly, Pareto analysis helps you identify the problem areas that will have the biggest payoff. You (the problem-solver) can estimate the benefit delivered by each initiative, and then select the initiatives that, when completed, will have the biggest impact.
Note: The 80/20 rule is a guideline and comes from Vilfredo’s Pareto’s 1896 book, ‘Cours d'économie politique’ - if you would like to learn more.
How to use Pareto analysis to prioritize your improvement initiatives
Now that you have a list of initiatives derived from your feedback, we can use the Pareto principle to prioritize them.
1. Score your initiatives based on the outcome you hope to achieve, or metric you want to see increase/decrease
For example, if you are hoping to see an increase in profit, you could score your initiatives based on the cost to act, and perceived impact on revenue-generating areas of your business. Alternatively, if you are trying to improve customer satisfaction, you could score based on the number of complaints received about each core problem.
In this example, we will be scoring our initiatives based on the frequency of complaints mentioning the core issue that the initiative solves.
You can also create your own scoring scale, 1-5, 1-10, it doesn’t matter.
Here’s an example based on some of the initiatives I came up with after analyzing our airline data in Thematic.
| Initiative | Cause | # of times subtheme mentioned in feedback |
| Invest in R&D for more effective air traffic controlling | Flight delays | 12,701 |
| More communications training for customer service staff | Poor experience with service staff over the phone | 3,451 |
| Improve website booking processes | Booking a flight | 2,998 |
| Refurbish the restrooms on the aircrafts | Old aircraft restrooms | 2,166 |
2. Group the initiatives that tackle the same core problem
This step is self-explanatory. If you have X number of initiatives that solve the same problem, group them.
As an example, at Thematic, we recently identified that our filters functionality was a core problem for users of our platform. Performing a Pareto analysis, we grouped all initiatives that make changes to this functionality under one heading.
3. Calculate the final score
The total score for each group is the sum of the individual scores of each initiative within the group.
4. Take action on the top 20% of your highest scored initiatives!
Based on the Pareto principle, prioritizing your 20% top-scored initiatives could have an impact on 80% of your reported business problems.
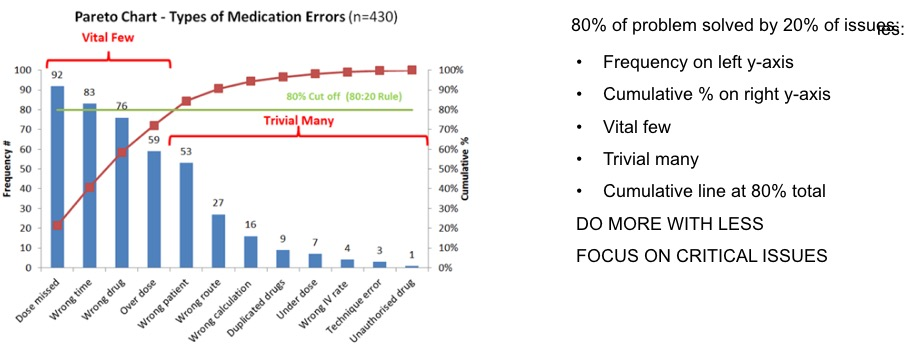
You could create a chart like this with your problems or initiatives
If the Pareto principle is too complex for you, you may appreciate our 2nd method...
2. How to use a 2x2 prioritization square to prioritize your business initiatives
This is a method frequently used by consultants. Jessica Noble CCO of Magnetic Experiences took me through the approach.
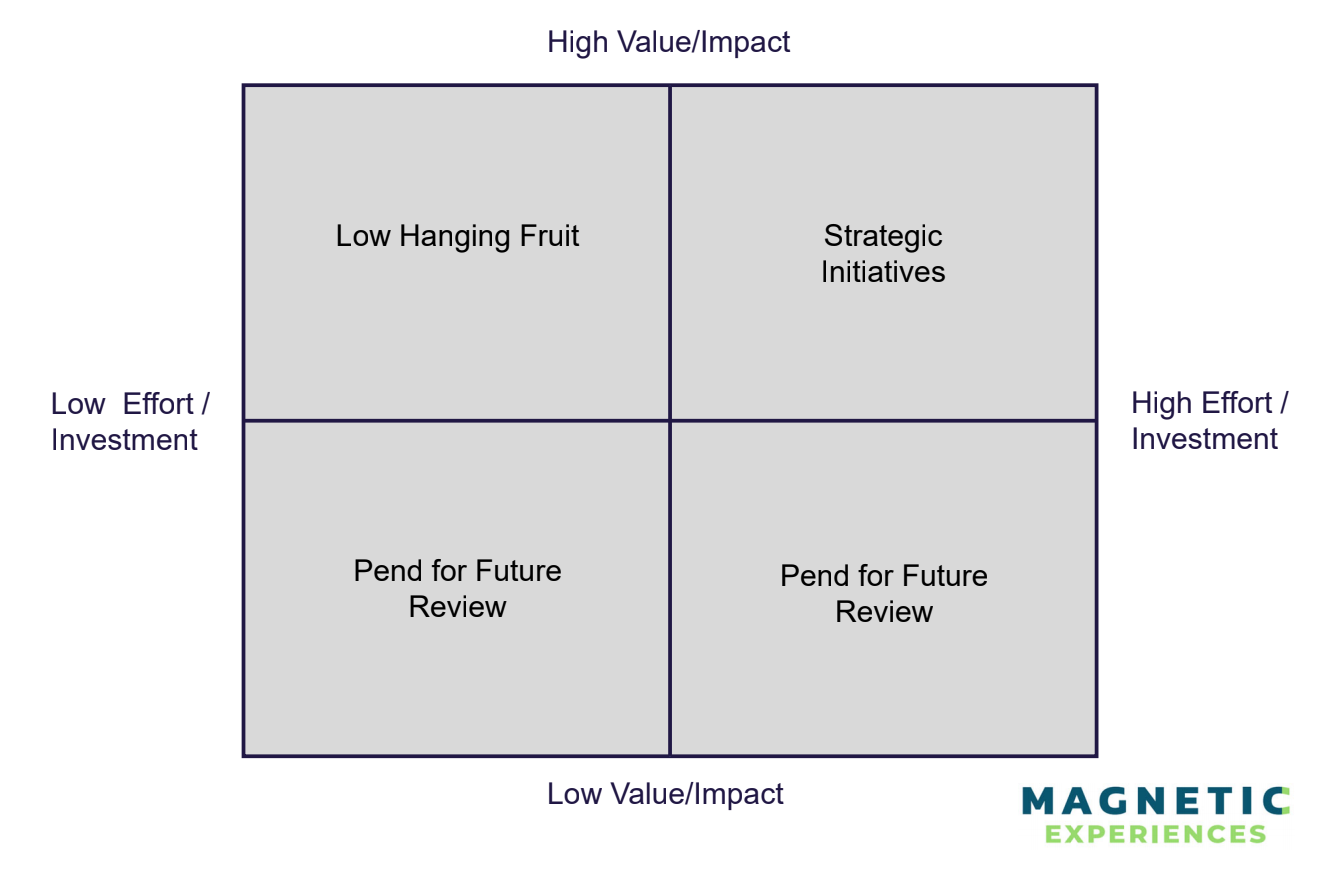
You’ll be most successful with this approach is the right stakeholders in your business provide input on the effort and impact of initiatives. So, to start, put the matrix up on a wall (or share through your screen if you’re working digitally) so that it is visible to your whole team.
Next, plot your options of initiatives on the matrix.
Once you know the impact of the initiative and the level of investment/effort required, you’ll know how to rank them.
Once you’ve deliberated over where each initiative sits on the matrix, it becomes clear which should be areas of focus, and which shouldn’t be. For simplicity, put aside all that are sitting on the lower half of the matrix. These can be re-visited in future conversations - but are not a priority today.
Next, work with the experts in your business to validate the level of effort/investment involved in each of the remaining options of initiatives.
If you have any “Low Hanging Fruit” (also known as “quick wins”), you can start getting to work on those pretty quickly.
For “Strategic Initiatives”, further exploration is typically needed. Stakeholders will need to discuss which of the initiatives best align with the company goals and other agendas already underway/approved. Make sure to ask questions:
- Will it impact another project planned within the business?
- Will it be more beneficial for cashflow?
- Will it drive acquisition or retention?
This will help you gain consensus over which initiatives to focus on first.
Not dissimilar to the Pareto principle, you typically end up with the 20% that will have the biggest impact across the business.
So, there you have it - my take on how you can discover and prioritize the right business initiatives which will drive meaningful impact across your customer and product experiences.