Switching your feedback analytics off Medallia or Qualtrics feels risky for one reason: the history. Years of themed feedback, a taxonomy your team built by hand, and trend lines your executives watch every quarter all seem to live inside the tool you want to leave. Lose those and you start over blind.
You do not have to. The way to migrate without losing your history is to treat it as a phased switch, not a rip-and-replace: export your raw data and your analytics tags, layer the new platform on top of your existing collection first, re-analyze your full history in the new tool so the trend lines stay continuous, then run both systems in parallel until the numbers reconcile. Thematic is built for exactly this path. It sits on top of Medallia, Qualtrics, and your data warehouse, imports historical feedback, and re-analyzes it under one taxonomy so your history carries forward intact.
Below is the seven-step process, a worked example, and the mistakes that cause teams to lose history they did not need to lose.
The migration in seven steps
- Time the switch to your renewal window. Start 90 to 120 days before auto-renewal so you have leverage and no gap.
- Inventory your current program before you touch anything. Every survey, dashboard, alert, integration, and text-analytics model, each with a named owner.
- Export your raw data and your analytics tags, not PDF dashboards. Tags are often not portable by default, so pull them out deliberately.
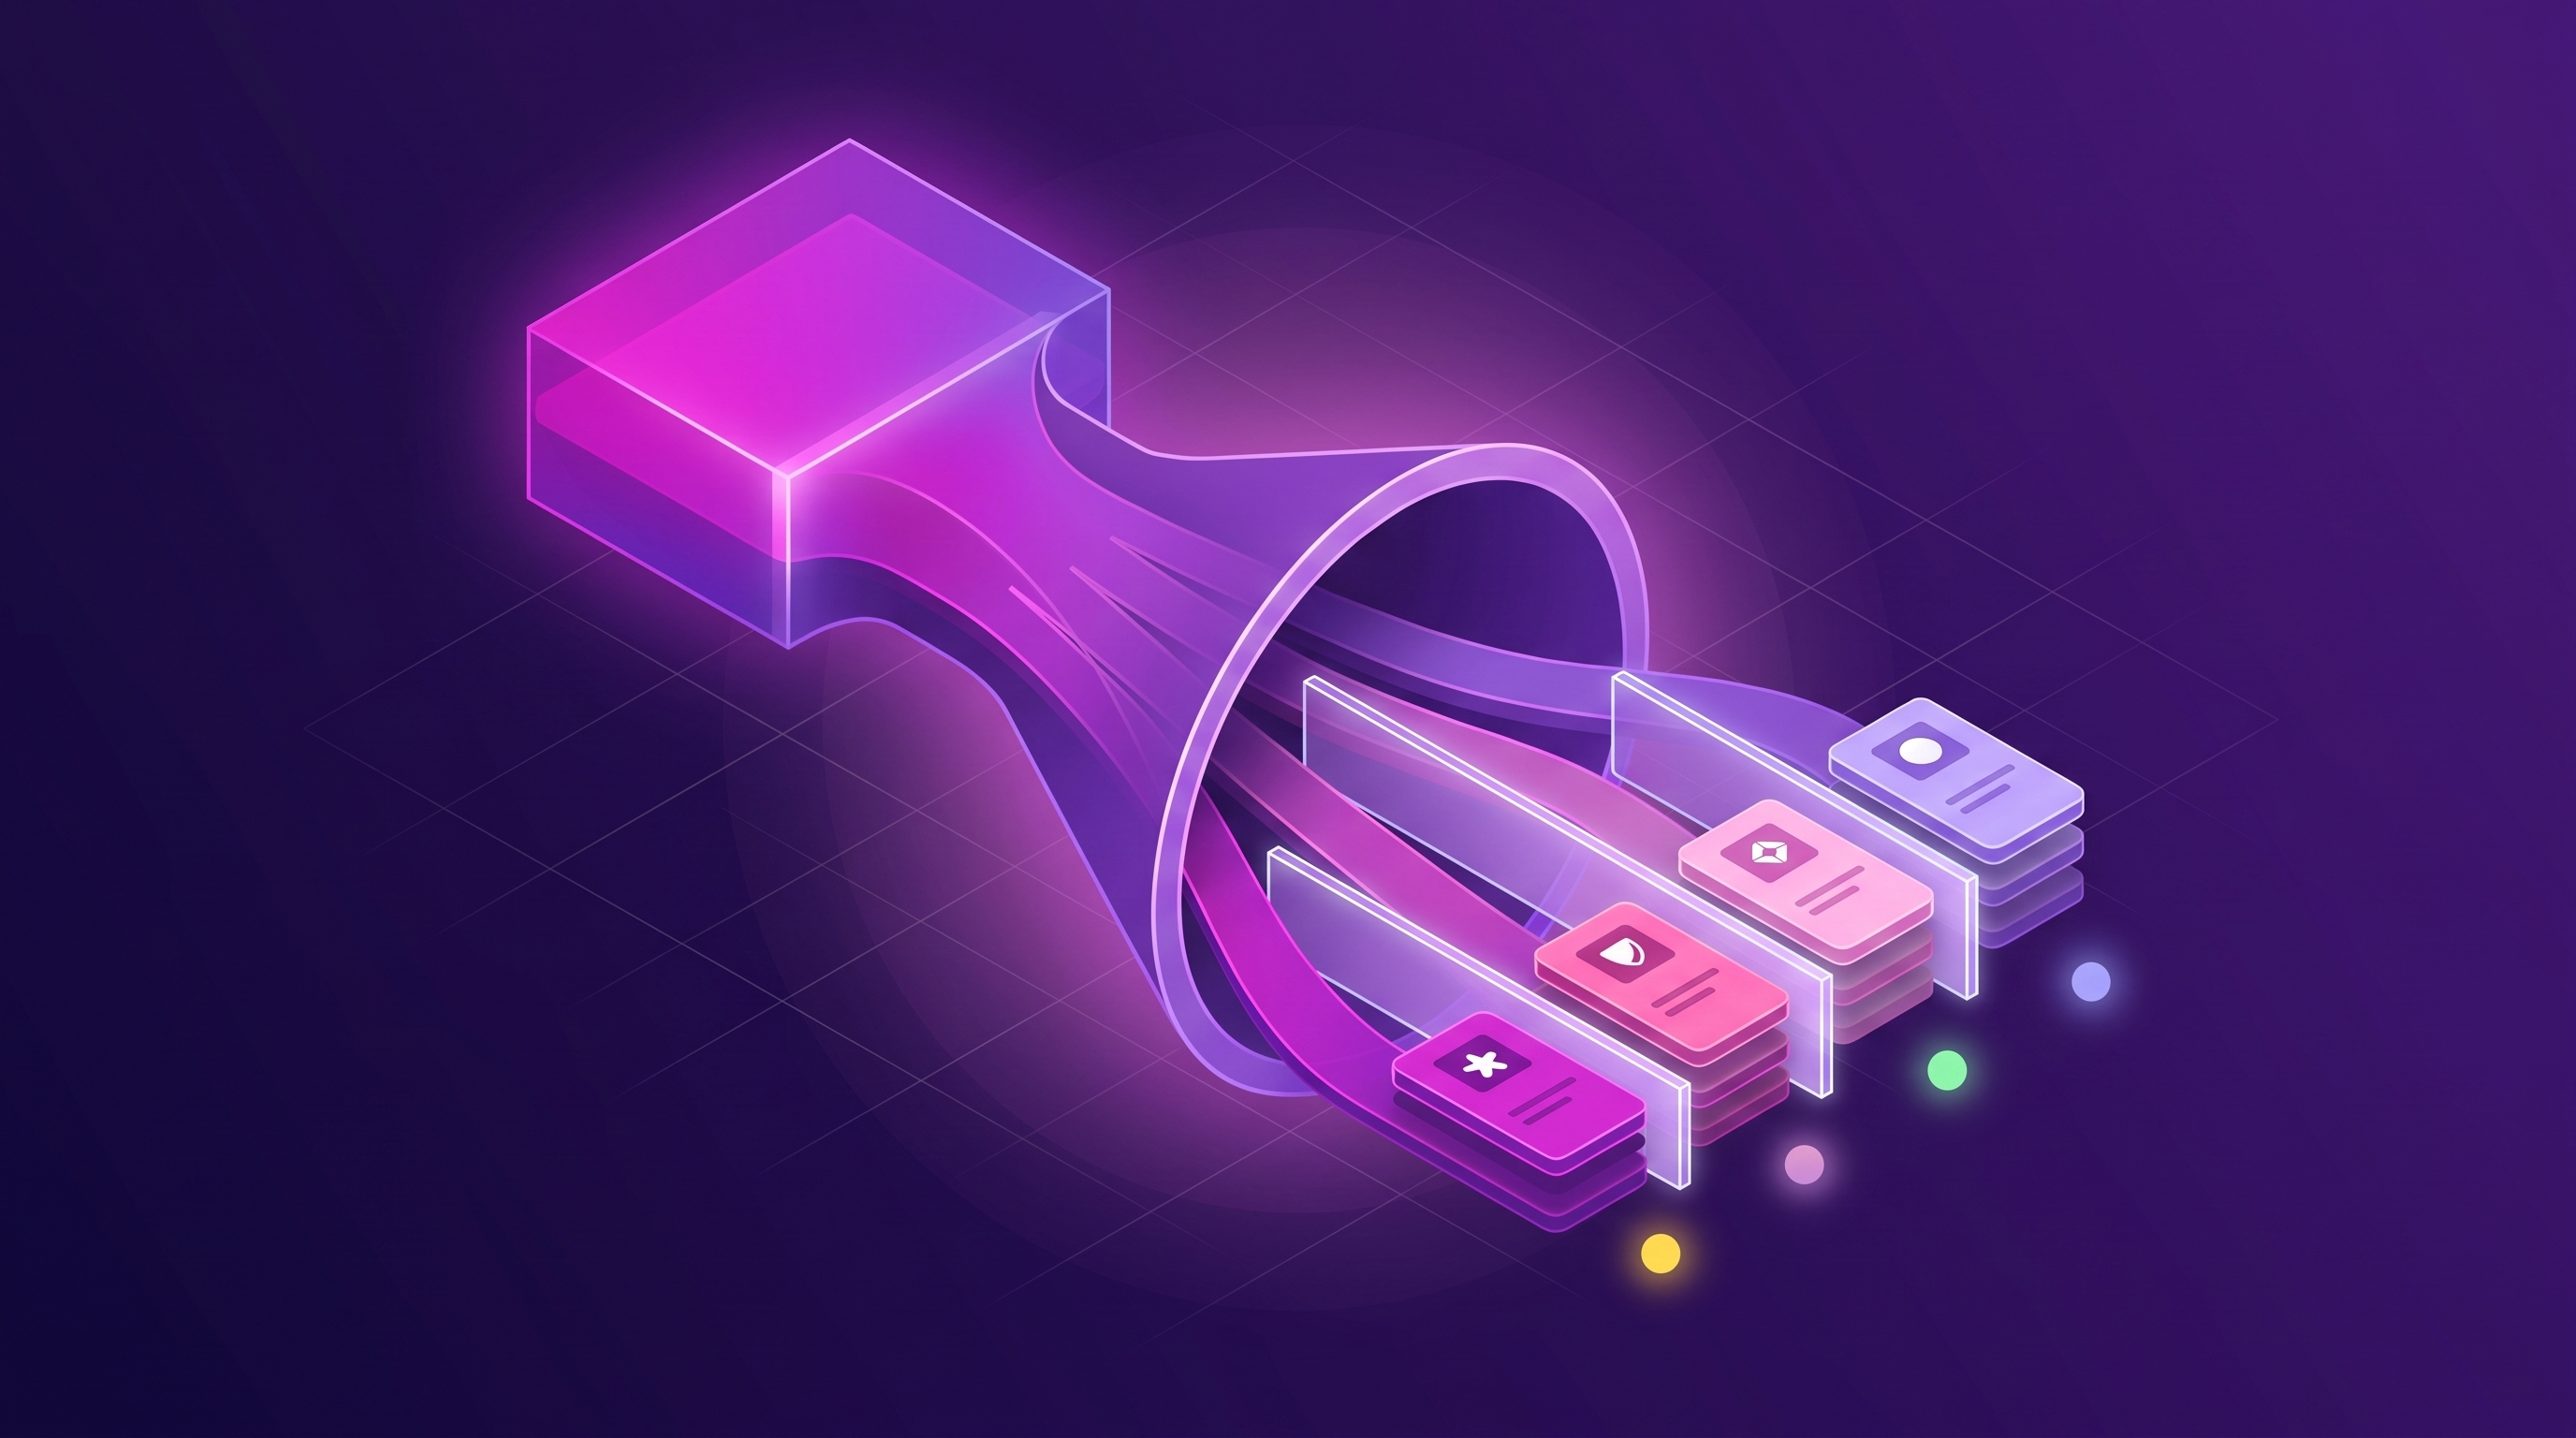
- Layer the new analytics on top of your existing collection first. Keep collecting where you collect today; switch the analysis layer.
- Re-analyze your history so the trend lines stay continuous. Import the full back catalog of feedback and re-theme it under one taxonomy.
- Run both systems in parallel and validate before cutover. Reconcile scores and theme volumes old versus new against a set threshold.
- Cut over, retire the old analytics, and bring stakeholders with you. Move reports on a schedule people know about, not overnight.
Step 1: Time the switch to your renewal window
Start the migration 90 to 120 days before your contract auto-renews. This is the window where you have both leverage and time. Leverage, because a renewal decision is the one moment the incumbent is motivated to help you export cleanly. Time, because a proper migration for an enterprise program runs weeks, not days, and you never want to be mid-cutover with the old contract already lapsed.
Use this window to confirm your exit terms in writing. Gartner has long advised organizations to negotiate data-extraction and transition rights into SaaS contracts, and to budget the full cost of leaving, including a period of running two systems in parallel. If your current contract is silent on data export, that is a finding to resolve now, not at cutover.
Step 2: Inventory your current program before you touch anything
You cannot migrate what you have not mapped. Before any data moves, build an inventory of everything your current platform does: every live survey, every dashboard, every alert rule, every downstream integration, and every text-analytics model or code-frame. Give each one a named owner.
This inventory is what protects your history. Most migrations lose data not because export is hard but because no one wrote down that a quarterly board dashboard depended on a specific theme that lived only in the old tool. The teams that switch cleanly treat the inventory as the migration's source of truth and check every item off at cutover.
Step 3: Export your raw data and your analytics tags, not PDF dashboards
Export two things: the raw feedback responses, and the analytics layer built on top of them (themes, tags, sentiment, code-frames). A PDF dashboard is a picture of your history, not your history. You cannot re-query it, and you cannot carry its trends into a new platform.
The tags matter as much as the raw text, because analytics tags are frequently not portable by default. Qualtrics' own documentation notes that Text iQ topics do not transfer during a user move: you have to export the topics first and re-import them afterward. Assume the same of any incumbent. Pull your raw responses and your tag data out in a queryable format such as CSV or JSON, so the new platform can read both.
Step 4: Layer the new analytics on top of your existing collection first
Switching your analytics platform does not require ripping out the tool you collect feedback with. In most cases you should not. The survey platform, the app-store feed, the support desk: those can stay. What you are replacing is the analytics layer that reads the feedback and turns it into themes.
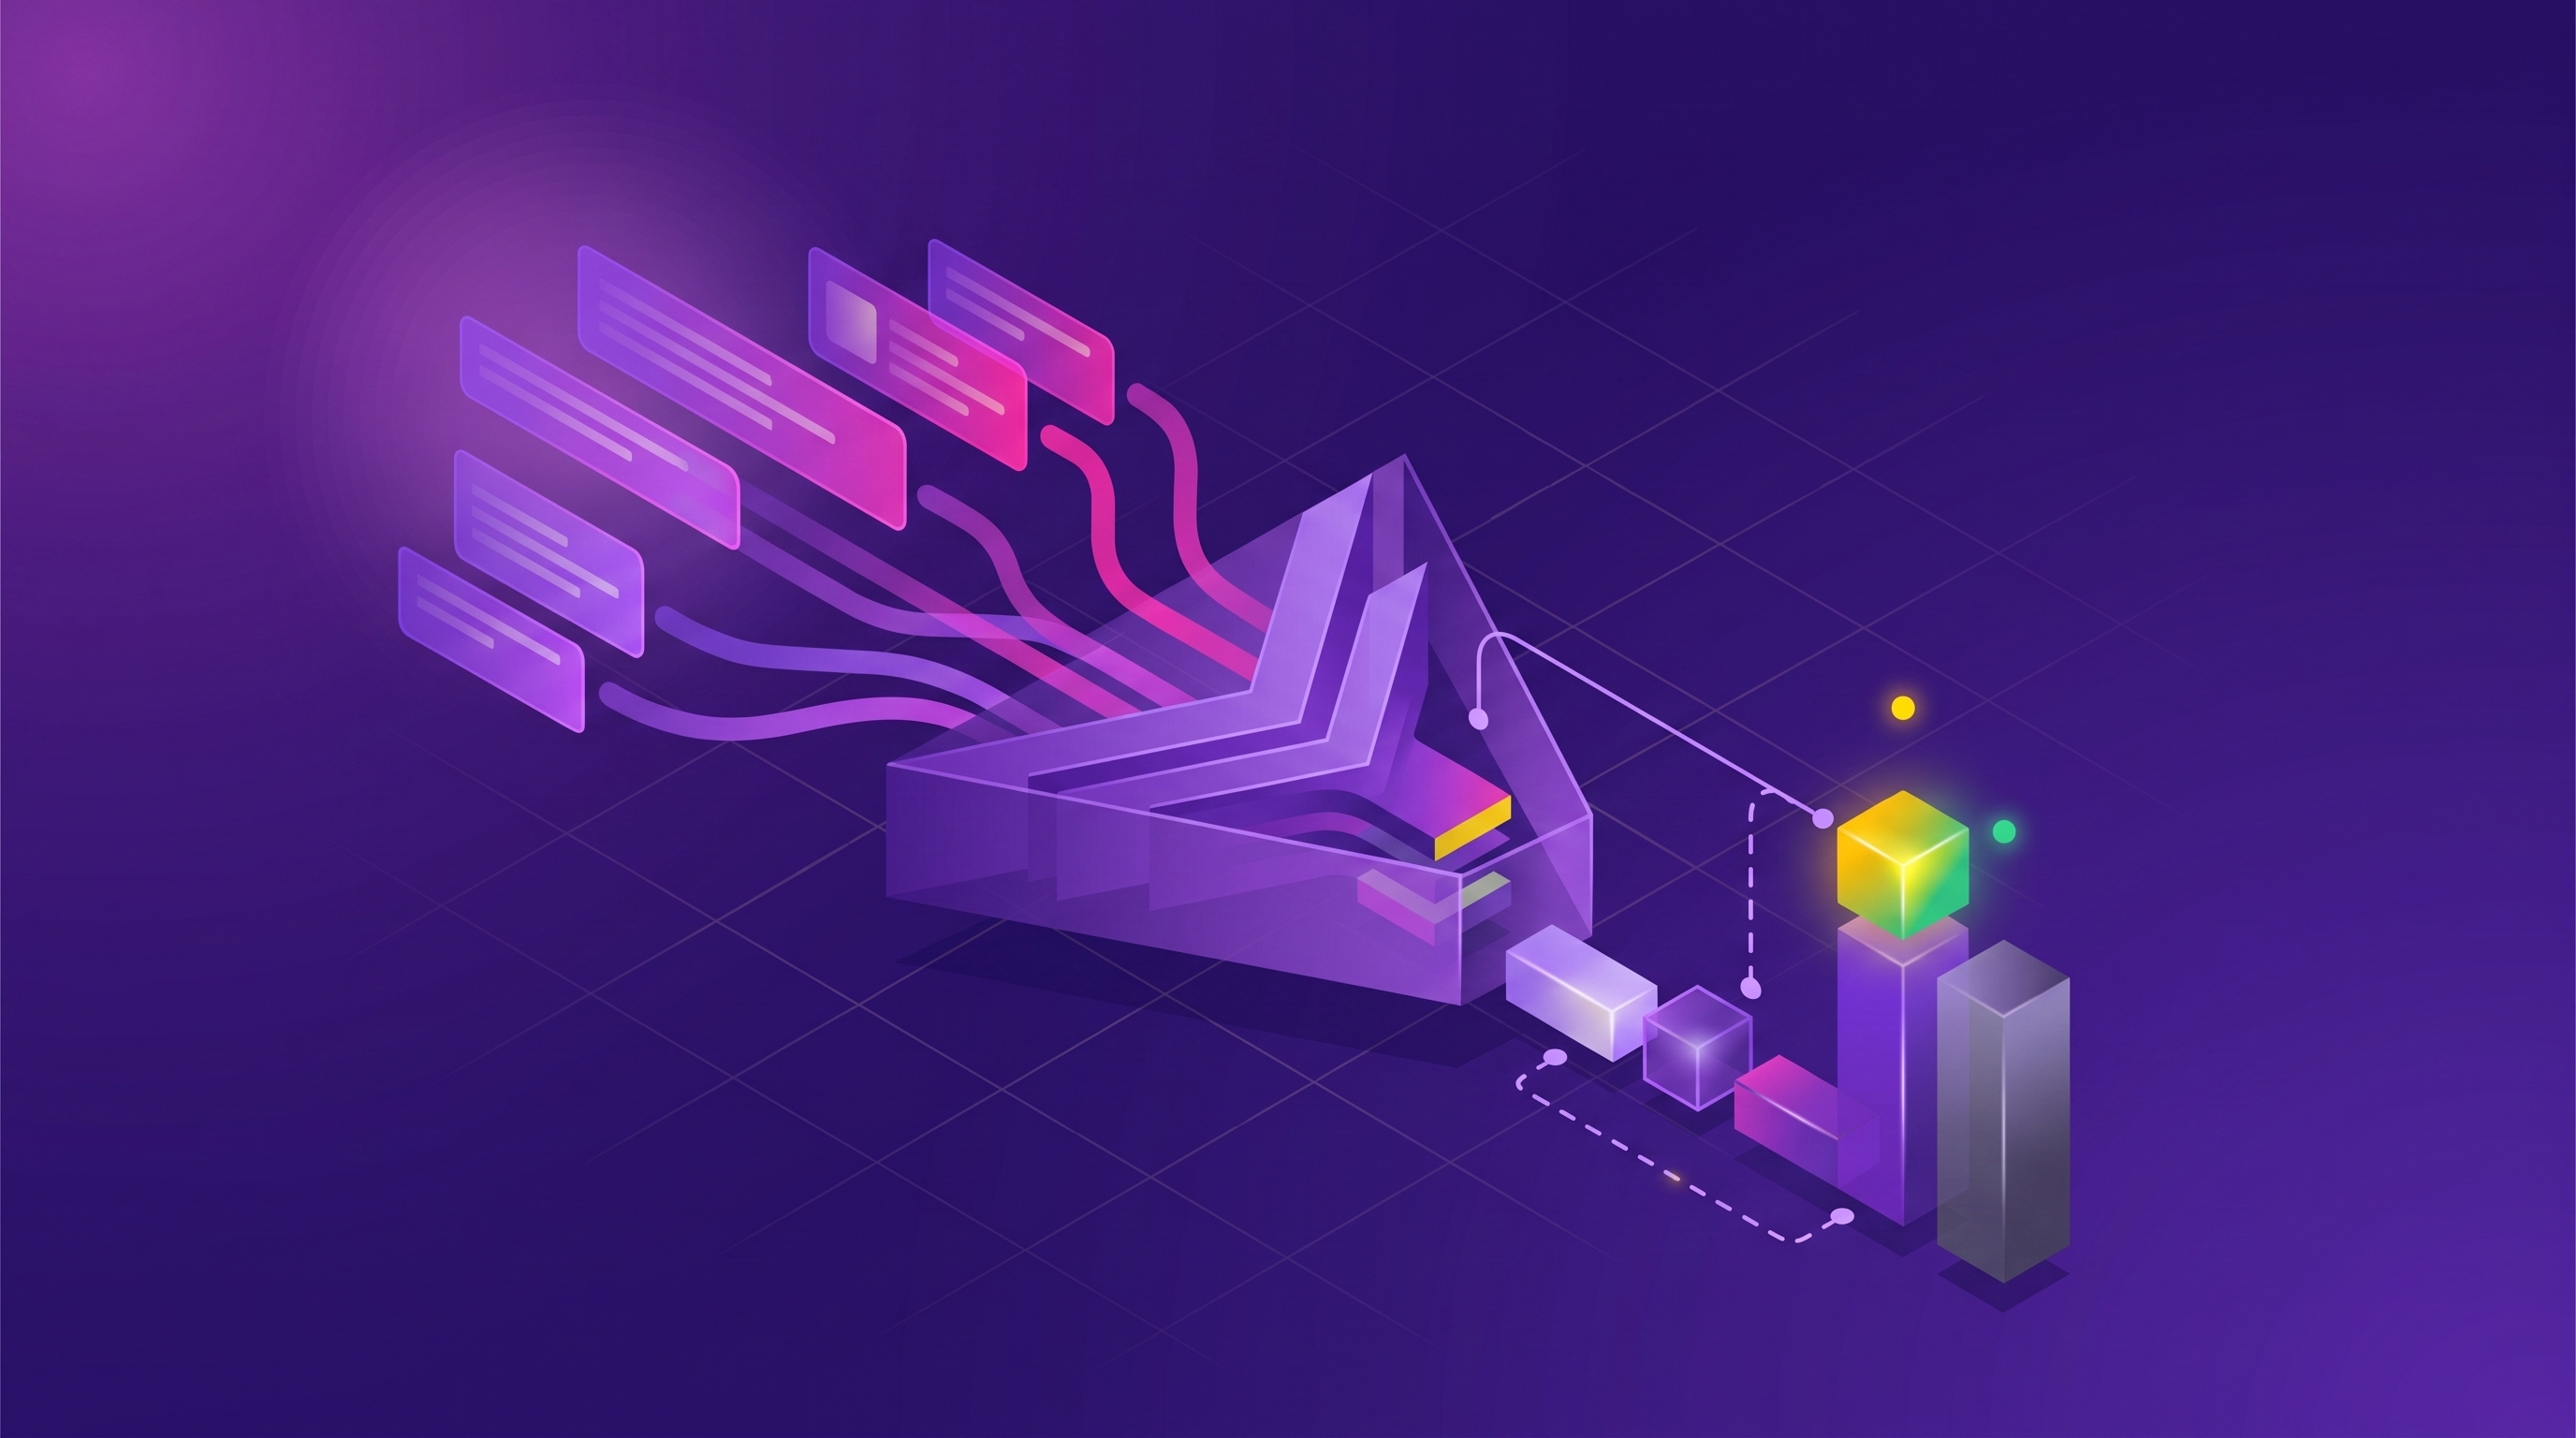
Thematic connects to Medallia, Qualtrics, and warehouses like Snowflake or BigQuery natively or through an API, and analyzes the feedback that flows through them. A New Zealand vehicle-glass repair company kept its existing Qualtrics survey collection and Power BI reporting, and layered Thematic on top to discover themes and tie them to net promoter score (NPS) impact. There was no rip-and-replace of the survey stack. Layering first also de-risks the move: you prove the new analytics on live data before you touch anything upstream.
Step 5: Re-analyze your history so the trend lines stay continuous
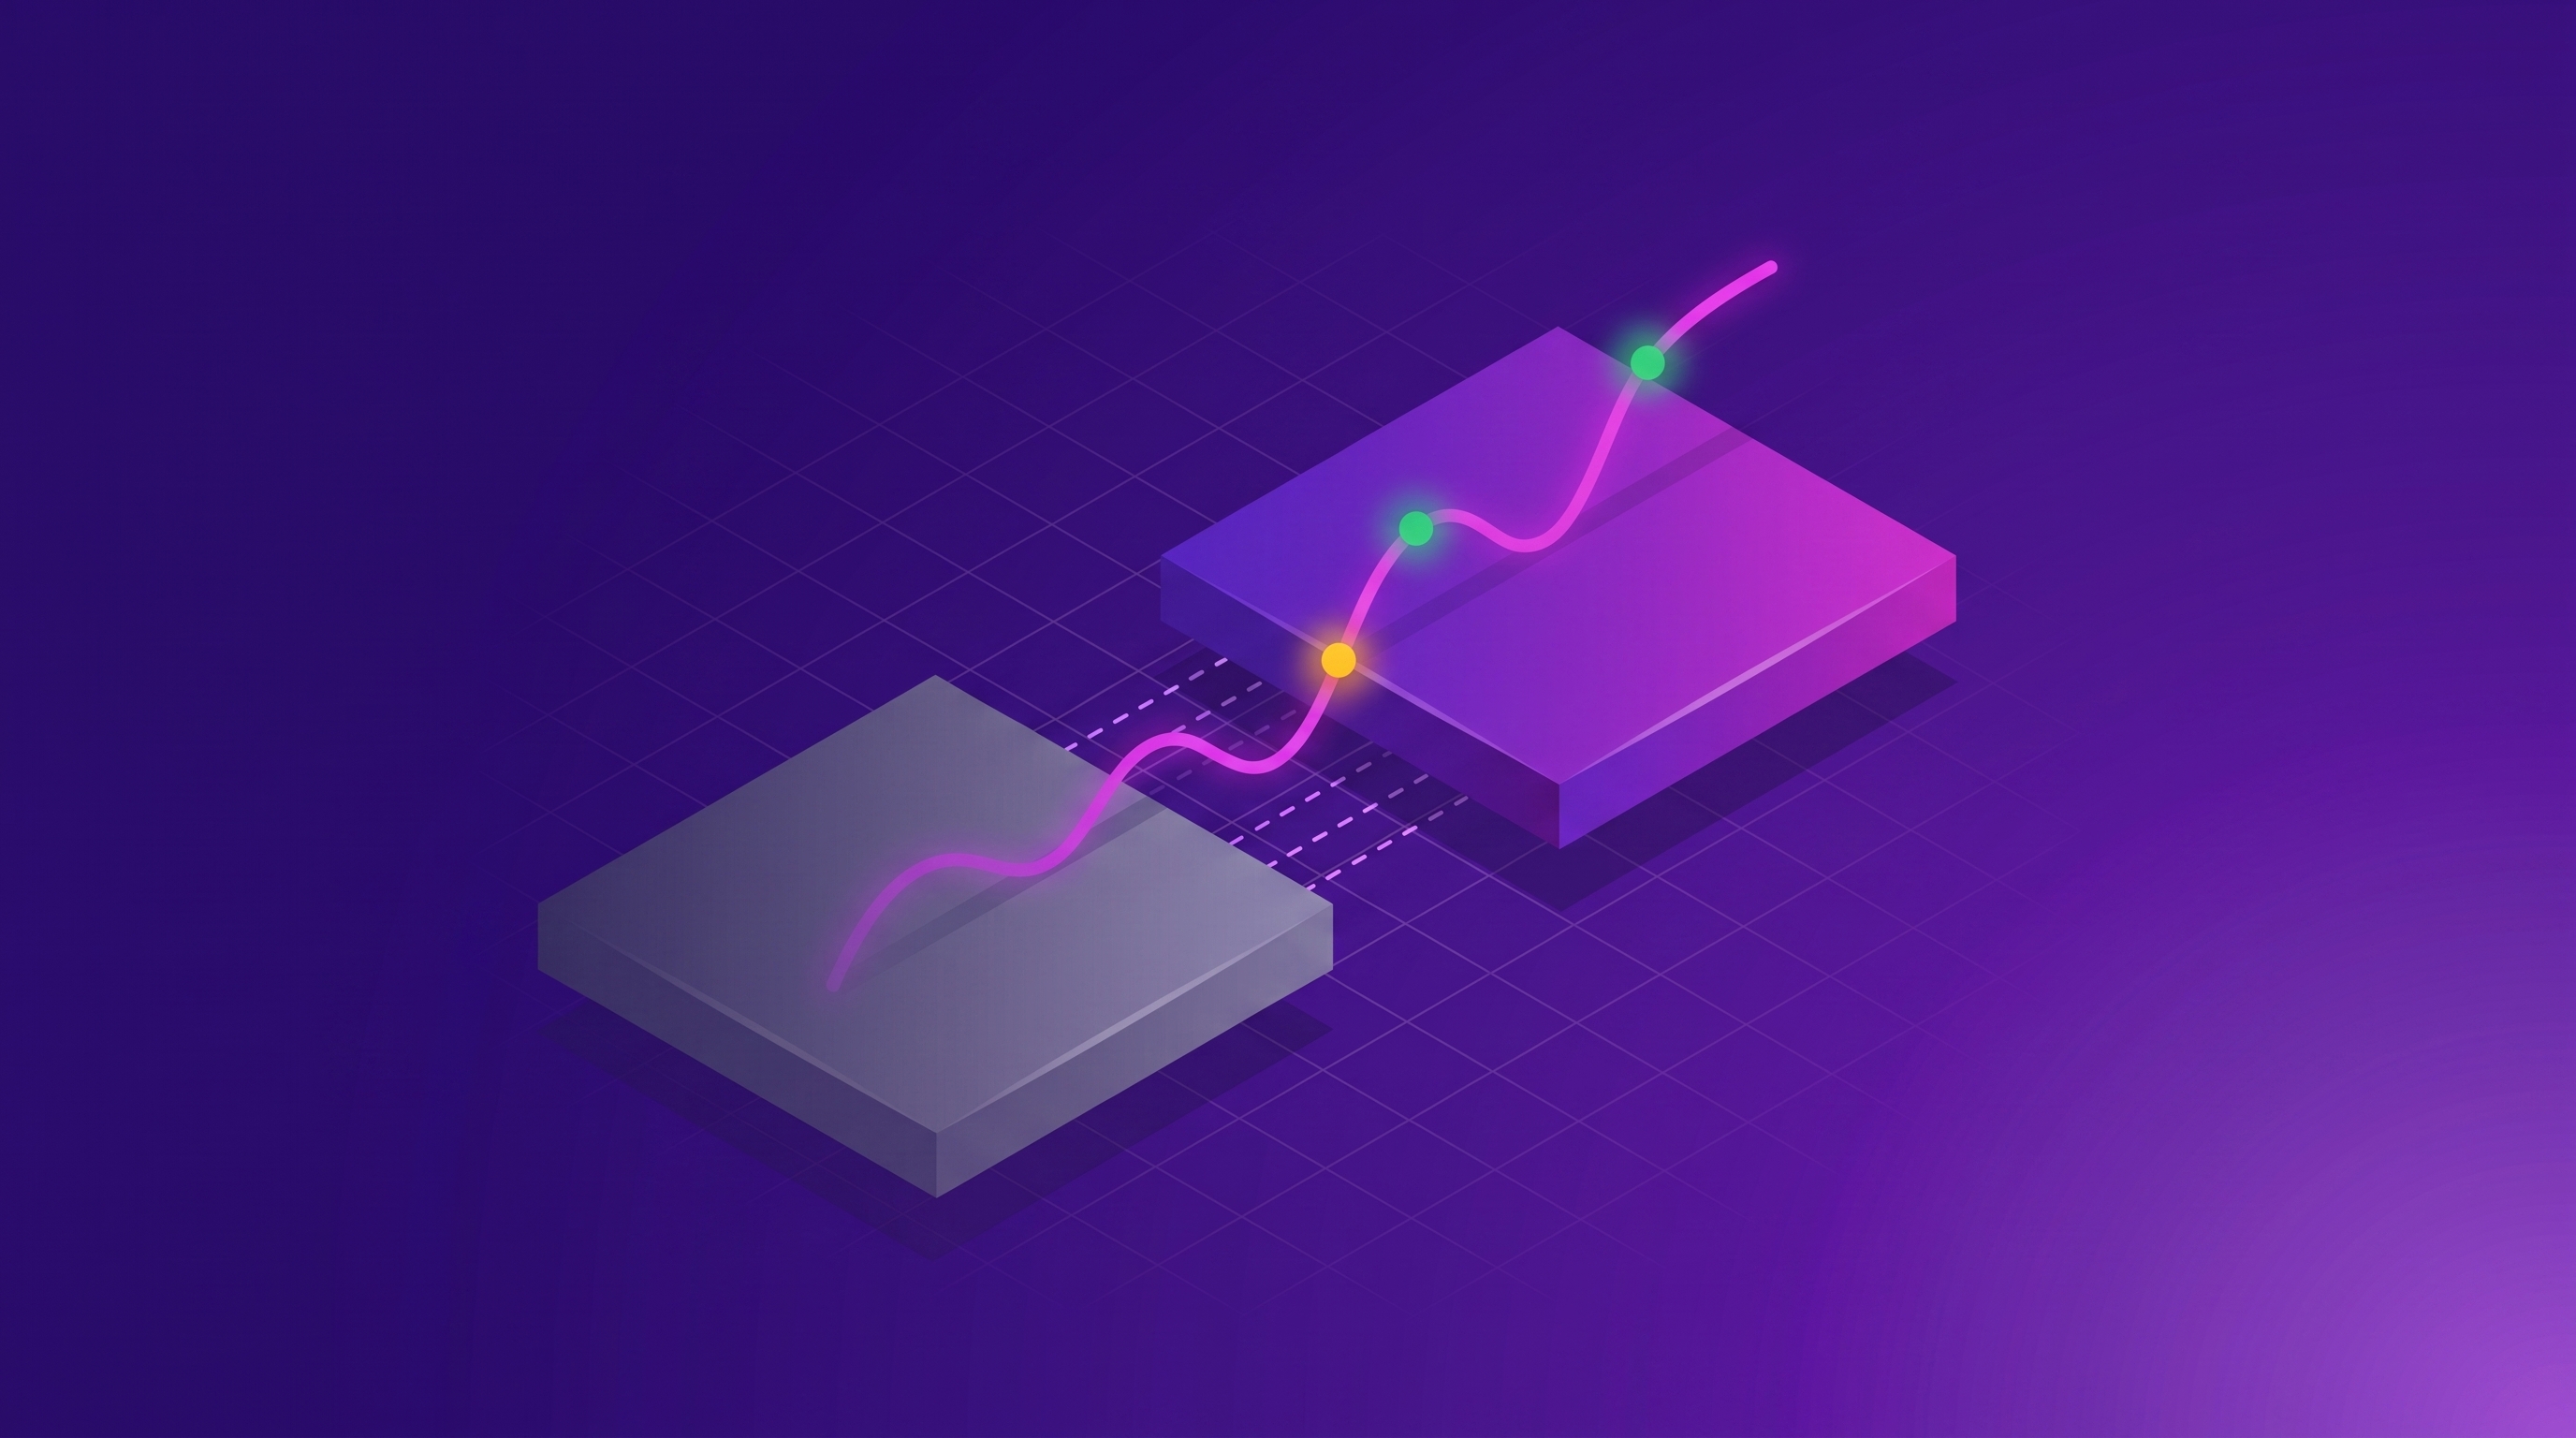
This is the step that actually preserves your history, and the one most migration guides skip. Exporting your old data keeps it. Re-analyzing it makes it usable. Import the full back catalog of feedback into the new platform and re-theme all of it under one taxonomy, so a trend line that starts three years ago continues unbroken through the cutover.
Thematic imports historical feedback and analyzes it alongside new feedback, and when a theme changes it re-analyzes all existing feedback so historical trends stay consistent and comparable. Map your old code-frames to the new themes as part of this step. The goal is that the taxonomy you spent years building is carried forward and improved, not abandoned, and that no executive opens a dashboard after cutover to find the history starts at zero.
Step 6: Run both systems in parallel and validate before cutover
Do not cut over on faith. Run the old platform and the new one side by side for a defined overlap window, feeding both the same feedback, and reconcile their output. Compare the headline scores, such as NPS or customer satisfaction (CSAT), and the volumes of your major themes, old system versus new. Set an acceptance threshold in advance and only cut over when the new platform's numbers reconcile with the old within it.
This validation step is what turns a scary switch into a defensible one. When a skeptical stakeholder asks whether the new numbers can be trusted, the answer is a reconciliation report, not a shrug. Parallel running is a recognized, budgetable part of a proper migration, not wasted overhead.
Step 7: Cut over, retire the old analytics, and bring stakeholders with you
Once the parallel period validates, cut over on a schedule everyone knows about. Migrations rarely fail on the technology. They fail when a report moves under someone without warning and trust evaporates. Announce the cutover date, show each stakeholder where their dashboard now lives, and keep the old system readable for a short grace period.
Then retire the incumbent analytics, or downgrade it to a collection-only role if you are keeping its survey capability. You are not just turning off a tool. You are moving your team onto one where the themes are theirs to edit and every conclusion traces back to the comments behind it.
A worked example
Atlassian ran into the problem this playbook solves at scale. Feedback was arriving across many channels, and manual reporting took six weeks, which is too slow to act on. The team evaluated 36 vendors before choosing Thematic, then connected its sources through an API into one shared taxonomy with deduplication, so the same theme meant the same thing across every channel. About 60,000 pieces of feedback a month flowed through that single analytics layer, and reporting that had taken six weeks moved to real time. The collection sources did not have to be torn out; the analytics layer on top of them changed.
The payoff of getting the switch right shows up in analyst time. Vodafone New Zealand moved off manual, labor-intensive categorization of its NPS verbatims and onto automated analysis in Thematic. The team saved 60 hours every month and posted a double-digit increase in transactional NPS (tNPS) over nine months once it could act on what the feedback was actually saying.
Common mistakes to avoid
- Exporting PDF dashboards instead of raw data and tags. A PDF is a snapshot, not queryable history. Pull the raw responses and the tag and theme data.
- Ripping out your collection layer when you only needed to switch analytics. Keep collecting where you collect today; replace the layer that reads and themes the feedback.
- Cutting over with no parallel-run validation. Without reconciling old and new scores and theme volumes, you have no way to prove the new numbers are right.
- Not mapping your old taxonomy. If legacy code-frames are not mapped to the new themes, your trend lines break exactly at the cutover, which is the history you were trying to protect.
- Treating it as a purely technical project. The failure mode is organizational: stakeholders blindsided by moved reports. Communicate the cutover before it happens.