How to Extract Actionable Insights From Customer Feedback (Not Just Pretty Dashboards)
You've got dashboards, themes, and data. But when everything looks important, nothing is. This framework shows you how to separate feedback noise from signal by measuring impact, not just frequency.
But when everything looks important, nothing is. How do you know which themes actually deserve your team's time and budget?
Atom Bank faced the same question. They were drowning in feedback from 7 channels across 3 product lines. App store reviews. Trustpilot surveys. Support center complaints. Salesforce call summaries. Beautiful dashboards. Plenty of themes. No clarity on what to fix first.
Then they built a system to distinguish noise from signal. What they found surprised them: some high-volume themes had zero impact on their metrics. Meanwhile, smaller themes were quietly driving real problems.
The difference? Measuring impact, not just frequency.
This is exactly what Thematic's impact analysis is designed for: separating the themes that move your metrics from the ones that just fill your dashboards.
Here's a framework for separating signal from noise in your customer feedback. By the end, you'll know exactly which 3 to 5 themes deserve action right now.
What's the difference between feedback noise and actionable insights?
Noise is high-volume feedback that doesn't move your metrics. Signal is feedback that moves your numbers, whether it shows up 50 times or 500. Thematic's impact analysis separates the two by showing exactly which themes drive your scores.
That's it. Volume versus impact.
Noise shows up frequently but doesn't affect whether customers stay, buy more, or recommend you. It fills your reports. It doesn't change your outcomes.
Signal moves your NPS, CSAT, revenue, or retention. A theme mentioned 50 times can matter more than one mentioned 500 times. Impact is what separates the two.
The trap? Treating all themes equally because they're all "customer feedback."
This happens more than you'd think. Teams spend weeks chasing high-volume themes only to discover they made no difference. Meanwhile, the themes that could have moved the needle stayed buried at the bottom of the dashboard.
Ticket Pricing dominates by volume (45%), but Driver Friendliness has 6x more impact on your score. Volume alone would have you chasing the wrong problem.
Atom Bank's Head of CX, Michael Sherwood, describes the transformation: "We are able to easily differentiate between verbatim themes that are noise (no impact to an overall metric) and those which are seriously impacting our CX metrics."
Once they could see impact, everything changed.
Think of it like medical triage. A doctor doesn't treat every symptom with equal urgency. A headache might be common. Chest pain gets immediate attention. You need the same logic for customer feedback.
A dashboard without prioritization is like a to-do list with 500 items and no way to know which ones matter.
How to identify which customer feedback actually matters
Connect themes to outcome metrics.
Not just how often something appears. How much it moves the numbers you care about.
The test for any theme: Can you quantify what happens if you fix it? If not, it might be noise. If yes, you've found signal.
A waterfall view of what's moving your NPS. Green bars lift your score, red bars drag it down. Hover on any theme to see how fixable it is.
Impact analysis quantifies how much a specific theme affects NPS, CSAT, or revenue. For example, Thematic goes beyond basic sentiment analysis to show what actually drives your scores, with transparent methodology you can trace back to specific comments.
Their "Authentication" theme appeared across customer feedback. Lots of volume. But when they analyzed impact, it showed a -10.2% effect on NPS. Significant, but broad.
So they drilled into sub-themes. "Biometrics" had a -6.3% NPS impact. Getting warmer.
Then they went one level deeper. "Face recognition not working" emerged as the specific issue. Now they had something actionable. A development team could fix that.
You go from "authentication is a problem" to "face recognition is broken." That's actionable.
LendingTree discovered something similar. They found a "Timing of Call" theme in their feedback. Leads were receiving calls outside normal hours due to time zone differences. Specific enough to act on. And tied directly to revenue.
How to prioritize feedback themes: A signal-from-noise framework
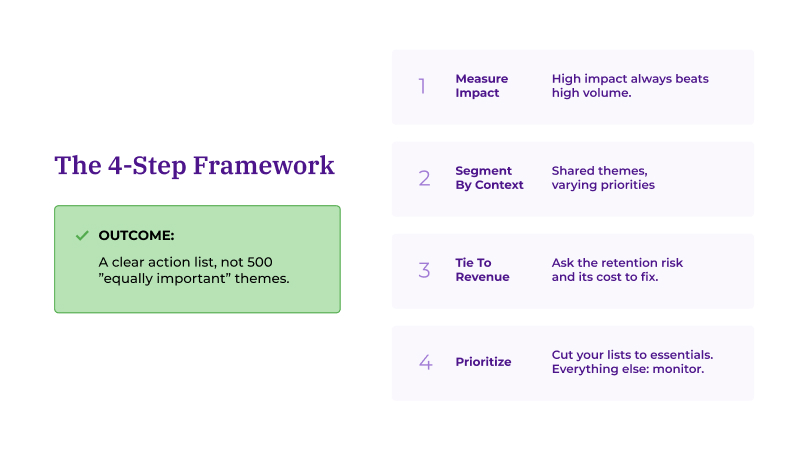
Prioritize by impact score, segment by context, connect to revenue, then cut your list to 3 to 5 themes. Everything else goes on a monitoring list.
Here's the framework in four steps.
The framework in one view. Four steps to go from 500 themes to 3-5 priorities that actually move your metrics.
Step 1: Measure impact, not just volume
High-impact themes beat high-volume themes. Every time.
Volume tells you what customers talk about. Impact tells you what changes their behavior. These are different things.
Atom Bank found themes that seemed urgent based on volume but had little effect on their Customer Goodwill Score. Meanwhile, other themes were seriously impacting their CX metrics.
A useful starting point: themes with minimal impact go on a monitoring list. Higher-impact themes become your priority zone.
The question isn't "how often do customers mention this?" The question is "what happens to our metrics when they do?"
In Thematic, you can toggle to the Impact view to see which themes affect your NPS, with the calculation already done for you.
Step 2: Segment by context
The same theme can have different priorities depending on who's affected and where.
Greyhound discovered this with their correlation analysis. They found that customers get very frustrated when waiting for a late bus in New York, but in Kansas City, people don't care as much.
Same theme: delays. Completely different priority by segment.
"That correlation piece really shows us where we need to focus our time and efforts," said Matthew Schoolfield, Senior Customer Insights Analyst at Greyhound.
Same theme, different priority. Bus delays are a crisis in New York and a non-issue in Kansas. Segmentation shows you where to focus first.
This changes resource allocation entirely. Fix delays in New York first. Kansas City can wait. Without segmentation, you might spend equally on both. That's inefficient.
Here's an illustrative example of how segmented impact data might look:
Theme
Volume
NPS Impact
Priority Segment
Bus delays
1,200 mentions
-8.1% (New York)
New York: HIGH
Bus delays
890 mentions
-1.2% (Kansas City)
Kansas City: LOW
Driver friendliness
450 mentions
-5.4% (all regions)
All regions: HIGH
Ticket pricing
780 mentions
-0.8% (all regions)
All regions: MONITOR
App usability
320 mentions
-4.7% (mobile users)
Mobile users: HIGH
Same theme, different priority. Segmentation makes that visible.
Thematic lets you filter impact analysis by any segment in your data, so you can see exactly where to focus resources first.
Step 3: Tie it to revenue
Satisfaction matters. Revenue matters more.
For each high-impact theme, ask three questions:
What's the retention risk if we don't fix this?
What's the revenue impact if we do?
What does it cost to serve customers experiencing this problem?
LendingTree ties themes directly to lender performance. When they spot an issue hurting conversions, they can quantify its impact. That makes budget conversations much easier.
Step 4: Create a prioritized action list
After this analysis, you should have 3 to 5 themes that deserve resources right now. Not 50. Not "everything is important."
Here's an illustrative example:
Before: All themes equal
After: Prioritized by impact
Authentication (500 mentions)
1. Face recognition not working (-6.3% NPS)
Biometrics (200 mentions)
2. Payment errors (-4.1% NPS)
Payment (180 mentions)
3. Login speed (-3.2% NPS)
Customer support (150 mentions)
Monitoring: Customer support (-0.4% NPS)
Billing (120 mentions)
Monitoring: Billing (-0.2% NPS)
Your criteria for the priority list:
High impact on key metrics
Relevant to your most valuable segments
Connected to measurable business outcomes
Specific enough that a team can act on it
Everything else goes on a monitoring list. Important enough to watch. Not important enough to act on today.
Ready to stop drowning in themes and start driving decisions?
This framework works. Atom Bank went from feedback chaos to a 4.8/5 Trustpilot and App Store rating. They achieved 110% growth in their customer base by focusing on what actually mattered.
Greyhound cut analysis time from weeks to 10 minutes. That's a 99.7% reduction. More importantly, they surfaced critical issues that would have stayed buried in the noise.
Or if you want to see how impact analysis works with your own data, book a demo and we'll show you which themes are actually moving your metrics.
Frequently asked questions
What if a theme is high volume but low impact?
It might still be worth monitoring. But don't prioritize resources on it.
High volume can mean customers mention it often without it affecting their overall satisfaction or behavior. They notice it. It doesn't change how they feel about you.
Keep it on your radar. But don't let it crowd out themes that actually move your scores.
How do I connect feedback themes to business metrics?
You need a platform that connects what customers say to how it affects your numbers.
Thematic's impact analysis does this automatically. It shows which themes correlate with NPS movement, CSAT changes, or other metrics you track. No manual correlation work. No spreadsheet gymnastics.
Now you see what feedback actually costs you.
How do I know if a customer feedback theme is actionable?
A theme is actionable when it meets three criteria: it has measurable impact on your metrics, it's specific enough for a team to address, and you can track whether your fix worked.
"Authentication issues" is too broad. "Face recognition not working on Android" is actionable. The difference is specificity.
Thematic's hierarchical theme structure helps here. You can drill from broad categories into specific sub-themes until you reach something a product or ops team can actually fix.
What's the difference between impact analysis and sentiment analysis?
Sentiment analysis tells you how customers feel (positive, negative, neutral). Impact analysis tells you which themes actually move your business metrics.
A theme can have negative sentiment but minimal impact on NPS. Another theme might appear less frequently but devastate your scores when it does appear.
Sentiment is surface-level. Impact analysis connects themes to outcomes like NPS, CSAT, retention, and revenue. That's what makes it actionable.
How long does it take to identify actionable insights from customer feedback?
With manual analysis, weeks. With Thematic, minutes.
Greyhound reduced their analysis time from 3-4 weeks to 10 minutes. LendingTree processes 20,000+ comments across 7 product verticals with zero setup time.
The speed difference matters because faster insights mean you can act while issues are still small.
Can I prioritize feedback themes by customer segment?
Yes. The same theme often has different impact depending on the customer segment.
Greyhound found that bus delays frustrated New York customers far more than Kansas City customers. Same issue, completely different priority by location.
Thematic lets you filter impact analysis by any segment in your data: region, product line, customer tier, or any custom field you track. This ensures you fix what matters most to your highest-value customers first.
How do you extract insights from customer feedback?
Focus on impact, not volume. Measure how each theme affects your key metrics. Segment by context to see where issues hit hardest. Tie findings to revenue. Then cut your list to 3-5 themes that deserve action now. Everything else goes on a monitoring list. You're separating signal from noise. Themes that move your numbers versus themes that just fill your dashboards. Thematic analysis by Thematic does this automatically, showing which themes actually drive your scores.
What should I look for in a customer feedback analysis tool?
Impact measurement, not just sentiment or frequency. The ability to drill into sub-themes specific enough to act on. Segmentation so you can see how the same issue plays differently across customer groups. And transparency. Can you trace insights back to the original comments? If a tool shows you what customers talk about but not what it costs you, you're still guessing. Thematic checks all four boxes.
Share
Link Copied!
Request a demo of Thematic's Customer Intelligence Platform
Thematic turns fragmented feedback into one consistent source of customer truth — so every team acts on the same customer story. Up and running in days, not quarters.
Thank you! Your submission has been received!
Oops! Something went wrong while submitting the form.