How Community Health System Brought Actionable Insights to 250 Departments in Just Three Days
A not-for-profit healthcare network serving California's central San Joaquin Valley transformed its employee engagement reporting process with Thematic, going from weeks of manual Excel work to 250 actionable department reports in a single three-day sprint.
Community Health System's Organizational Development team used Thematic to analyze open-ended employee survey responses and produce 250 one-page department reports in three days, delivering insights 3x faster and saving 160+ hours (~$10,000) per cycle.
For the first time, 100% of directors and middle managers received standardized, comment-based insights without waiting for ad-hoc meetings with the Experience team.
Community Health System, a not-for-profit healthcare network serving California's central San Joaquin Valley, runs an annual employee engagement survey, collecting rich open-ended feedback from staff across 250 departments.
The challenge: Getting insights from survey responses to leaders who can act on them faster, without weeks of manual work.
With Thematic, an AI-powered customer feedback analysis platform, the Organizational Development team transformed their reporting process. They delivered a standardized way to deliver actionable insights from open-text comments to all 250 departments in a single three-day sprint.
For the first time, leaders below VP level received a formal deliverable with details, rather than having to request an adhoc analysis of verbatim comments on demand.
This case study describes how the Community Health System team partnered with Thematic to build a scalable employee insights process.
The organization runs a recurring employee engagement survey with two open-ended questions: "What do you like about working for Community?" and "What gets in the way of your team's success?"
Getting those insights to leaders was the problem.
Previously, their Organizational Development team exported survey data into Excel and shared results through one-on-one meetings. If a director wanted to know what their staff were saying, they had to book time with the Experience team, wait for materials to be prepared, and walk through comments live on a call.
There was no standardized deliverable that anyone who manages a team can access. Access to comments was largely limited to VPs. Directors and middle managers depended on ad-hoc conversations to understand what was happening in their teams.
At 250 departments and roughly an hour of preparation per department, the team faced weeks of rolling work after every survey, representing over 250 hours and approximately $15,000 in staff time per cycle.*
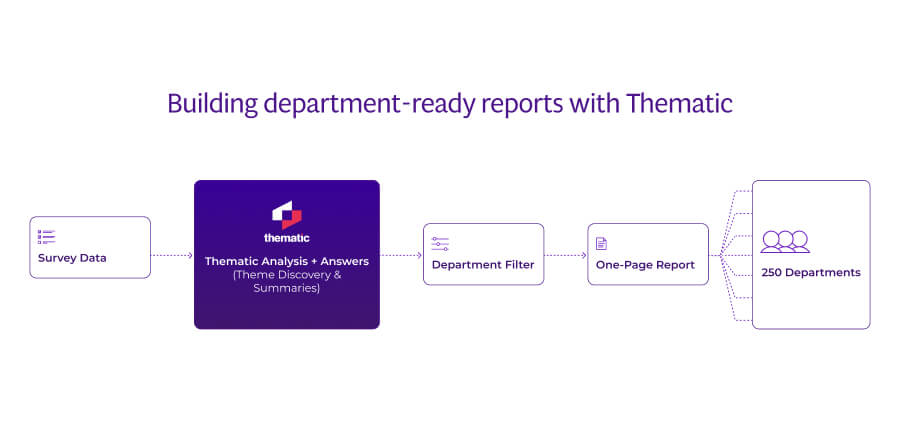
Building department-ready reports with Thematic
With their latest survey, the organization set three goals:
1. Make comment-based insights available to every department at once
2. Give leaders something they could immediately act on
3. Reduce the weeks of manual preparation that followed each survey
To transform how they analyze and report on qualitative feedback, the Organizational Development team turned to Thematic, an AI-powered feedback analytics platform for enterprises.
Thematic's analysis and Answers feature sits at the center of the workflow, turning raw survey data into standardized one-page reports for all 250 departments.
The data was exported from the PG Forsta survey platform. All survey comments, along with rating scores for different parts of employee experience (e.g. benefits, support), and contextual data (department level metadata, director/VP/C-level) into Thematic as a combined dataset. Using Thematic's Answers and dashboard features, they designed a one-page report using Canva for every department with survey responses.
Each one-pager included a summary of what people liked, a summary of obstacles to team success, and five recommended next steps generated by Thematic's Answers feature.
"The only reason we built these single-page reports is because we had Thematic. Before, we were doing everything in an Excel spreadsheet and just generating information and having conversations with people in real time." — Alexandra Clifton, Organizational Development Partner, Community Health System
A reusable workflow that scales to 250 departments
To cover all of the departments without burning out the team, they needed a repeatable process.
They built a single dashboard template in Thematic with the same layout for every department: summaries for Likes and Obstacles, plus a section with recommended actions. No clicking in and out of different views. They applied a department filter, used the same structure, and copied outputs into their Canva template.
Thematic's Answers feature generated the summaries and the five next steps per department. To keep recommendations realistic, the team used prompts like: "What are the five next steps based on the obstacles question for this department, excluding pay, staffing, and benefits?"
They excluded those factors deliberately. Middle managers cannot control pay or benefits. The focus was on actions leaders could actually take: improving communication, addressing local processes, and resolving team-level friction.
Using Hotspots for deeper follow-up
The team also created a "Hotspots" view in Thematic: a curated set of themes tagged as especially important or problematic. They set up a Hotspots view that focuses only on comments mapped to those themes, so they can quickly see which issues are most critical in each area.
This supports preparation for follow-up conversations with leaders, beyond what fits onto the one-pagers.
Human + AI: Accelerating work while keeping judgment at the center
Thematic handled the heavy lifting: clustering comments into themes, generating summaries, and proposing department-specific next steps. The Organizational Development team handled judgment calls.
They replaced recommendations for actions that no longer made sense given system-wide changes, like bringing back a supervisor role that had just been phased out.
AI and human collaboration made the work possible. Thematic created the speed and structure. The team applied context and ensured the outputs fit the organization's reality.
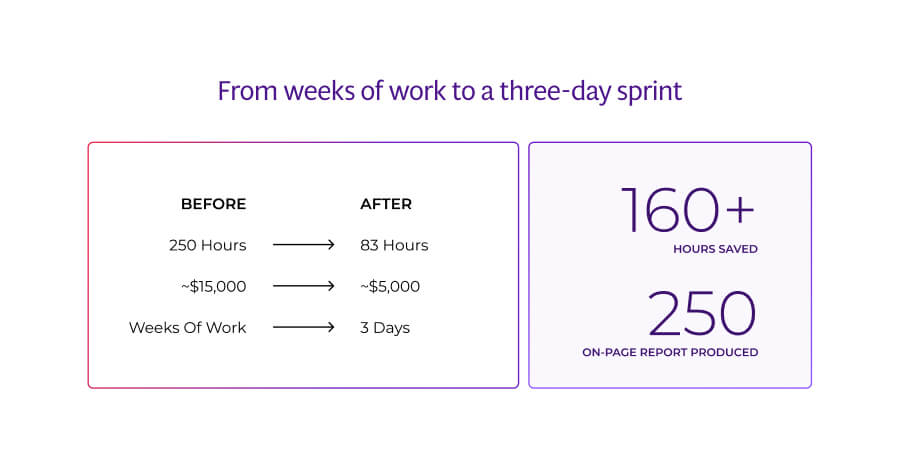
From weeks of work to a three-day sprint
The impact on time was dramatic.
Before Thematic, with Excel and one-on-one meetings, the team spent approximately one hour per department to prepare and walk through results. At 250 departments, that represented roughly 250 hours of work spread over weeks, or approximately $15,000 in staff time per survey cycle.
With Thematic, what once took weeks of manual work became a three-day sprint — cutting analysis time by 67% and costs by two-thirds.
With Thematic and standardized one-pagers, the effort dropped to approximately 20 minutes per department, even including human review and edits. The work was front-loaded into a single three-day sprint, during which the team produced one-page reports for all 250 departments.
The time savings translate to roughly $10,000 per cycle, or $20,000 annually given the organization's twice-yearly reporting cadence.
"We were able to reach 250 departments. Yes, it was a lot of work, but it was all front-loaded to a single three days and everyone was able to get their results level-set at the same time." — Alexandra Clifton
Making comment access equitable across the organization
The biggest win was not speed. It was access.
For the first time, leaders below VP received structured, comment-based insights. Directors got a formal, standardized deliverable at the same time instead of an ad-hoc conversation or a spreadsheet.
"We can officially finally say that there's a deliverable with comments that says everyone had access to these three things with comments, director and above, which has never existed before." — Alexandra Clifton
Each leader now receives what people liked in their department, the key obstacles their teams face, and a personalized action plan with five next steps. No live meeting needed to get started.
The organization still wants leaders to meet with the Experience team. But now those calls can focus on interpretation and prioritization, not basic reporting. A 30-minute director call can be spent filtering and exploring in Thematic, using Hotspots and theme filters, instead of building understanding from scratch.
A new cadence: Twice-yearly, scalable insight
The organization sees this as a prototype for a new way of working, not a one-time effort.
Going forward, they plan to run this reporting process twice a year, each time survey results come in. They are moving to a six-month cadence, alternating between this core survey on likes and obstacles, safety-focused surveys, leadership-focused surveys, and separate surveys for pay, staffing, and benefits. This will combat survey fatigue and make sure employee experience is addressed as a separate focus of improvement.
Thematic becomes the backbone: a way to repeat the process consistently, avoid reinventing dashboards and workflows, and deepen analysis over time.
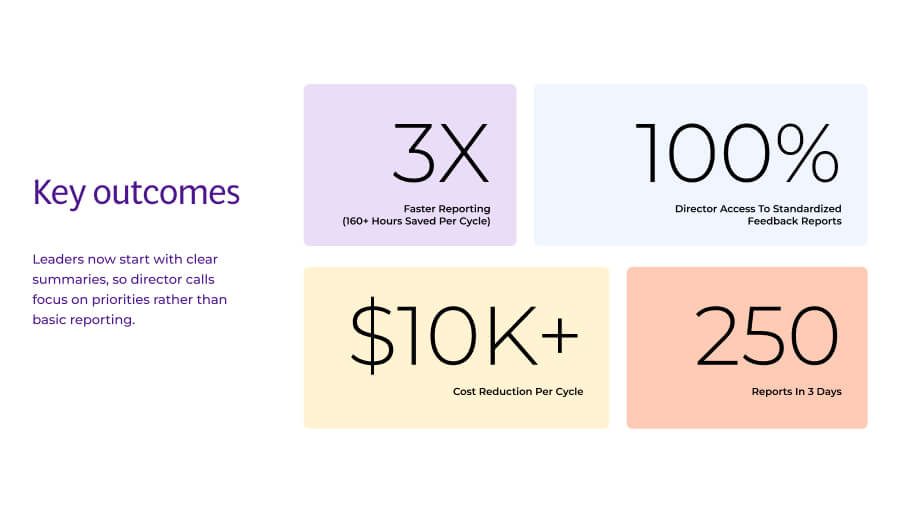
Key outcomes
The results speak for themselves: faster reporting, lower costs, and every director finally working from the same page.
250 reports in 3 days: Every department received a standardized, one-page insight report in a single sprint, replacing weeks of rolling work.
3x faster reporting (160+ hours saved per cycle): Preparation dropped from ~1 hour to ~20 minutes per department, saving over 160 hours per survey cycle.
$10K+ cost reduction per cycle (~$20K annually): With a twice-yearly cadence, the time savings translate to over $20,000 in annual cost reduction.*
100% director access to standardized feedback reports: For the first time, leaders below VP received formal, comment-based deliverables. No ad-hoc meetings required.
Directors now start with clear summaries, so follow-up calls focus on priorities rather than basic reporting. The organization plans to expand this approach to other survey areas twice yearly.
*Cost savings calculated using a fully-loaded hourly rate of $61, based on U.S. Bureau of Labor Statistics data for healthcare HR specialists plus standard benefits loading (35%).
Share
Link Copied!
Request a demo of Thematic's Customer Intelligence Platform
Thematic turns fragmented feedback into one consistent source of customer truth — so every team acts on the same customer story. Up and running in days, not quarters.
Thank you! Your submission has been received!
Oops! Something went wrong while submitting the form.