When feedback volume exceeds manual capacity, critical patterns get missed. Learn how AI-powered analysis like what Thematic does processes thousands of comments in minutes while surfacing the themes that actually move your metrics.
When feedback exceeds manual capacity, teams sample instead of analyzing everything, data becomes 3-4 weeks old before anyone acts, and the same issue gets split across disconnected categories.
AI-powered platforms like Thematic understand meaning (not just keywords), discover themes automatically without predefined categories, and achieve 80%+ sentiment accuracy out of the box.
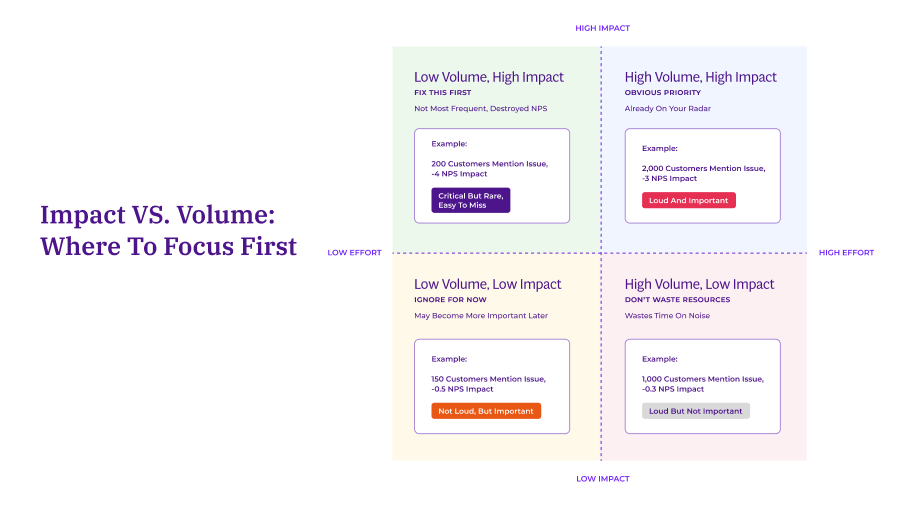
Prioritize by impact on NPS, not mention volume. A theme affecting 200 customers could hurt loyalty more than one mentioned by 1,000.
Consider AI analysis at 2,000+ comments/month, or when you're sampling, insights arrive too late, or analysts are bottlenecked.
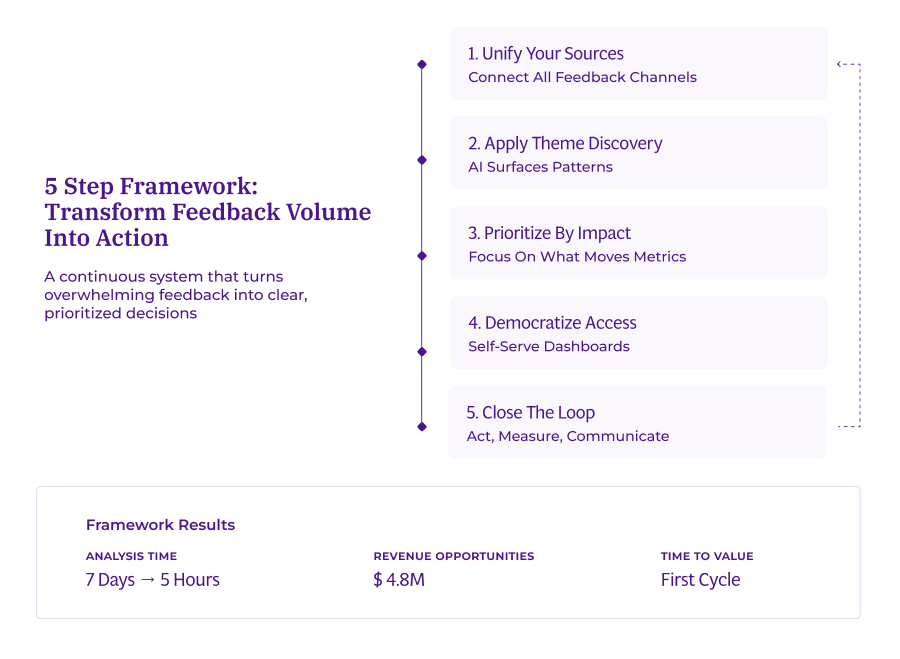
5-step framework: Unify sources → Apply AI theme discovery → Prioritize by impact → Democratize access → Close the loop.
You're collecting more customer feedback than ever. Surveys, reviews, support tickets, social mentions. It's all there, waiting to tell you what customers really think.
But here's the challenge: the more feedback you collect, the harder it becomes to actually use it.
This creates a frustrating paradox where having more customer input actually makes you less informed.
Greyhound faced the same challenge. Station managers were acting on customer data that was 3 to 4 weeks old by the time it reached them.
They cut their analysis time tenfold, from days to just minutes, using Thematic to analyze customer feedback at scale.
The difference wasn't working harder. It was changing how they approached volume.
In this guide, we’ll discuss how to turn feedback volume from a burden into your biggest advantage.
You'll learn:
How to analyze the full dataset instead of samples,
Spot issues in minutes instead of weeks, and
Prioritize fixes that actually move your satisfaction scores.
Let's start with what happens when traditional methods hit their breaking point.
What happens when you have too much customer feedback to analyze?
When feedback exceeds manual capacity, teams resort to sampling and miss critical patterns, data becomes stale before anyone can act, and tools fragment your understanding across disconnected categories.
Here's what that breaking point looks like in practice.
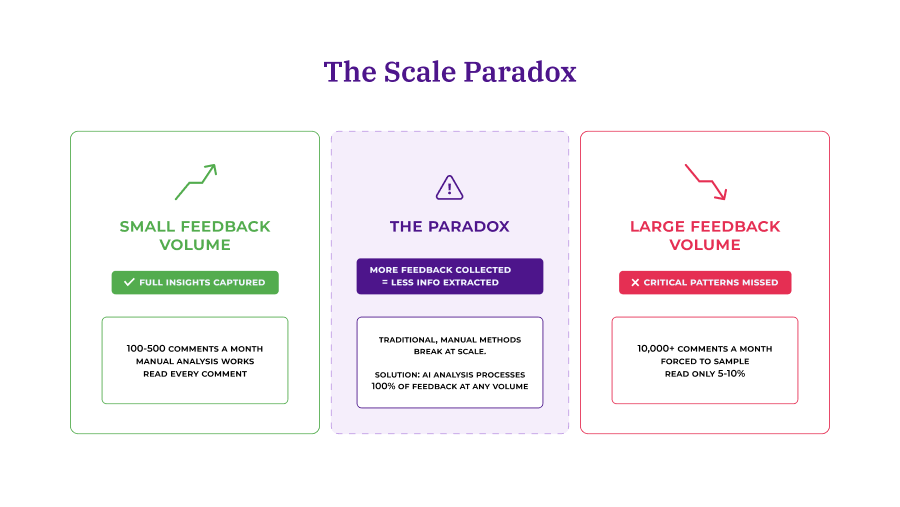
Manual coding works perfectly for 100 comments. You can read each one thoughtfully, identify themes, and track patterns in a spreadsheet.
However, when you're dealing with 10,000 comments, that same approach becomes impossible.
No analyst can read and categorize that volume while maintaining quality and speed.
Most teams respond by sampling, reading a subset of comments and assume they represent the whole dataset.
It's a practical response to limited time, but it comes with real risks.
It creates what we call the Scale Paradox: more feedback actually makes you less informed.
1. Teams resort to sampling and miss critical patterns
When you're forced to sample, you lose sight of rare but important patterns. It's not a failure on your part, but a fundamental limitation of the approach, not your effort.
Sampling seems like the efficient choice when you're overwhelmed.
You're making the best use of limited time.
The challenge is that sampling forces you to make business decisions based on incomplete information.
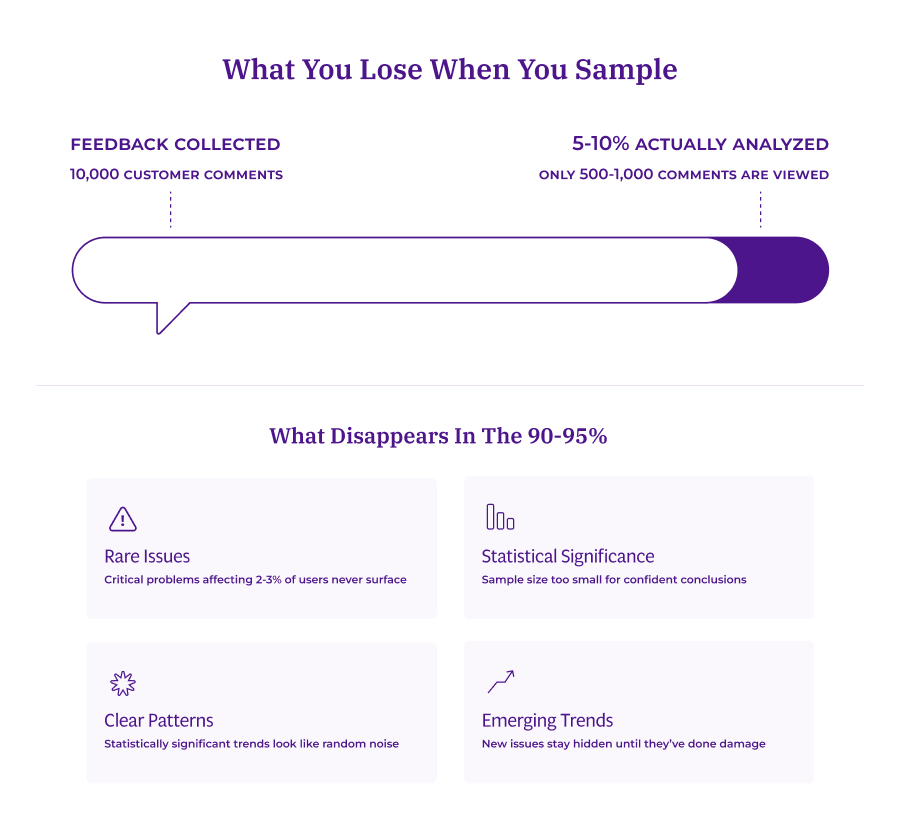
Here's what disappears when you sample:
Critical issues never surface in your subset
Clear patterns look like noise
Statistical significance disappears
Emerging trends stay hidden until they've damaged your business
Patterns only emerge when you analyze the full dataset, not just fragments.
2. Data becomes stale before anyone can act
By the time manual analysis finishes, issues have compounded for weeks and the moment to act has passed.
Greyhound collected thousands of customer comments monthly.
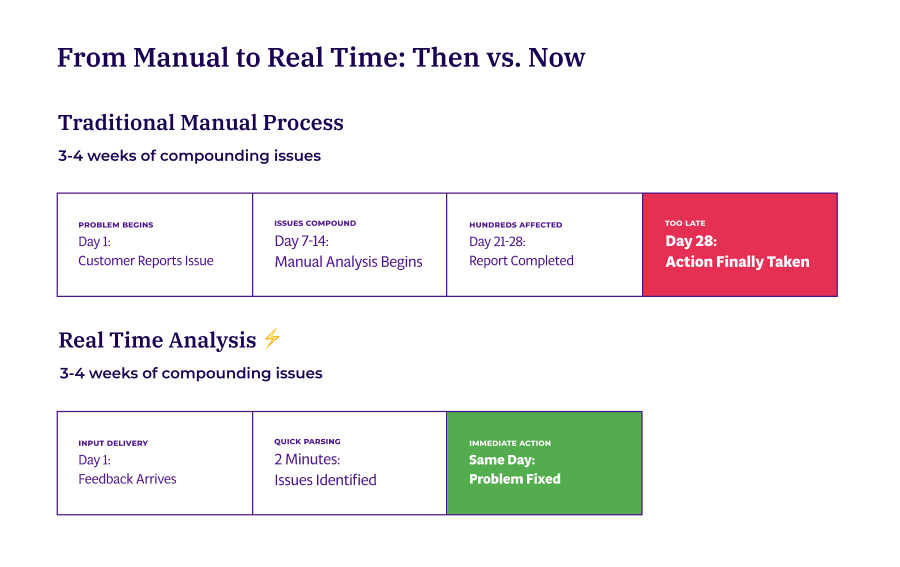
But as Matthew Schoolfield, Manager for Commercial Analytics, explained: "By the time we had manually compiled the results and sent them out across the company, the data was already 3-4 weeks old."
This delay created a cascade of problems:
One analyst spent 80% of his job manually bucketing feedback.
The process took anywhere from 3 hours to 3 days per analysis cycle, depending on the volume.
Issues customers reported on day one had compounded for nearly a month before anyone could act.
Station managers had zero visibility into problems happening outside office hours.
By the time reports reached the field, teams were addressing problems that had already affected hundreds of customers.
The impact snowballs:
Executives ask questions that take weeks to answer.
Product teams miss their window to respond to emerging issues.
Customer frustration builds while you're still categorizing last month's data.
3. Traditional tools fragment your understanding
Spreadsheets and keyword searches treat the same issue as separate problems when customers use different words.
This fragmentation makes it impossible to see the true scope of any issue.
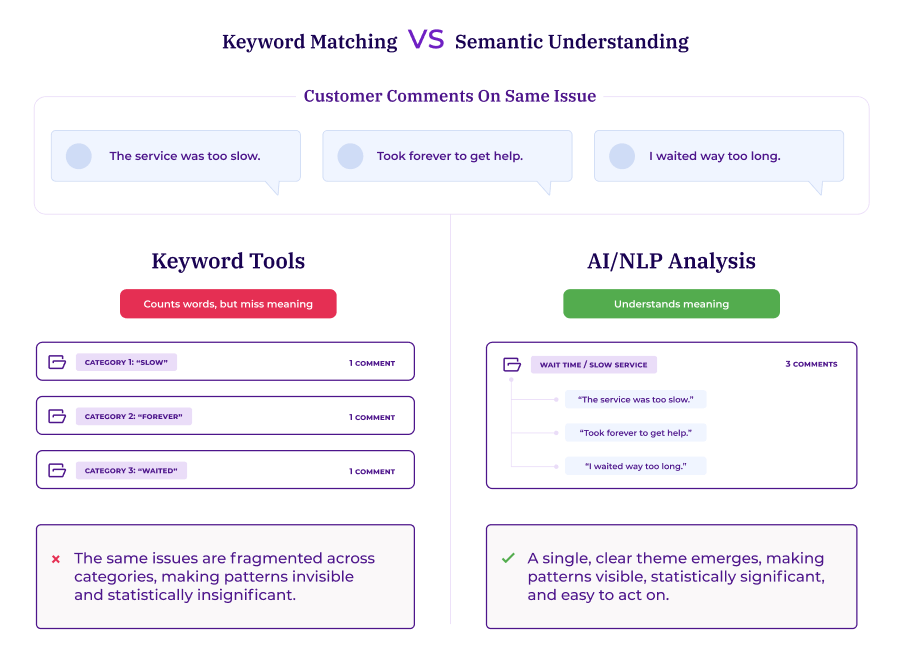
Customer A says "took forever."
Customer B says "extremely slow service."
Customer C writes "waited way too long."
It’s the same frustration, just in different words.
Keyword tools treat them as three separate, unrelated issues. As a result, each complaint looks isolated rather than revealing a systematic problem with wait times.
The consequences compound across your organization:
Analysts become bottlenecks
Projects pile up for months
Issues escalate while you categorize old data
Executives ask questions that take weeks to answer
The traditional approach breaks at scale.
The volume advantage with the right approach
Here's what most teams get wrong: they see thousands of comments as a burden to manage.
But having this volume is actually an advantage when you have the right approach to handle it.
• More data means clearer patterns. • Stronger statistical relationships. • Unexpected insights that small samples miss completely. • Those rare-but-critical issues? They become visible. • Statistical significance? You have the sample size to prove what matters.
Thousands of customer comments reveal patterns, correlations, and outliers that 100-comment samples can't possibly show.
The challenge isn't the volume itself. It's using an approach that was designed for smaller datasets.
You just need methods that scale with your data instead of breaking under its weight.
The solution isn't working harder or hiring more analysts.
It's changing your approach to match your volume.
So what does a scalable approach actually look like?
It starts with understanding how AI fundamentally changes the analysis process.
How does AI analyze open-ended customer feedback?
AI-powered feedback analytics platforms like Thematic analyze open-ended feedback by:
understanding meaning,
discovering themes automatically, and
identifying sentiment without predefined categories.
Thematic combines traditional text analytics with large language models (LLMs) to read feedback the way humans do.
It recognizes that 'slow service,' 'took forever,' and 'waited too long' all express the same customer frustration.
Instead of creating three separate categories that fragment your data, it groups them into a single theme you can act on.
1. Understanding meaning, not just word frequency
How does AI understand what customers actually mean?
Traditional keyword tools simply count how often words appear. AI takes a fundamentally different approach. It analyzes sentence structures, context, and relationships between words to determine what customers actually mean.
This is semantic understanding, and it matters because the same word can mean completely different things in different contexts.
For instance, AI distinguishes between "the app is fast" (positive feedback about speed) and "I had to fast-forward through the tutorial" (neutral comment, not about speed at all).
The word "fast" appears in both, but the meaning is entirely different.
Context determines meaning.
A traditional keyword search for "fast" would flag both comments as potentially related to performance.
However, semantic analysis understands that only the first comment is relevant to your app's speed.
This semantic understanding enables the next critical capability: discovering patterns you didn't know to look for.
AI vs. keyword tools
Word clouds show which words appear most frequently. They can't tell you what those words mean in context or how they relate to your business metrics.
Keyword search finds exact matches. It misses synonyms, paraphrases, and semantic variations of the same issue.
AI/NLP analysis understands meaning. It groups semantic variations together, analyzes sentiment in context, and shows you which themes actually move your satisfaction scores.
2. Discovering themes automatically from your data
Rather than forcing you to define categories upfront, the system reads your entire dataset and surfaces the patterns that matter most. No predefined categories required.
This is a bottom-up discovery.
This is what makes automatic emerging issue detection possible: the AI identifies new clusters of related comments as they form, flagging problems you didn't know to look for.
Traditional analysis forces you to define categories before you start. You create tags for "pricing," "usability," and "support" based on what you expect to find.
The limitation? You can only find what you're already looking for.
Automated theme discovery works differently. It analyzes your complete dataset and identifies patterns that emerge from the data itself. Including issues you didn't know existed.
LendingTree experienced this breakthrough when they processed 20,000+ comments across seven product verticals in 90 days.
Their Head of Insights discovered a theme called "Timing of Call" that was significantly impacting detractors. This theme never appeared in their manual analysis because it wasn't something they knew to look for.
Once discovered, they quantified its revenue impact for their lending partners.
The analysis "worked straight out of the box." Minimal setup. Fast time to value. No data scientists required.
Greyhound had a similar experience.
When they implemented AI analysis, they discovered overwhelmingly positive feedback about their drivers. This sentiment had been buried in thousands of comments and completely missed in their manual sampling process.
As Schoolfield explains: "We didn't realize that people were SO happy with our bus drivers, and that was a great insight to see!"
The discovery allowed them to celebrate and reinforce what was working, not just fix what was broken.
They shared these findings with driver training teams to validate that their approach was succeeding.
But discovering themes is only valuable if you can trust the results immediately.
That brings us to the third capability.
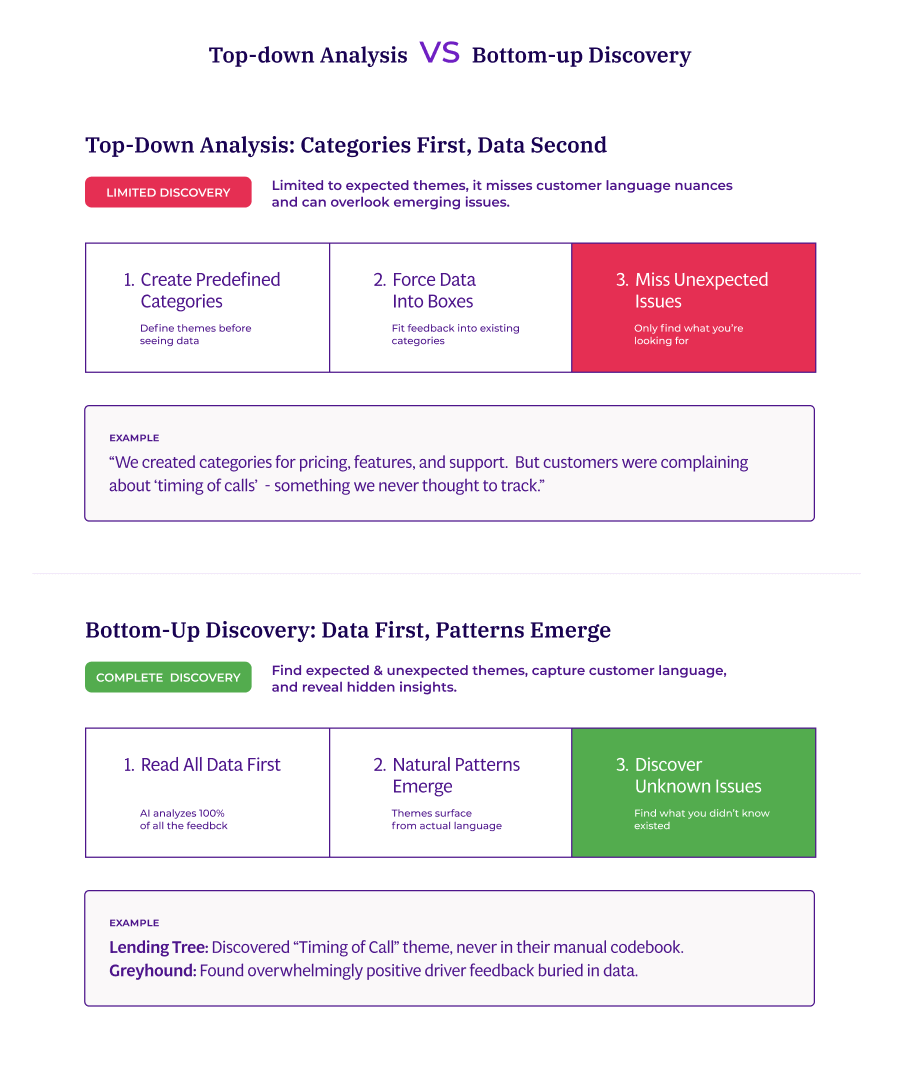
Bottom-up vs. top-down discovery
Top-down analysis starts with predefined categories. You create a codebook of themes before reading any data. If customers complain about something you didn't anticipate, you miss it entirely.
Bottom-up discovery starts with the data. AI reads everything first, identifies natural patterns, then surfaces themes based on what customers actually said. You find unexpected issues that manual analysis would never catch.
This is why LendingTree discovered "Timing of Call" affecting detractors and Greyhound found positive driver sentiment they didn't know existed.
3. Identifying sentiment without training
AI understands sentiment automatically by analyzing language patterns without requiring training data or manual configuration.
Modern thematic analysis systems achieve 80%+ accuracy out of the box.
This means you can get started quickly. There's no lengthy training period, no extensive configuration required, and your team doesn't need machine learning expertise to get value from the platform.
The AI understands "love the new feature" is positive and "hate waiting so long" is negative without you teaching it these distinctions.
This immediate accuracy matters because it means you can start getting insights on day one.
LendingTree saved hundreds of hours immediately.
The technology solves the scale problem by processing thousands of comments in minutes while maintaining human-level understanding of what customers mean.
This speed and accuracy combination is what makes comprehensive analysis practical at scale.
Understanding how AI works is important, but what ultimately matters is whether the insights actually help you make better decisions.
That's what we'll explore next.
What makes customer insights actually actionable?
Actionable insights have three essential qualities: quantified impact (not just frequency), enough specificity to guide decisions, and timely delivery while you can still act.
Pretty dashboards often fall short of this test. Colorful visualizations showing theme volumes and sentiment trends look impressive in presentations, but they don't tell you what to fix first or what business outcome to expect from fixing it.
1. Quantified impact, not just frequency
The most frequently mentioned theme isn't always the most important one for your business.
This is a critical distinction that many teams miss.
A theme mentioned by 1,000 customers might have minimal effect on your NPS.
Meanwhile, a theme mentioned by 200 customers could be destroying customer loyalty.
Volume doesn't equal impact.
Impact analysis reveals which themes actually move your metrics.
NPS sentiment analysis helps you understand not just what your score is, but why customers feel the way they do and which issues to prioritize.
Orion Air discovered this after a system migration triggered a surge in complaints.
Service issues dominated every dashboard, so leadership mobilized resources for what looked like an obvious crisis. But when they ran an NPS root cause analysis in Thematic, the findings surprised them.
Baggage handling wasn't mentioned most frequently, but it destroyed NPS and customer lifetime value disproportionately.
Even better: 80% of those issues were operationally fixable with existing resources.
When they focused resources there first, they achieved a 1.6-point NPS increase in that segment.
This contributed to a 13% overall improvement with measurable revenue gains.
All because they prioritized impact rather than volume.
Impact vs. volume
Themes ranked by frequency tell you what customers talk about most.
Themes ranked by NPS impact tell you what actually drives loyalty.
These two lists rarely match. Volume-based prioritization wastes resources fixing loud problems instead of expensive ones.
2. Specific enough to guide action
Generic insights don't help teams take action.
For instance, knowing "customers are unhappy with pricing" leaves everyone wondering what to do next.
However, discovering specific issues like "competitors offer better deals for new customers" or "annual price increases lack clear communication" gives your team concrete actions they can take immediately.
The difference is specificity.
Atom Bank demonstrates what's possible when you combine specificity with scale.
They unified feedback across three product lines and seven engagement channels, drawing from sources like app store reviews, Trustpilot surveys, support center complaints, and call summaries.
Analyzing the complete picture instead of isolated data silos revealed specific friction points in their customer experience.
The results were measurable:
69% reduction in calls related to unaccepted mortgage requests
43% reduction in savings maturity calls
40% reduction in device-related calls
110% YoY customer growth
Each reduction came from identifying and fixing specific, addressable issues. These issues appeared across multiple channels but weren't visible in any single data source.
The comprehensive view made all the difference.
3. Detecting emerging issues automatically, while you can still act
Speed transforms insights into competitive advantage.
When you can spot and respond to issues in real time, you prevent problems from compounding while your competitors are still compiling their monthly reports.
Greyhound station managers now identify location-specific issues as they happen.
When their Dallas location started receiving complaints about cleanliness, the local manager spotted it within 2 minutes of the feedback arriving, and addressed it immediately.
Previously, that same feedback would have taken 3 to 4 weeks to surface in a centralized report. The issue would have affected hundreds more customers before anyone knew to fix it.
That's the difference speed makes.
This speed advantage freed up Greyhound's research team for higher-value work.
Instead of spending weeks manually categorizing feedback, they launched four research projects that had been backlogged for months. The team shifted from reactive reporting to proactive strategy.
The actionability test is simple:
Can someone read your analysis and know exactly what to do tomorrow?
If yes, you have actionable intelligence.
If no, you have interesting data that won't drive change.
Now that you understand what makes insights actionable, how do you know when it's time to make the shift to automated analysis?
Democratized access multiplies impact
When insights live in shared dashboards instead of quarterly reports, stakeholders answer their own questions without analyst bottlenecks.
Their lean research team uses Thematic to give company-wide access to customer insights. Instead of being a bottleneck, the research team enables hundreds of employees to explore feedback themselves.
When merchants complained about the menu manager interface, the product team discovered the issue directly from the dashboard. And they designed a solution that reduced load times from 11 seconds to under 3 seconds.
Merchant NPS improved immediately.
No analyst requests. No waiting for reports. Direct insight to action.
When should I switch from manual to AI-powered feedback analysis?
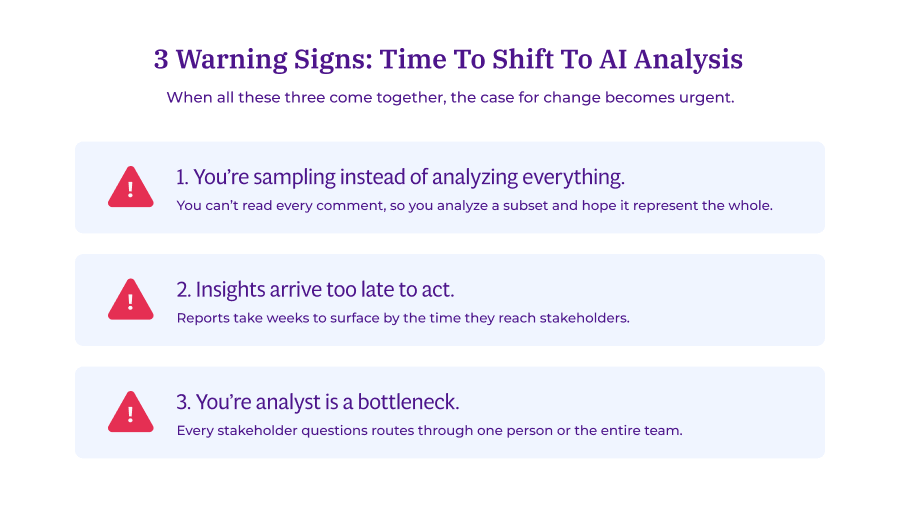
You should shift when you're sampling feedback instead of analyzing everything, insights arrive too late to act on, or your analyst has become a bottleneck for stakeholder requests. These aren't failures on your part — they're signals that your feedback volume has outgrown your current approach.
Let's examine each signal in detail.
Sign 1: You're sampling instead of analyzing everything
If you find yourself reading a subset of comments because you can't analyze everything anymore, that's a clear signal.
You've outgrown manual analysis.
You're analyzing 500 comments and hoping they represent the full dataset of 10,000.
However, the patterns you need might be hiding in the data you're not reading.
Those rare-but-critical issues are not making it into your sample.
The statistical relationships that reveal what truly drives satisfaction? You can't establish them with partial data.
Sampling made sense when it was your only option, but it's no longer the constraint it used to be.
Sign 2: Insights arrive too late to act
If your reports are weeks old by the time they reach stakeholders, you need a faster system.
Analysis takes weeks, and by the time insights arrive, the moment to act has passed.
Issues have escalated.
Customers have churned.
Opportunities have closed.
Meanwhile, competitors who can act faster on customer intelligence are gaining ground.
Greyhound's feedback was 3 to 4 weeks old before anyone could act on it. By then, the data was historical, not actionable.
Station managers couldn't respond to problems happening in real-time because they didn't know about them until weeks later.
Sign 3: Your analyst is a bottleneck
When every stakeholder question routes through one person or team, you've hit a scaling limit.
This isn't about analyst capacity or capability. It's about the approach itself.
Projects pile up in a backlog for months.
Simple questions take days to answer.
Strategic work gets postponed because analysts spend their time on manual categorization instead of higher-value analysis.
AI-powered analysis solves this by processing feedback fast enough that multiple stakeholders can access insights without waiting for custom reports.
Product managers can explore their features.
Regional managers can analyze their locations.
Support leads can examine their team's themes. All simultaneously.
When all three signs appear together, the case for change becomes urgent.
Making the decision
Volume guidance: For many teams, around 2,000+ comments per month is when AI-powered analysis deserves serious consideration.
LendingTree processes 20,000+ comments every 90 days. Volume that would be impossible to analyze manually with any consistency or speed.
However, volume isn't the only factor. Even teams with moderate feedback volumes benefit when they need faster turnaround or deeper analysis.
543% ROI over three years. $2.9M in benefits. Payback in less than six months.
Greyhound's tenfold reduction in analysis time freed their team for strategic work.
As Matthew Schoolfield noted: "I would say it's 50%-time savings vs before, it reduces my analytics time tenfold."
They launched four backlogged research projects immediately.
Their senior director of customer experience now uses insights daily to have targeted conversations with field teams.
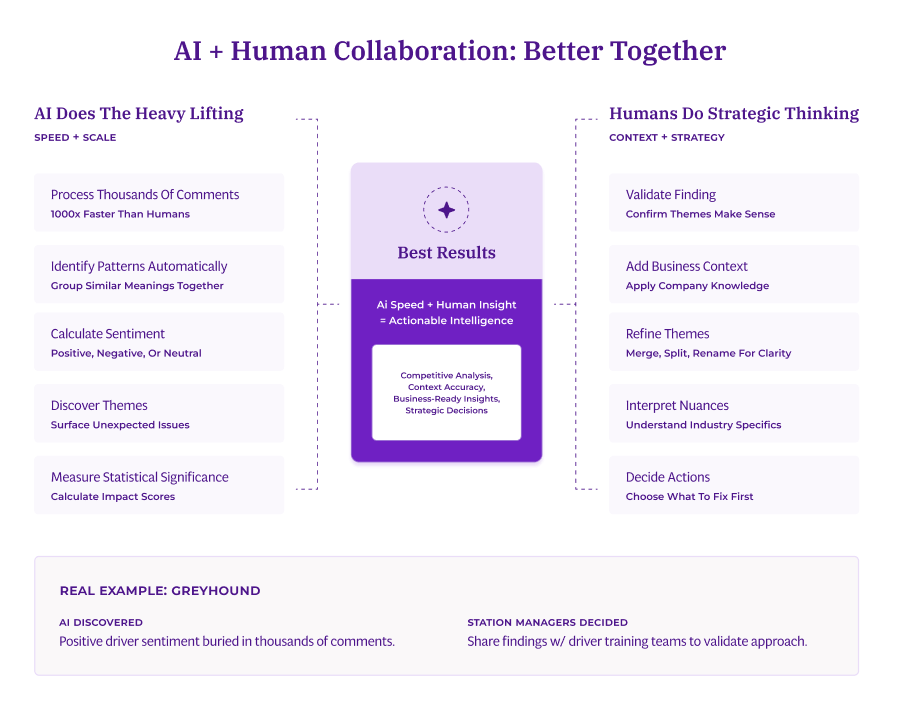
AI works alongside human judgment The system discovers themes and calculates statistical patterns.
Humans validate findings, apply business context, and decide which actions to take.
Think of it as an analyst that processes data dramatically faster than you and never gets tired. But still needs your strategic thinking and domain expertise.
Thematic is purpose-built for this shift. It analyzes feedback at scale while giving you full transparency into how themes are discovered, so your team can trust and act on the insights.
Once you've decided to shift, here's exactly how to implement AI-powered analysis in your organization.
How do I set up AI-powered customer feedback analysis?
Five steps transform overwhelming feedback volume into clear, prioritized action: unify your sources, apply AI theme discovery, prioritize by impact, democratize access, and close the loop.
This is the framework Thematic customers like Greyhound, LendingTree, and Atom Bank use to analyze thousands of comments in minutes.
Let's walk through each step.
Step 1: Unify your feedback sources
How do you combine feedback from multiple sources?
Start by listing every place customers share feedback with your organization.
Survey platforms
Support systems
Review sites
Social channels
Sales notes
Community forums
All of it.
Connect these sources into a single analysis platform.
This unified view is essential because customers often express the same concern through multiple channels, and you need to see the complete pattern.
Remember: Don't let perfect be the enemy of good.
Start with what you have today and add sources as you go.
Progress matters more than perfection. And it's better to start analyzing your two largest sources now than to wait until you've integrated all seven.
Atom Bank unified feedback across seven engagement channels. This comprehensive view revealed patterns that were invisible when data lived in silos.
Issues that seemed minor in app reviews turned out to be major problems when the same themes start appearing in support tickets and call transcripts.
Integrating feedback from multiple channels ensures you see the complete customer story, not just isolated fragments.
With your sources unified, you're ready to let AI discover what patterns exist across all that data.
Step 2: Apply AI theme discovery
Upload your feedback to an automated analysis platform. This is where patterns emerge from your data. Resist the urge to control every detail upfront.
Let the system read your entire dataset first.
Don't create predefined categories.
Don't try to guess what themes exist.
Let the AI surface themes automatically from the patterns it finds in your complete dataset, not a sample.
Automated theme discovery identifies patterns and specific phrases that map to broader themes, making it easy to spot what matters most.
The system might find themes you never would have looked for. Those are often the most valuable discoveries.
Review the discovered themes:
Merge similar themes that mean the same thing
Split broad themes into specific sub-themes
Rename themes to match your terminology
The AI does the heavy lifting of reading thousands of comments and identifying patterns.
You add the business context that makes themes meaningful to your organization.
Once themes are discovered and refined, the next challenge is knowing which ones to fix first.
Step 3: Prioritize by impact, not volume
Calculate which themes actually move your satisfaction metrics.
This is a tricky part for many: They fix what's mentioned most often instead of what matters most to customer satisfaction.
Here's one framework for prioritizing themes:
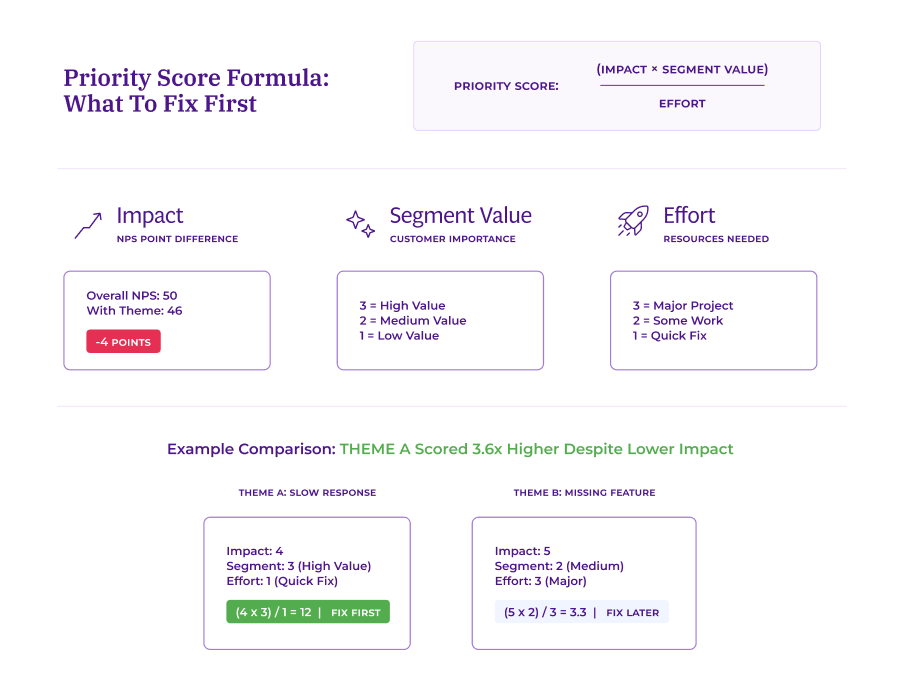
Priority Score = (Impact on NPS/CSAT × Customer Segment Value) ÷ Effort to Fix
Here's how to calculate each component:
Calculate impact: Overall NPS minus NPS for customers who mention this theme. A theme with a -12 point impact hurts satisfaction far more than one with a -2 point impact, regardless of mention volume.
Identify high-value customer segments affected: If enterprise customers are affected, the business impact is higher than if the issue only affects free-tier users.Multiply impact by segment value.
Estimate effort to fix: Rate fixes as low (1 week), medium (1 month), or high effort (1 quarter+). Divide your impact score by effort to find the highest ROI actions.
Sort themes by priority score.
Fix high-impact, high-value, low-effort issues first. These are your "quick wins." Problems that hurt satisfaction significantly but don't require massive resources to resolve.
Focus on themes that move metrics, not themes that appear most frequently. This focus ensures your limited resources go toward changes that actually improve customer satisfaction.
Prioritization only works if the right people can access and act on insights quickly.
That's what the next step addresses.
Step 4: Democratize access
Give stakeholders direct access to dashboards filtered for their area of responsibility. This eliminates the analyst bottleneck and enables teams to move at the speed of their questions.
Set up role-based views:
Product managers see themes by feature
Regional managers see themes by location
Support leads see themes by team
Executives see company-wide trends
Configure alerts for themes that matter to each function. When a critical issue emerges in someone's area, they know immediately without waiting for a weekly report.
This democratized access transforms how teams work.
Product managers answer their own questions without submitting requests to analytics.
Regional managers respond to local issues in real-time.
Support leads identify training needs as they emerge.
However, access without action is just information.
The final step turns insights into measurable results.
Step 5: Close the loop
Now, how do you measure if feedback improvements worked?
Create a process for acting on insights and measuring results. This systematic approach ensures insights drive actual improvements rather than just interesting discussions.
Immediate actions:
Start by identifying 3 quick wins you can implement this week. These are high-impact, low-effort fixes from your prioritization analysis.
Tag these initiatives in your feedback platform so you can track related comments before and after your changes. This creates a clear baseline for measuring impact.
Set a 30-day review to measure before-and-after impact. Did the theme volume decrease? Did satisfaction improve for customers mentioning this theme? Both metrics matter.
Track results:
Review theme impacts monthly to see what's working.
Check whether both volume decreased AND impact improved.
If volume drops but impact stays the same, you've addressed symptoms without fixing root causes. Dig deeper.
Monitor whether fixes in one area create new issues elsewhere.
Sometimes resolving a complaint in one channel just shifts it to another channel, which means you haven't truly solved the problem.
Communicate what changed:
Tell customers what you fixed based on their feedback. This closes the loop and shows them their input drives real change.
Share specific examples: "You told us checkout was confusing. We redesigned it and reduced completion time by 40%."
Share results with internal teams so they see how insights drive decisions. When the support team sees their feedback led to a product change that reduced tickets by 30%, they become advocates for the system.
The framework works because it treats feedback analysis as a continuous system, not a one-time project.
Each cycle refines your understanding and improves your response.
Ready to implement this framework?
Request a demo and we'll show you how analysis using AI surfaces insights from your specific data.
Frequently asked questions
How much feedback do I need before AI analysis makes sense?
For many teams, around 2,000+ comments per month is when automated analysis becomes worthwhile.
Below that, manual analysis might still work. Above it, you're either sampling or falling behind.
LendingTree processes 20,000+ comments every 90 days. The system "worked straight out of the box" with immediate ROI.
Volume isn't the only factor.
If you're sampling feedback, projects are backlogged, or reports take weeks—AI makes sense regardless of volume.
Ask yourself:
Are you reading less than 100% of your feedback?
Do projects sit in a backlog for weeks?
Does it take more than a week to answer questions?
If you answered yes to any of these, you're ready. The investment will pay off quickly.
Will AI miss the nuance that human analysts would catch?
No, when AI and human analysts work together.
Thematic achieves 80%+ accuracy out of the box, and its transparent methodology lets you see exactly how themes were discovered.
Humans refine themes, add business context, and make strategic decisions.
The combination delivers better results:
AI catches patterns across thousands of comments that humans miss through sampling
Humans add context-specific nuances that require industry knowledge
Together, you get comprehensive and accurate analysis
Real example: Greyhound's AI discovered positive driver sentiment completely missed in manual analysis. The team shared findings with driver training to validate their approach was working.
The AI handles heavy lifting. You add business intelligence.
How long does it take to get started?
Setup takes days, not months.
Greyhound rated difficulty as "1 out of 5." (1 as easiest) Straightforward even without data science expertise.
LendingTree: Lee King, Head of Insights, explains: "Thematic works straight out of the box. I can show the business promoters and detractors, and quantify the drivers."
Upload your dataset and the AI begins discovering themes immediately. You can explore patterns, filter by segments, and calculate impact scores right away.
Many companies see initial insights within their first week of setup.
Can customer feedback analytics identify emerging issues automatically?
Yes. AI-powered customer feedback analytics can automatically identify emerging issues by detecting new clusters of related comments as they form in your data, without requiring predefined categories or manual rules.
The key capability is unsupervised theme discovery. Unlike keyword-based tools that only find issues you’ve already defined, unsupervised AI reads every piece of feedback and identifies patterns as they emerge from the data itself. It understands that "app keeps freezing," "screen goes blank," and "had to force close" describe the same problem, even when those phrases don’t match any existing category.
Thematic’s Emerging Themes Detection monitors feedback continuously across surveys, support tickets, chat logs, app reviews, and social media. When a new theme begins forming, the system flags it automatically. This catches issues at low mention rates, well before they’d register in a traditional dashboard.
For this capability to work effectively, look for a platform that combines multichannel unification (connecting feedback from every source), automatic detection without manual rules, transparent methodology with audit trails, and impact analysis that connects emerging themes to business metrics like NPS and CSAT.
Share
Link Copied!
Request a demo of Thematic's Customer Intelligence Platform
Thematic turns fragmented feedback into one consistent source of customer truth — so every team acts on the same customer story. Up and running in days, not quarters.
Thank you! Your submission has been received!
Oops! Something went wrong while submitting the form.


.jpg)