Why Your VoC Program Is Stuck in 2016 (And How AI + Modern Data Stack Can Fix It)
Quarterly surveys, manual coding, and PowerPoint decks belong to 2016. Here's how AI and the modern data stack turn VoC into real-time business intelligence.
Survey response rates have collapsed to 7%, and 96% of CX leaders can't calculate ROI on their decisions
The 2016 VoC playbook (quarterly surveys, manual coding, monthly decks) can't match the speed at which the rest of the business now operates
AI and the modern data stack solve the core constraints: scale, speed, warehouse integration, and self-service access for stakeholders
Platforms like Thematic pair AI-powered theme discovery with human-in-the-loop governance, feeding insights into the warehouses and BI tools teams already use
One organization measured 543% ROI and $1.8M in incremental income after modernizing its VoC program
Executive summary
Your Voice of Customer program runs on 2016 infrastructure. While sales moved to real-time CRM dashboards and marketing automated personalization at scale, VoC stayed put. Quarterly surveys. Manual analysis. Monthly PowerPoint decks. The gap keeps widening.
The numbers tell the story. Only 7% of customers respond to surveys anymore, and just 15% of CX leaders are satisfied with their measurement approach. Stakeholders stop asking for insights because the insights arrive too late to matter.
Two technologies converge to fix this. The modern data stack creates shared infrastructure where VoC data flows alongside everything else the business tracks. AI solves the bottleneck that always held feedback analysis back: you can now analyze thousands of responses in hours, not weeks. The companies that have made this shift are seeing seven-figure income gains, thousands of hours of efficiency, and ROI in the triple digits.
This paper walks through why VoC fell behind, what staying stuck costs you, and how AI plus modern data architecture turn research teams into strategic partners instead of report factories. If you're a VP of Customer Experience, Research Director, or Data & Analytics Leader, you'll see why your program runs the way it does and what needs to change.
Key takeaways
VoC programs using 2016 methodology (quarterly surveys, manual coding) can't keep pace with modern business needs
AI and modern data stack integration deliver proven results: 543% ROI, $2.4M NPV, with thousands of hours automated
The research role evolves from manual execution to strategic governance, with AI handling scale and humans providing judgment
Organizations that modernize now become strategic partners; those that delay risk continued marginalization
Want the practitioner's playbook?
Rethinking Voice of Customer: How Research Teams Can Evolve with the Modern Data Stack goes deeper on the operational side — vendor selection backed by 2025 BCG data, a four-challenge solution guide for adding VoC to your data stack, and a stakeholder-by-stakeholder buy-in framework. Read the full resource.
Introduction
Every business function modernized its data infrastructure. Sales moved to real-time CRM. Marketing automated personalization at scale. Product teams ship based on continuous analytics. VoC? Still running quarterly surveys.
This white paper answers five questions. Why isn't your VoC program delivering expected ROI? How do modern companies analyze feedback at scale? What separates traditional approaches from AI-powered ones? Should customer feedback integrate with your data warehouse? And how do you get started?
The answer comes down to methodology. Traditional programs use quarterly surveys, manual coding, and delayed PowerPoint reports. Modern programs use AI and data stack integration for real-time analysis across all feedback channels. The difference shows up in measurable business outcomes: faster cycles, broader coverage, and ROI you can actually defend in a budget review.
Two forces make this the moment to act. Nearly half of VoC leaders rate their program maturity as low or very low, signaling widespread readiness for change. At the same time, 79% of CX leaders now trust AI agents to handle customer interactions. The industry is shifting toward automated intelligence at scale, and VoC has the most to gain.
The solution combines AI-powered feedback analysis with modern data stack integration. Platforms like Thematic demonstrate how this approach works in practice. AI handles scale and speed. Humans provide judgment and governance. Feedback flows into your data warehouse alongside operational metrics. Insights surface in the BI tools stakeholders already use.
The result transforms VoC from report factory to strategic intelligence layer.
The following sections explain why VoC programs stayed stuck, what that costs you, how modern technology solves core constraints, and how to implement change.
1. Why your VoC program is stuck in 2016
The 2016 playbook is still running
Here's the typical VoC program today. You launch a quarterly NPS survey. Responses trickle in over two weeks. Someone exports the data to Excel and manually codes the open-ended responses. Weeks later, you've categorized themes, built charts, and assembled a PowerPoint deck. You present to executives who nod politely. Then everyone moves on.
Three months later, you do it again.
This is the 2016 playbook. Response rates have been falling for years, and you're now hearing from a shrinking slice of customers, often not the ones who need attention most. The feedback sits in a dedicated CEM platform that doesn't connect to your data warehouse, your BI tools, or the systems where business decisions happen.
The analysis takes weeks because someone has to read through responses and tag them manually. By the time insights reach stakeholders, the moment has passed. Product shipped a new feature. Marketing launched the campaign. Operations adjusted staffing. Your feedback arrives after decisions got made.
Meanwhile, that CEM platform stores everything in its own silo. Sales can't see customer complaints alongside pipeline data. Product teams can't connect feature requests to usage patterns. Finance can't tie satisfaction scores to retention metrics. VoC lives on an island.
While the rest of the business moved on
Compare that to how other functions operate now. Sales teams work from real-time CRM dashboards. They see pipeline movement, conversion rates, and customer interactions updated continuously. Marketing runs automated personalization based on behavior data that refreshes hourly. Product teams track feature adoption and usage patterns in near real-time analytics platforms.
These functions share infrastructure. They all feed data into a central warehouse like Snowflake or Databricks. From there, data flows to BI tools everyone can access. A product manager can pull up a dashboard showing feature adoption by customer segment without asking anyone for a custom report. A marketing analyst can connect campaign performance to revenue without waiting on finance.
VoC? Still producing monthly reports. The insights are solid, but they land in a world that moves at a different speed. Executives expect to explore data themselves, not wait for someone to build them a deck. They want to connect customer feedback to operational metrics, not look at satisfaction scores in isolation.
This isn't about the quality of research. Research teams are sophisticated and committed. But the infrastructure won't let them deliver at the pace the business demands. You're driving a reliable car from 2016 on a highway where everyone else upgraded to something faster.
The feedback you're missing
Surveys capture a tiny fraction of what customers actually say. According to Forrester, while 96% of VoC programs collect surveys, only 50% are effective at analyzing unstructured feedback. That means half of programs struggle with the feedback that lives outside surveys.
Think about where customers actually share their thoughts. Support tickets explain exactly what's broken. Call transcripts reveal frustration in real time. Online reviews describe specific product experiences. App store comments point to usability issues. Social media posts broadcast complaints publicly. Chat logs capture questions that never reach your survey.
This feedback already exists. Your company collects it across channels and touchpoints. But most VoC programs don't touch it. The 2016 infrastructure can't handle the volume. Manual analysis doesn't scale to thousands of support tickets or hundreds of call transcripts. So you stick with surveys, even though they represent a shrinking and potentially biased sample.
It's like having security cameras recording 24/7 but only reviewing footage from one camera on Mondays. The irony is painful. Customers are telling you what matters, constantly, across every channel. But your VoC program only listens to the 7% who respond to surveys. The rest of the signal goes unused.
Surveys are the tip. The richest signal (exactly what's broken, why people are frustrated, what they'll churn over) already exists in channels most VoC programs never analyze.
Is your VoC program stuck in 2016?
Check how many of these apply to your program:
☐ Survey response rates below 10% ☐ Analysis cycles taking 3+ weeks from survey close to insights ☐ Manual coding of open-ended responses ☐ Insights delivered primarily through PowerPoint decks ☐ VoC data stored separately from operational systems ☐ Stakeholders rarely ask for customer feedback insights ☐ Unable to calculate ROI on CX improvements ☐ Support tickets and call transcripts analyzed rarely or never ☐ Feedback themes updated quarterly or less frequently ☐ Most business decisions made before VoC insights arrive
If you checked 3 or more, your infrastructure is holding back your program's potential. If you checked 6 or more, you're running on a 2016 playbook while the business has moved on.
2. The cost of standing still
You can't prove value
Only 4% of CX leaders can calculate ROI on their decisions. That number should alarm you. It means 96% of programs can't connect customer feedback to business outcomes. You report satisfaction scores, but you can't show how improving those scores affects retention, revenue, or lifetime value.
This financial disconnect is fatal. When executives ask whether to invest in your program, you can't answer with numbers they care about. You talk about themes and sentiment. They want to know about dollars and margin. The conversation doesn't connect.
Other functions prove their value constantly. Marketing tracks conversion rates and customer acquisition cost. Sales shows pipeline coverage and win rates. Product measures feature adoption and engagement. These metrics tie directly to revenue. Customer satisfaction? It correlates, probably, but you can't prove causation.
The problem compounds over time. Without clear ROI, budget conversations become difficult. Your program gets enough funding to survive but not to grow. Meanwhile, data teams, marketing ops, and product analytics get resources because they can show business impact.
Stakeholders stop asking
Only 42% of stakeholders proactively request VoC insights, according to Forrester research. Less than half. Just 44% express confidence in VoC metrics.
Think about what that means. You work hard to gather feedback, analyze it, and prepare insights. But most stakeholders don't ask for them. When they do receive them, they're not confident the metrics mean what you say they mean.
This disengagement didn't happen overnight. It started when insights began arriving too late. Product shipped the feature before your feedback explained why customers needed it. Marketing launched the campaign before your data showed how messaging should shift. Operations made staffing decisions before you identified the volume drivers.
After enough cycles of insights arriving after decisions, stakeholders stop waiting. They make calls based on what they have access to right now. Your quarterly report might validate their choice or suggest they should have gone another direction, but either way, the decision already happened.
The real damage is trust erosion. Stakeholders stop believing VoC insights will change outcomes. They treat your reports as post-mortems, not decision inputs. Your team becomes a service function rather than a strategic partner.
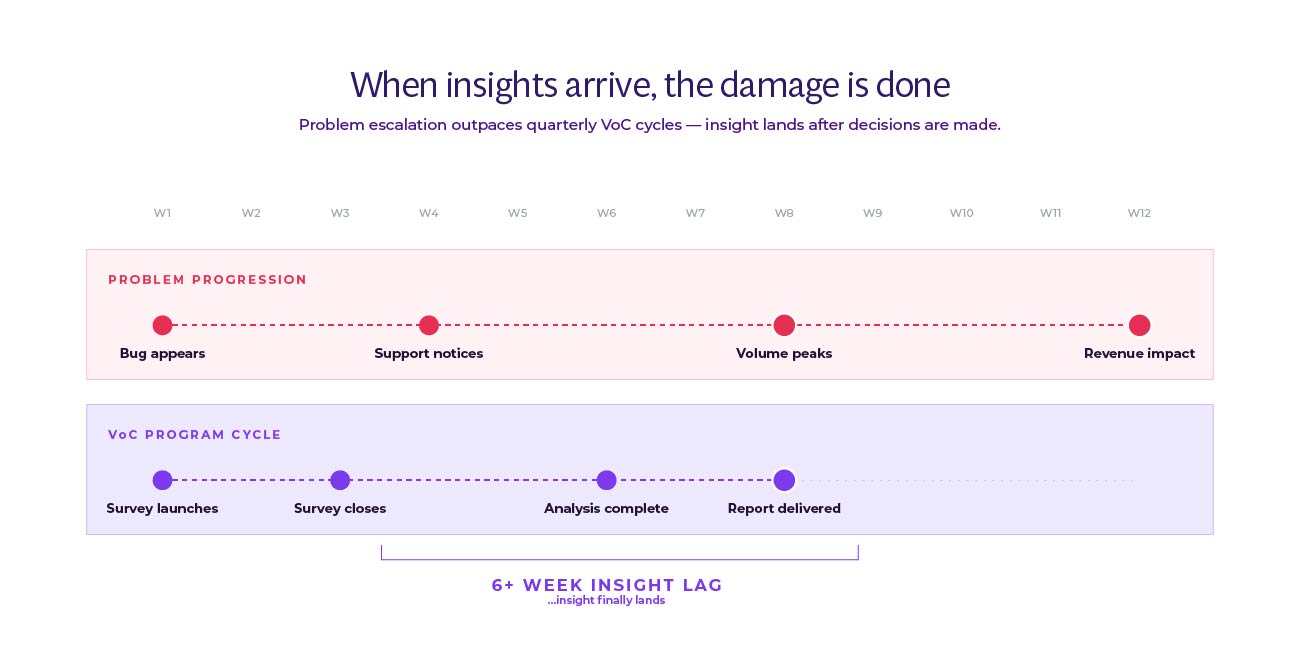
Problems compound before you see them
Your quarterly cycle creates dangerous blind spots. Issues that need immediate attention don't surface until the next survey closes, someone codes the responses, and your team spots the pattern. By then, weeks or months have passed.
According to InMoment research, 92% of consumers expect a brand to respond within 24 hours, and 44% expect to receive a direct response or follow-up after giving feedback across channels. The gap between customer expectations and company response creates compounding damage. A frustrated customer becomes an angry customer becomes a churned customer becomes a detractor who warns others away.
The pattern repeats across issue types. Product bugs that frustrate dozens of users go undetected. Service problems that spike call volume don't trigger alerts. Pricing concerns that slow new sales don't surface until revenue already took the hit. Your team eventually identifies these patterns, but the damage already happened.
Real-time operations run into quarterly insights. Sales needs to know which objections prospects raise most often, but your survey won't ask about that until next quarter. Support wants to understand why ticket volume spiked last week, but you won't have themes coded for another month. Marketing wonders why campaign response rates dropped, but feedback won't reach them until the campaign already ended.
The mismatch in operational tempo creates a vicious cycle. Problems escalate while VoC gathers data. By the time insights arrive, stakeholders already fought the fire using whatever information they could find. Your program becomes the team that explains what happened after everyone already knows.
By the time the report lands, the bug has shipped, support has absorbed the volume, and revenue has already taken the hit. Quarterly cycles can't match operational tempo.
3. Enter the modern data stack
How modern companies handle data now
The industry solved this problem already. Just not for VoC data yet.
Over the past decade, companies completely rebuilt how they handle structured data. Sales, marketing, product, and finance moved to shared infrastructure called the modern data stack. Instead of isolated tools that don't talk to each other, they built systems where data flows continuously between platforms.
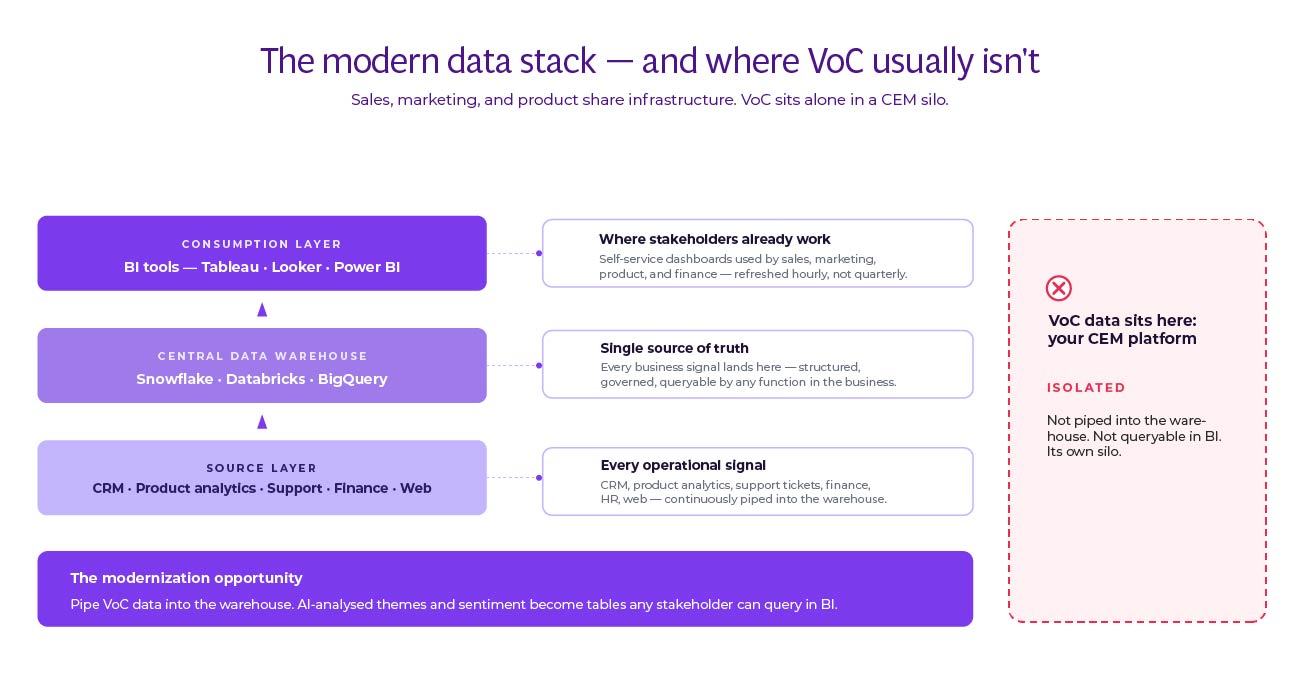
Here's how it works. Data from everywhere flows into a central warehouse: Snowflake, Databricks, or BigQuery. Website analytics, CRM interactions, product usage, transactions, support tickets, all of it.
Transformation tools like dbt clean and organize the data into tables anyone can query. Business intelligence platforms like Tableau, Power BI, or Looker turn those tables into dashboards. Orchestration tools make sure data moves where it needs to go, when it needs to get there.
The result changes how companies operate. Sales sees product usage alongside pipeline metrics. Marketing tracks campaign performance against revenue. Product teams connect feature adoption to retention. Finance ties everything to business outcomes. Everyone works from the same data. Decisions happen faster because people don't wait for someone to pull a custom report.
Modern data stack companies using platforms like Snowflake report significant gains. For example, TS Imagine automated email monitoring and saved 4,000 hours annually while reducing costs by 30% using AI-powered analytics in their data stack. RAC reduced call handling times by 30% and cut insight turnaround from months to 2-3 days by unifying customer data.
VoC data mostly sits outside this system. It lives in dedicated CEM platforms designed to be self-contained. They handle survey distribution, basic text analytics, and reporting. But they don't feed data warehouses. They don't connect to BI tools. They're not part of the shared infrastructure where business decisions happen.
Every other function pipes data into the warehouse and queries it from BI. VoC is usually the one function still living in its own tool, on its own schedule.
Three reasons VoC belongs in your data stack
First, context lives in the warehouse. Customer feedback means more when you can see it alongside behavior.
A detractor score matters differently for a customer who just renewed versus one whose contract expires next month. A complaint about pricing hits differently from a high-value customer versus someone who never purchased. Sentiment about a feature makes more sense when you see actual usage data.
Without this context, you're interpreting feedback in isolation. You know customers mentioned checkout frustration, but you can't see their actual cart abandonment rate. You know they complained about support wait times, but you can't connect that to ticket volume or staffing levels. You know they requested a feature, but you can't prioritize it against usage data for similar features.
Putting VoC data in the warehouse solves this. Feedback themes sit in tables next to customer attributes, transaction history, product usage, and operational metrics. Anyone building a dashboard can include feedback data.
A product manager analyzing feature requests can segment by customer value. A marketing analyst studying campaign performance can filter by sentiment. Context becomes automatic rather than a special request.
Second, stakeholders already work in BI tools. They don't want another platform to check. They want customer insights on the same dashboards they use for everything else. When VoC data feeds the warehouse, it shows up in Tableau, Looker, Power BI, whatever the company standardized on.
This changes how insights spread. Instead of sending decks to stakeholders, you build dashboards they can explore themselves. They filter by product line, customer segment, time period, whatever matters for their question. They connect feedback themes to metrics they already track. The insights become self-service rather than bottlenecked through your team.
Third, automation becomes possible. When feedback lands in the warehouse, you can build workflows that trigger on specific conditions. If complaint volume about a topic spikes above a threshold, alert the relevant team. If sentiment for a feature drops, notify product management. If a high-value customer leaves negative feedback, route it to account management immediately.
These workflows run continuously without manual intervention. You're not waiting for someone to spot a pattern in the next analysis cycle. The system watches for conditions that matter and takes action automatically. Your team shifts from finding patterns to governing the patterns the system surfaces.
Why best-of-breed wins over suites
Some companies try to solve this by buying a CX suite that promises to do everything. One vendor for surveys, feedback management, journey orchestration, and analytics. The appeal is understandable. One contract, one vendor relationship, integrated features.
The reality rarely delivers. Suites optimize for integration between their own modules, not for integration with your data stack. You end up with another silo, just a bigger one. The survey tool talks to the journey tool, but neither talks to your warehouse, your BI platform, or the operational systems that need customer data.
Best-of-breed takes the opposite approach. Choose specialized tools that excel at specific jobs, then connect them through your data stack. Use a purpose-built survey tool if surveys matter. Use an AI-powered text analytics platform for unstructured feedback. Use your existing BI tools for visualization. Connect everything through the warehouse.
This approach scales better. When a better tool emerges for one function, you can swap it in without rebuilding everything. When your needs change, you add new tools to the stack without replacing the foundation. The warehouse becomes the integration layer, and standard tools like Fivetran or Airbyte handle data movement.
The suite versus best-of-breed question comes down to this: do you want tools that talk to each other, or tools that talk to your entire data infrastructure? Modern companies choose the latter.
Manual analysis was always the constraint. Someone had to read through responses, identify themes, code each mention, track patterns across responses. For 100 survey responses, this was tedious. For 1,000 responses, it became a project. For 10,000 responses from multiple channels, it was impossible.
Think of it like reading every email yourself versus having a smart assistant sort and summarize them. The manual approach works when volume is low, but breaks down at scale.
This bottleneck shaped everything about VoC programs. You could only ask a few open-ended questions because more meant more analysis time. You ran surveys quarterly because continuous collection would drown the team. You focused on surveys because support tickets and call transcripts would create unmanageable volume. The constraint forced narrow, infrequent data collection.
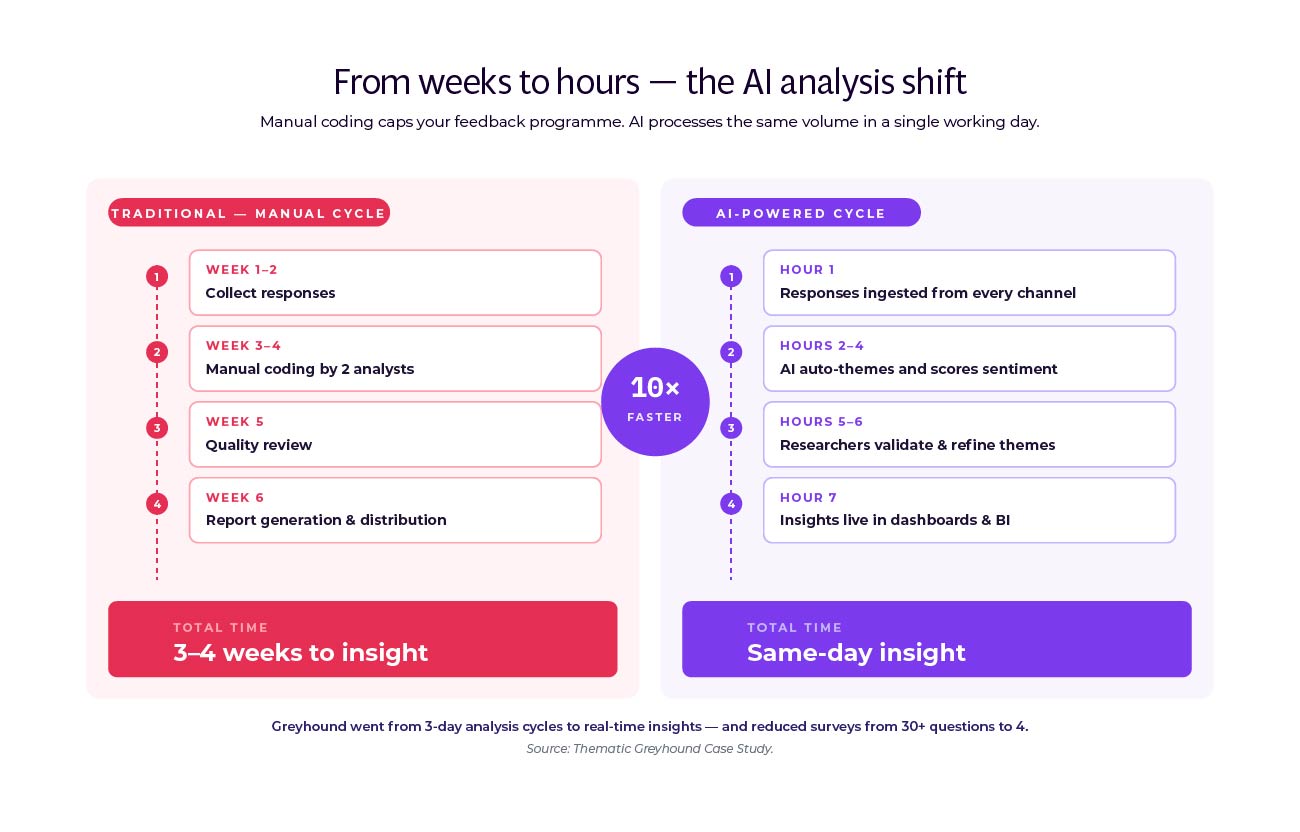
AI solved this constraint. Modern text analytics platforms can process thousands of responses in hours.
They identify themes automatically using natural language processing and deep learning. They detect sentiment without manual coding. They spot patterns across channels without someone reading every piece of feedback.
The technology works differently than older keyword-based systems. Those required you to define every term that might indicate a theme. If customers said "slow checkout" or "payment takes forever" or "can't complete purchase quickly," you needed rules for each variation. Miss a variation, and those responses went uncategorized.
Modern AI learns context. It understands that "slow checkout," "payment takes forever," and "can't complete purchase quickly" all express the same underlying theme. It groups them automatically. As new variations appear in feedback, the AI categorizes them correctly without new rules.
Greyhound went from 3-day analysis cycles to real-time insights and cut surveys from 30-plus questions down to 4 by letting AI extract themes from open-ended responses.
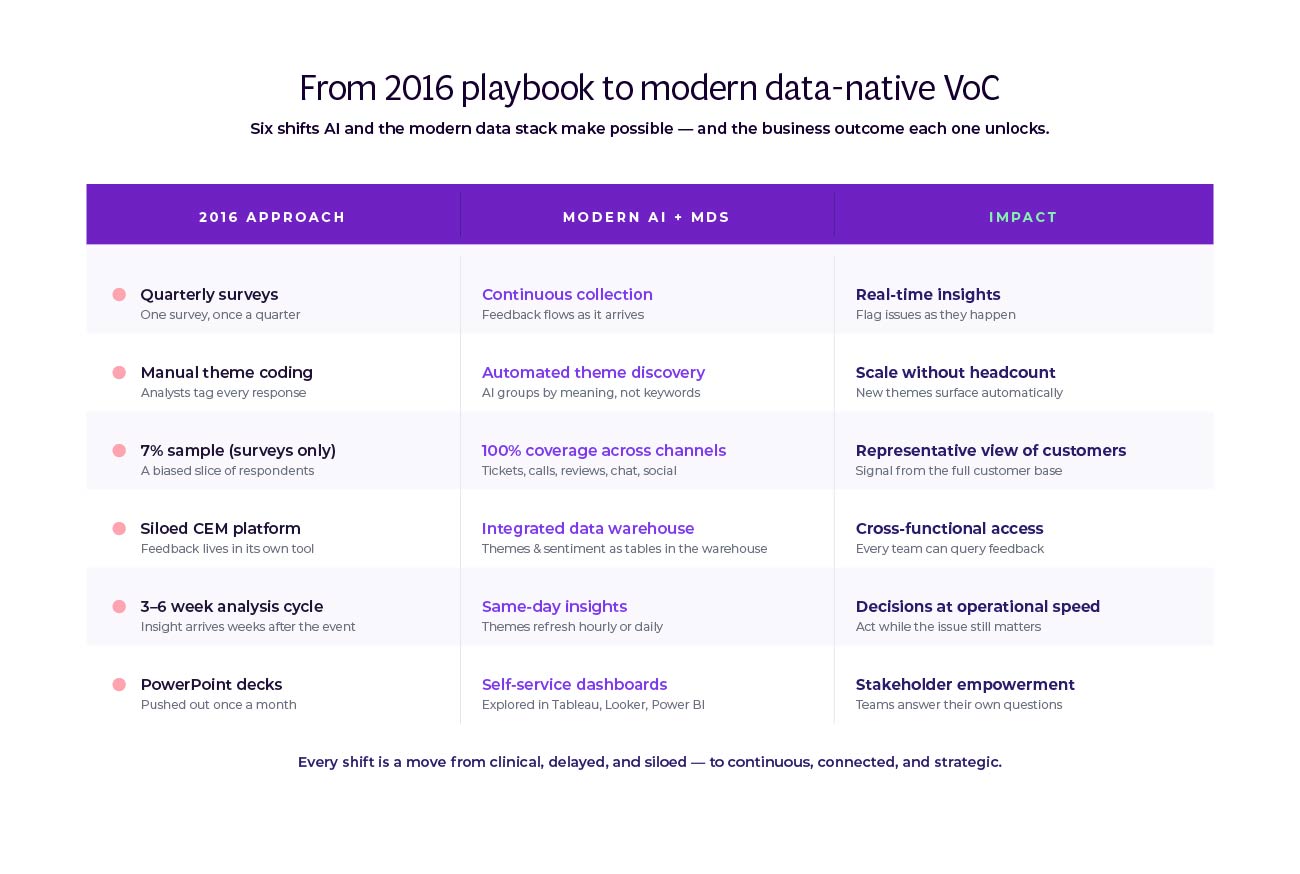
From 2016 problems to modern solutions
Let's map old constraints to new possibilities:
Quarterly surveys → Continuous collection. You're no longer limited by analysis capacity. Collect feedback whenever customers provide it. Trigger surveys based on behavior. Monitor support tickets continuously. Track social mentions in real time. AI handles the volume.
Manual theme coding → Automated theme discovery. Stop defining categories upfront and tagging responses manually. Let AI identify what customers actually talk about. Themes emerge from the data rather than from your assumptions. New topics surface automatically as feedback changes.
Sample bias → Multi-channel coverage. When you can only analyze surveys, you hear from the 7% who respond. When AI handles all text at scale, you can include support tickets, chat logs, reviews, call transcripts, social media. You get signal from everyone, not just survey respondents.
Siloed insights → Integrated dashboards. Analysis results flow into your data warehouse as structured tables. Themes, sentiment scores, volume metrics, all of it becomes data other teams can use. Customer feedback appears on the same dashboards as operational metrics.
Weeks of lag → Hours of latency. AI processes feedback as it arrives. Themes update continuously. Dashboards refresh hourly or daily instead of quarterly. Stakeholders see current patterns, not historical snapshots.
Report-based distribution → Self-service access. Instead of pushing decks to stakeholders, they pull insights when needed. They filter by their segment, their timeframe, their priorities. The research team governs the analysis rather than bottlenecking every request.
DoorDash uses AI-powered analysis to detect emerging issues in real time across consumers, delivery drivers, and restaurant partners. They identify problems proactively before they escalate, a shift impossible with quarterly surveys.
Each row is a constraint the 2016 stack couldn't solve. AI and warehouse integration collapse all six at once, which is why the impact compounds.
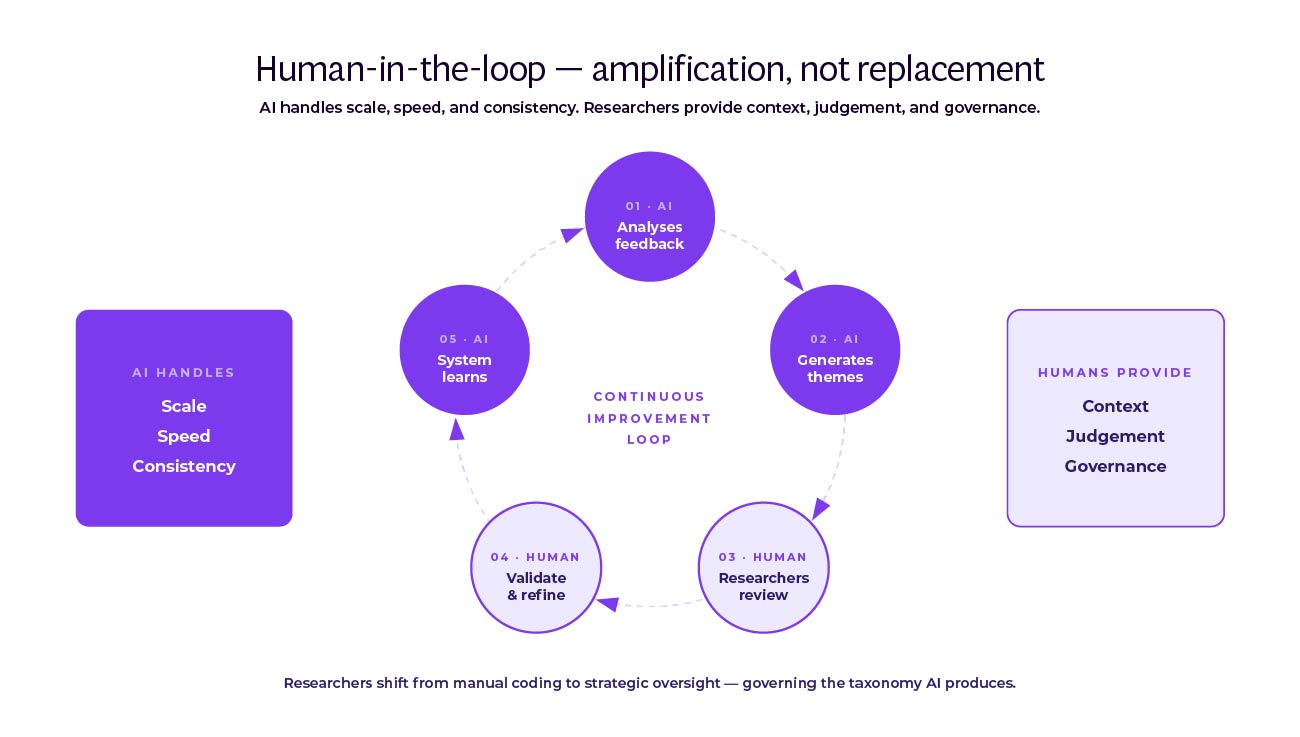
Human-in-the-loop: amplification, not replacement
AI doesn't replace research teams. It amplifies them. The technology handles scale, speed, and consistency. Humans provide judgment, context, and governance.
Here's what that looks like in practice. AI automatically themes incoming feedback and calculates sentiment. But researchers validate the themes. Does "app crashes" need to split into "crashes on iOS" and "crashes on Android"? Should "slow checkout" merge with "payment issues" or stay separate? These calls require business context AI doesn't have.
Researchers also guide the analysis. When a new theme emerges, they decide whether it matters enough to track separately or should roll up into an existing category. When sentiment seems ambiguous, they review examples and adjust the model. When stakeholders ask about a specific issue, they configure the system to surface relevant feedback.
The Theme Editor in platforms like Thematic makes this collaboration visible. Researchers see how AI categorized feedback. They can reorganize themes with drag-and-drop controls. They merge similar topics, split broad categories, or create new themes as needed. The AI learns from these changes, improving future analysis.
This transparency builds trust with stakeholders. They're not looking at a black box that produces mysterious scores. They can see the feedback that drives each theme, understand why it was categorized that way, and know a human validated the approach. The combination of AI speed and human judgment creates results neither could achieve alone.
A research director from a large IT and services organization using the approach explains: "As a natural language processing (NLP) tool, it's probably one of the best available. It gives us the ability to level up or drill down as deep as we'd like to without too much manipulation." This balance between automated analysis and human control proves critical for research teams who need both speed and the ability to validate findings.
Atom Bank unified feedback from 7 channels, using AI to process volume while researchers governed the taxonomy. They reduced calls by 40% on some topics and 69% on others by quickly identifying and addressing root causes.
AI is the engine; researchers are the steering. The loop is what keeps the taxonomy accurate, auditable, and trusted by stakeholders.
How platforms like Thematic enable this approach
Let's ground this in specifics. Modern VoC platforms demonstrate how AI plus human governance works in practice.
The process starts with data upload. Feedback channels connect through integrations: Zendesk for support tickets, Medallia for surveys, Trustpilot for reviews, Intercom for chat. Data flows automatically rather than through manual exports.
AI analyzes everything in real time. It identifies themes using natural language processing and deep learning, not keyword matching. It detects sentiment by understanding context, not counting positive and negative words. Themes and sub-themes organize automatically, showing which topics matter most.
The Theme Editor gives researchers control. They see the AI's work and can modify it. Merge themes that should combine. Split themes that mix distinct issues. Delete themes that don't matter. Create custom categories for company-specific topics. The platform learns from these changes.
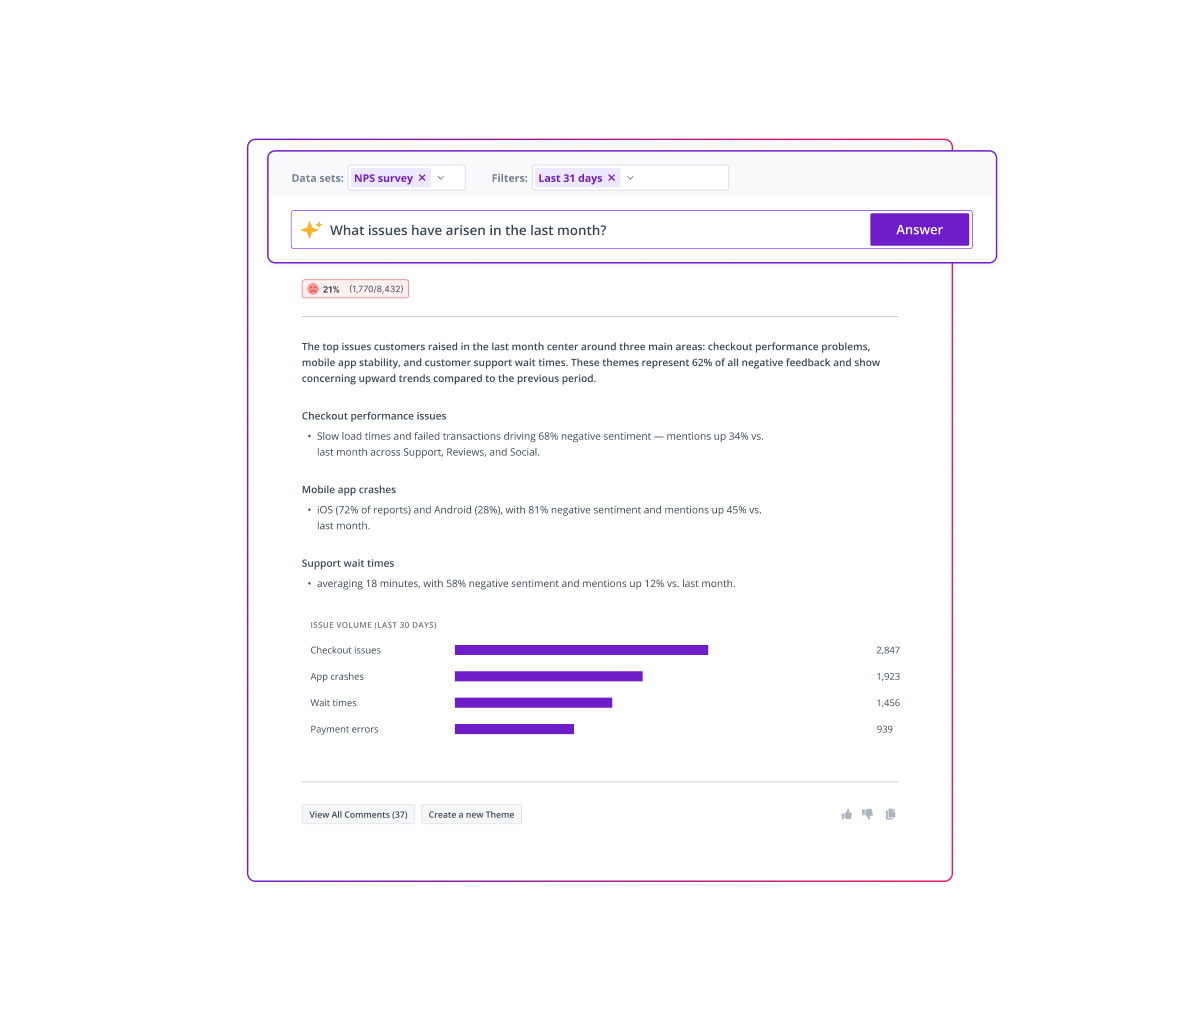
Thematic Answers provides natural language access for non-technical teams. Anyone can ask "What issues arose last month?" or "Why are customers churning?" and get AI-generated responses grounded in feedback data. This democratizes insights beyond the research team.
Integration with the data stack completes the loop. Themes, sentiment scores, and volume metrics flow to the warehouse as structured tables. From there, they connect to operational data and feed BI tools. Customer feedback becomes accessible wherever stakeholders work.
The quantified impact speaks clearly. One e-commerce F&B organization achieved $1.8M in incremental income over three years through improved customer experience. They automated 4,250 hours annually of data preparation, saved managers 2,000 hours through self-service access, and recaptured 320 research team hours by eliminating ad-hoc requests. The ROI was 543%.
These aren't projected savings. They're measured results from a Forrester Total Economic Impact study. The technology works, the business case closes, and companies are achieving results now.
Modernizing VoC isn't only a research win. Every team that already works from the warehouse gets a richer customer view without adding a new tool.
5. Making it happen
Getting buy-in from data and tool owners
Bringing VoC into the modern data stack is as much organizational as technical. You need buy-in from teams who don't report to you but whose cooperation determines your success.
Start with platform teams like data engineering and warehouse owners. They care about pipeline stability, cost management, and clear SLAs. Show them how integrating feedback reduces ad-hoc data pulls. Instead of handling special requests every time someone needs VoC data, they support a stable data product with documented schemas and refresh schedules.
Frame the value in their terms. This reduces pipeline churn. It eliminates one-off exports that break when source systems change. It creates predictable data that follows their governance standards. You're not asking them to add chaos; you're asking them to bring order to feedback data that already exists in the company.
Operations teams like Marketing Ops and Revenue Ops care about cleaner data and productivity. Lead with concrete outcomes: "reduce time-to-mitigation for top complaints by 30%." Show how VoC data connects to metrics they already track. Renewal rates. Case deflection. Average handle time. Cost-to-serve.
For contact center operations, the efficiency case is direct. RAC reduced call handling times by 30% using unified customer feedback in their data stack. When agents see feedback themes on the same screens as customer profiles, they resolve issues faster. When the system automatically routes high-priority feedback, fewer problems escalate.
Security and privacy teams worry about auditability and data minimization. Address their concerns upfront. Centralized storage in the warehouse actually improves governance compared to feedback scattered across systems. Access controls apply consistently. Data retention policies work uniformly. Audit trails track who accessed what. You're making their job easier, not harder.
BI and analytics teams want more data sources feeding their tools. They've been asked repeatedly why customer feedback doesn't show up in executive dashboards. They want to include it but can't easily access it. You're offering to solve their problem. Partner with them on dashboard design and they'll become advocates.
Modernizing VoC isn't only a research win. Every team that already works from the warehouse gets a richer customer view without adding a new tool.
Four implementation challenges and how to handle them
Challenge 1: Data privacy and security. Customer feedback often contains personal information. Moving it to the warehouse requires careful handling. Work with your privacy team to define what data moves and in what form. Personally identifiable information might need redaction or encryption. Some feedback might not move at all if it contains sensitive details.
The NIST Privacy Framework provides a useful baseline for managing privacy risk across diverse systems and stakeholders.
The solution is policy-driven data governance. Define rules for what feedback flows to the warehouse and what stays in the source system. Implement those rules in your data pipeline tools. Document everything. Show privacy and security teams you're taking their concerns seriously and implementing proper controls.
Challenge 2: Technical integration. Feedback sources don't always export data easily. APIs might be limited. File formats might be inconsistent. Your warehouse might not have tables designed for unstructured text. These are real but solvable problems.
Integration is like connecting different brands of smart home devices. Each speaks its own language, but once you set up the translation layer, they all work together.
Start with one feedback source. Get that working end-to-end before adding others. Modern integration tools like Fivetran and Airbyte have pre-built connectors for common feedback platforms. For sources without connectors, work with your data engineering team to build custom pipelines. Each source you connect makes the next one easier.
Challenge 3: Analyzing unstructured data at scale. Your warehouse can store text, but querying it efficiently requires thoughtful design. Themes and sentiment analysis generate derived data that needs updating as new feedback arrives. Your existing BI tools might not handle text search well.
This is where specialized text analytics platforms matter. They process the unstructured data and output structured results. Theme assignments, sentiment scores, key phrases, all of it becomes standard table columns. Your warehouse stores these derived insights, and your BI tools query them like any other data.
Challenge 4: Taxonomy governance and version drift. As products and services evolve, feedback changes. New themes emerge. Old themes fade. Different teams might use different terms for the same concept. Without governance, your taxonomy fractures and analysis becomes inconsistent.
Designate an owner for the feedback taxonomy. They review themes quarterly, merging redundant categories and adding new ones as needed. Modern platforms alert you when new themes emerge in feedback, making reviews faster. The key is treating the taxonomy as a managed asset, not something that drifts without oversight.
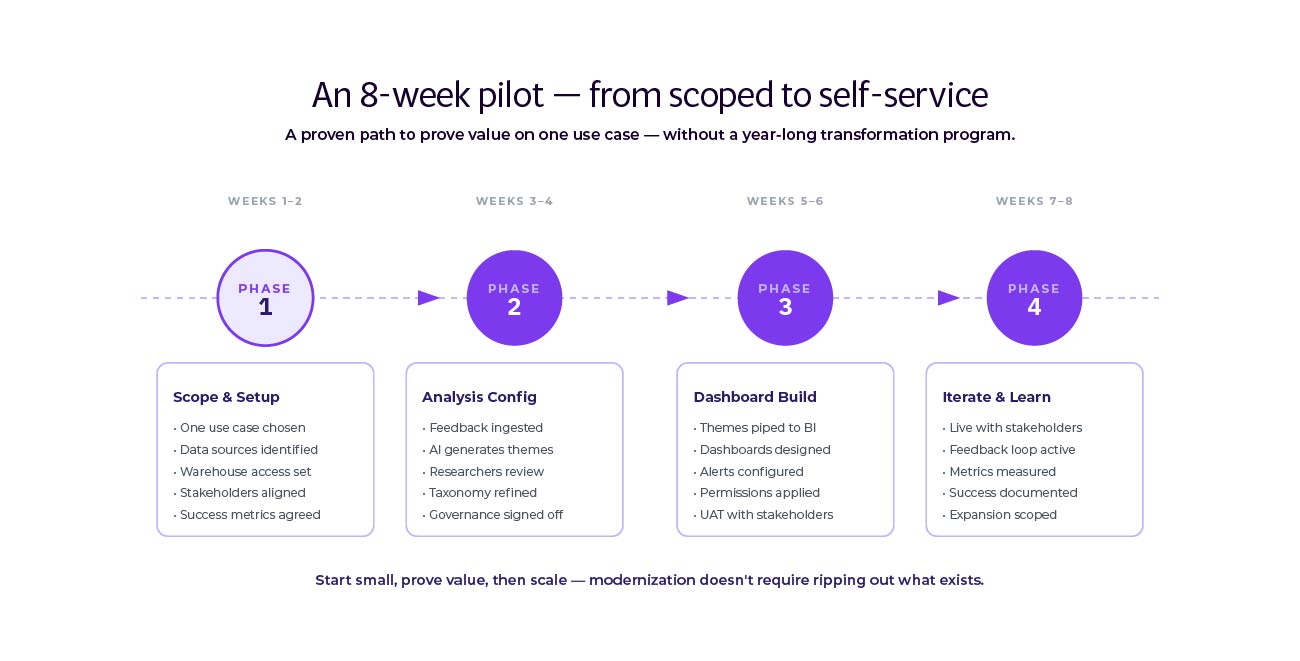
Running a successful 6-8 week pilot
Don't try to modernize everything at once. Run a focused pilot that proves value and builds momentum. Here's a timeline that works:
Weeks 1-2: Scope and setup. Choose one feedback source with high volume and stakeholder interest. Support tickets work well because they're continuous and stakeholders already wish they could analyze them better. Set up data pipeline from source to warehouse. This usually involves configuring an integration tool and defining target tables.
Weeks 3-4: Analysis configuration. Connect your text analytics platform to the warehouse. Configure theme detection for your chosen feedback source. Review the automatically generated themes with someone who knows the content. Merge, split, and refine until themes make sense. This is where human judgment shapes AI output.
Weeks 5-6: Dashboard build. Work with your BI team to create a dashboard showing theme volumes, sentiment trends, and example feedback. Make it filterable by date range, customer segment, and product line. Design for self-service so stakeholders can explore without asking for custom reports.
Weeks 7-8: Stakeholder feedback and iteration. Share the dashboard with a small group of stakeholders and organize a 30-minute enablement session to get everyone on board. Watch how they use it and note what questions or filters they need that you didn't include. Adjust based on their feedback. This iteration builds confidence and adoption.
Success in the pilot creates demand for more. Stakeholders who see value will ask why other feedback sources aren't included. Teams who don't have access will request it. This organic pull is more powerful than top-down mandates. Your pilot proves the approach works, and momentum builds naturally.
Prove value on one use case before scaling. Eight weeks is enough to ship a live dashboard and build the stakeholder pull that drives the rollout after it.
Pragmatic risks to watch for
Technology won't fix poor data quality. If your feedback sources collect inconsistent information, analysis will struggle. Garbage in, garbage out applies here. Before modernizing infrastructure, audit your collection process. Are survey questions clear? Do support agents use consistent categories? Is chat transcript quality sufficient for analysis?
Stakeholders might not use self-service tools. Some people prefer receiving reports to building dashboards. Don't assume everyone will embrace self-service just because you built it. Provide training. Create example dashboards they can copy. Offer to build custom views for high-value stakeholders. Self-service works best as an option, not a requirement.
Volume can overwhelm without prioritization. When you start analyzing all feedback, the volume of themes and insights can bury what matters. You need a framework for prioritization. What impacts revenue most? What creates operational cost? What affects many customers versus few? Build this prioritization into dashboards so the most important issues surface first.
Latency trade-offs matter. Some use cases need streaming insights; others work with daily syncs. Don't over-engineer real-time where near-time is enough.
Change management takes longer than technology. Getting data into the warehouse might take weeks. Getting stakeholders to trust and use the new insights might take months. Plan for this. Communicate frequently. Share early wins. Address concerns quickly. The technology enables change; people have to adopt it.
6. The evolving role of research
Proof: what actually changes when teams modernize
Research teams using AI-powered VoC analysis report dramatic efficiency gains. According to the Forrester TEI study, one organization recaptured 80% of their research team's time previously spent on ad-hoc requests. Analysts who spent weeks coding responses now spend hours validating automated themes. The time saved shifts to higher-value work: investigating root causes, designing targeted interventions, measuring impact.
LendingTree analyzed 20,000+ comments with zero setup time using AI-powered analysis. Research that would have required a team for weeks happened in hours. The speed enabled analysis that wouldn't have happened otherwise. Instead of sampling feedback or analyzing only the most recent batch, they could process everything.
Art.com democratized insights across their organization. Teams that never accessed VoC data before could now explore it themselves. Product managers filtered feedback by their features. Marketing teams segmented by campaign. Customer service leaders tracked trends in real time. The research team became consultants who helped others interpret data rather than gatekeepers who controlled access.
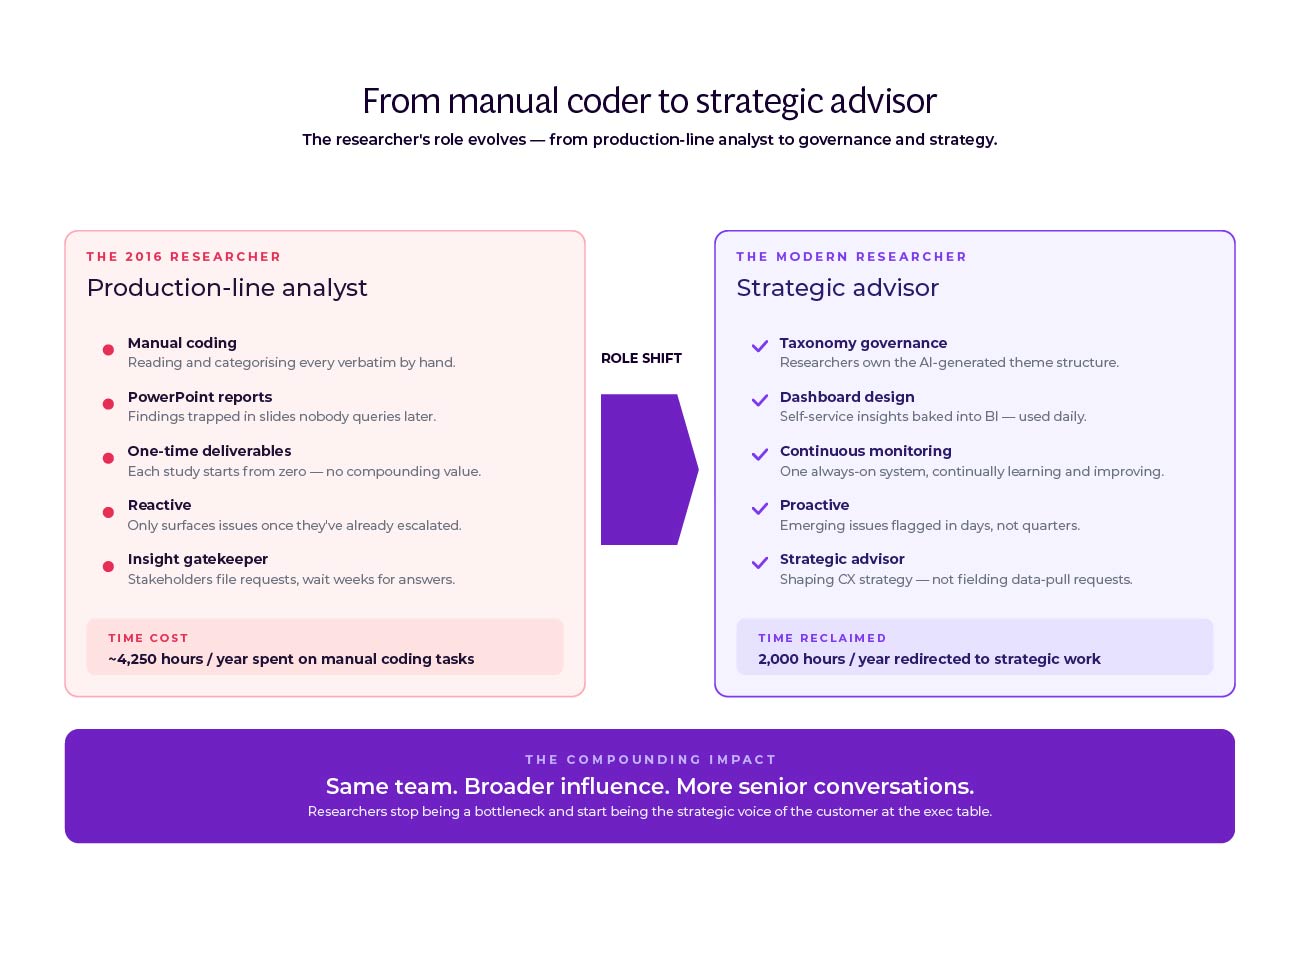
The pattern repeats across companies. Research teams shift from manual execution to strategic oversight. Less time coding responses, more time designing measurement frameworks. Less time building reports, more time advising stakeholders on interpretation. Less time as bottleneck, more time as enabler.
From execution to governance
Here's what research roles look like after modernization:
You design the measurement strategy. What feedback sources matter most? Which themes should you track across the business versus within specific functions? How should sentiment scoring work for your industry? These questions require research expertise. AI can't answer them.
You govern the taxonomy. New themes emerge continuously as feedback changes. You decide which ones matter enough to track separately. You maintain consistency so "checkout problems" doesn't become three different themes across three different teams. You make judgment calls about ambiguous feedback that could fit multiple categories.
You validate AI outputs. Automated theme detection performs well but isn't perfect. You spot-check results, looking for patterns the AI missed or categories that need refinement. You're the quality control that keeps analysis accurate and trusted.
You enable stakeholder self-service. Teams have questions the dashboard doesn't answer. You help them explore data, interpret patterns, and connect feedback to operational metrics. You're still the expert on customer voice, but now you advise rather than execute every analysis.
You connect insights to action. When themes spike or sentiment shifts, you work with stakeholders to understand why and what to do about it. You help product teams prioritize based on feedback volume and impact. You guide operations on root cause analysis. You frame findings in ways that drive decisions.
This shift requires new skills. Less manual coding, more data governance. Less report building, more storytelling and influence. Less time alone with data, more time collaborating with stakeholders. The role becomes more strategic, more visible, more impactful.
The team doesn't shrink, it levels up. Hours spent coding verbatims convert into hours shaping CX strategy, and researchers become the strategic voice of the customer at the exec table.
The next frontier: Predictive and prescriptive insights
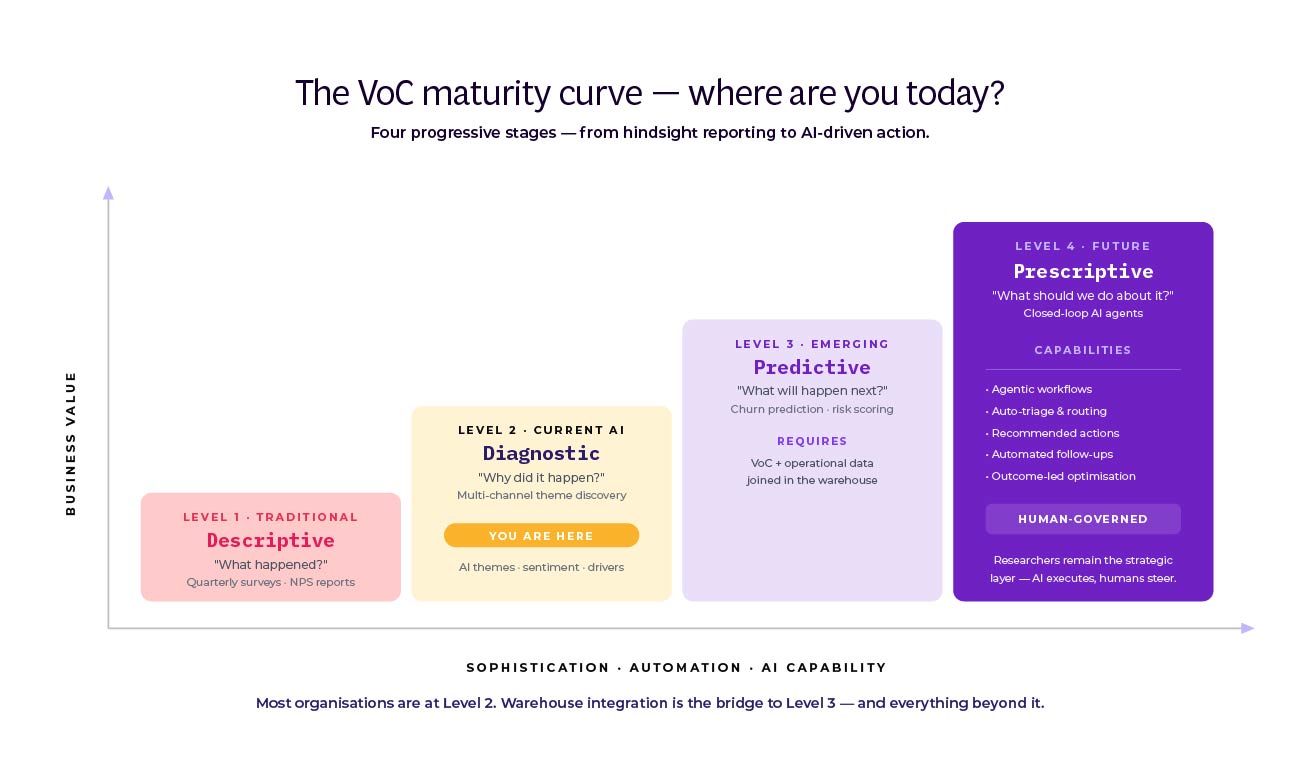
Current VoC programs are diagnostic. They tell you what customers said and how they felt. AI and modern data architecture enable something new: predicting what will happen and prescribing what to do.
Predictive models can identify customers likely to churn based on feedback patterns. Not just the detractors, but the customers whose feedback shows specific warning signs. "Inconsistent quality" plus "considering alternatives" plus declining engagement predicts churn better than an NPS score alone.
You can forecast operational load. If complaint volume about a topic is accelerating, predict when it will overwhelm your support team. This gives operations time to prepare, cross-train agents, or escalate to engineering for a fix.
You can optimize interventions. Test different responses to feedback and measure which approaches improve outcomes. When a customer complains about pricing, does a discount work better than education about value? When they report a bug, does a proactive update satisfy them or should an engineer call? The data tells you.
Prescriptive insights go further. The system doesn't just predict churn, it recommends retention actions for specific customers. It doesn't just forecast support volume, it suggests staffing adjustments. It doesn't just identify dissatisfaction, it routes feedback to the team best positioned to address it.
Tools that enable AI search over governed feedback stores, lightweight agents that watch segments for emerging issues, and privacy-preserving learning on redacted text are all becoming standard capabilities.
According to recent research on CX AI adoption, businesses are investing heavily in customer feedback analysis as a core AI use case. The technology is moving from diagnostic to predictive to prescriptive, and companies see measurable returns.
Most organizations plateau at Level 2 because their feedback data never reaches the warehouse. Warehouse integration is what makes predictive and prescriptive possible.
Don't let VoC fall behind
Every other function in your company modernized its data infrastructure. Finance, sales, marketing, product, operations, they all moved to integrated, real-time, self-service systems. VoC programs that don't follow will become increasingly marginalized.
This isn't about keeping up with competitors. It's about staying relevant in your own organization. When stakeholders expect instant access to data and VoC still produces quarterly reports, they'll stop waiting for your insights. When other teams can answer their own questions with dashboards and VoC requires custom requests, they'll stop asking.
The technology exists. AI handles scale. Modern data stacks provide integration. The business case closes with quantified ROI. The only question is timing: will you modernize now while you can shape the approach, or later when stakeholders have already found workarounds?
Research teams that move first become strategic partners. They help the organization understand customers at a depth and speed impossible before. They enable product teams to ship with confidence, support teams to resolve issues proactively, and executives to make customer-informed decisions.
The 2016 playbook served you well. But it's 2026. Your customers expect responsiveness. Your stakeholders expect integration. Your business expects impact. Modernizing your VoC program isn't optional anymore. It's how you stay relevant, trusted, and valuable to the organization you serve.
Share
Link Copied!
Request a demo of Thematic's Customer Intelligence Platform
Thematic turns fragmented feedback into one consistent source of customer truth — so every team acts on the same customer story. Up and running in days, not quarters.
Thank you! Your submission has been received!
Oops! Something went wrong while submitting the form.

.jpg)


.jpeg)