Enterprise vs SMB Customer Feedback Analysis: How to Find Your Critical Priorities
Your enterprise and SMB customers don't experience the same problems the same way. A complaint from 8% of enterprise accounts can cost 15 NPS points, while a complaint from 45% of SMB customers costs only 0.5 points. Learn the 3-step framework to stop prioritizing by volume and start prioritizing by segment-specific impact.
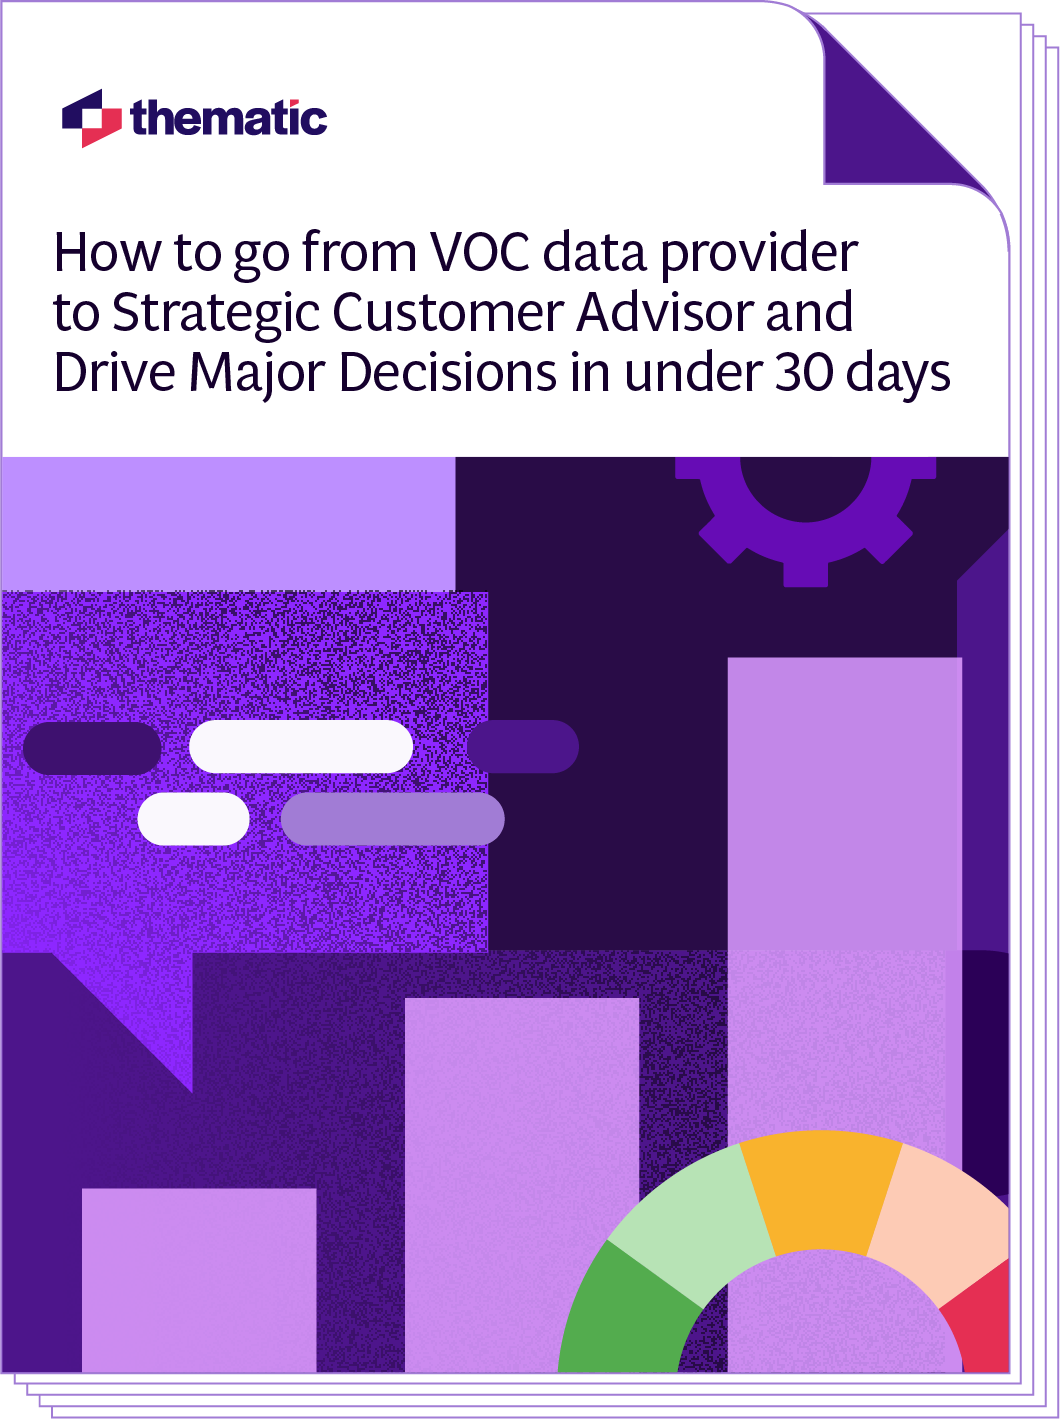
From Ignored to Indispensable: The Proven, Step-by-Step CX Insights Mastery Blueprint in < 6 Days!
This free, 6-day email course walks through a proven process to turn customer feedback into career growth, strategic influence, and a seat at the executive table in 30 days.
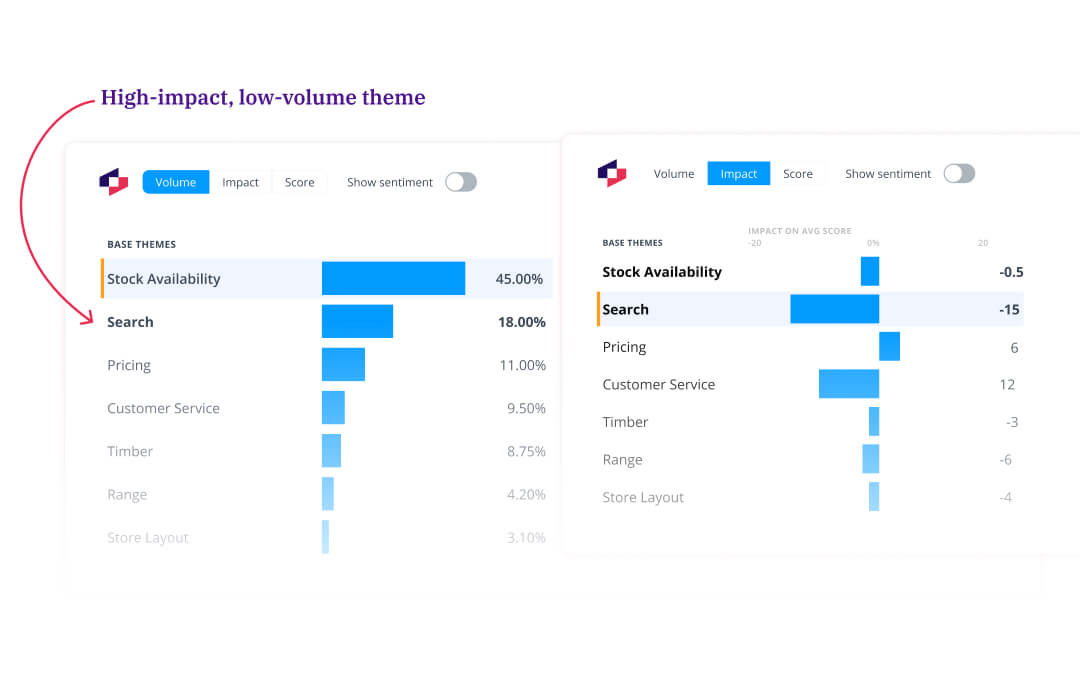
Your enterprise customers ($50K/year) and SMB customers ($500/month) don't experience the same problems the same way.
A complaint mentioned by 8% of enterprise accounts can cost -15 NPS points, while a complaint mentioned by 45% of SMB customers costs only -0.5 points.
This guide shows you how to stop prioritizing by volume and start prioritizing by segment-specific impact.
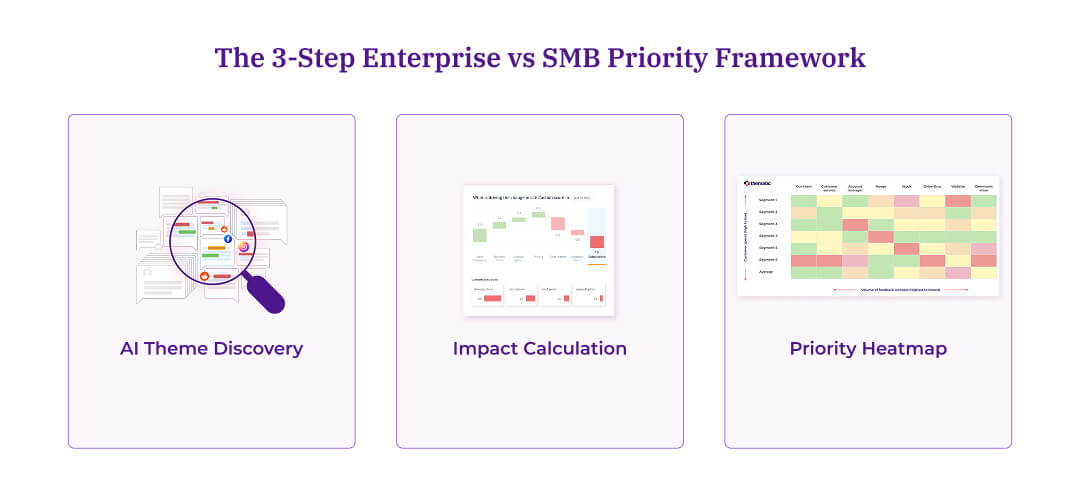
You'll learn the 3-step framework (AI theme discovery → impact calculation → priority heatmap) that helped Mitre 10 find $4.8M in opportunities, OrionAir gain 1.6 NPS points, and Greyhound cut analysis time from 3 weeks to 2 minutes.
Includes decision tables for prioritizing enterprise critical vs. SMB critical issues.
20,000 comments per month. 84 stores. Zero clarity on which segment was bleeding revenue.
Mitre 10 collected feedback across every channel. They had dashboards. They had processes. They closed the loop on complaints.
Yet their CMO (Chief Marketing Officer) couldn't answer one question: "What are our customers actually telling us?"
The problem wasn't volume. It was segmentation.
Their enterprise accounts (trade builders constructing homes from scratch, representing their highest-value customers) struggled with critical website issues that made product sourcing nearly impossible.
Meanwhile, their SMB customers (retail DIY customers) found the same website simple and easy to use.
Stock availability cost half an NPS point overall. But for enterprise trade customers building new homes, the impact hit harder, right when Mitre 10 was launching a new trade growth strategy.
Without segment-level analysis, leadership would have missed both insights entirely.
Keep reading to learn how to identify which segment complaints actually damage your business.
You’ll also learn:
How Mitre 10 found a hidden website problem affecting its highest-value builders
How Greyhound cut analysis time from 3 hours-3 days down to 2 minutes, spotting terminal issues in real time
How OrionAir uncovered a low-volume complaint that drove a 1.6-point NPS lift and contributed to a 13% NPS increase overall
A practical enterprise vs SMB priority grid you can use to rank every issue by impact and segment value
The enterprise-SMB blind spot: Why teams fix the wrong problems
They had done the "right" things. Comprehensive retail and trade feedback systems. Closed-loop processes. Brand alignment with "With You All the Way."
They were collecting 20,000 comments per month across 84 stores.
Yet their CMO still couldn't answer what customers were telling them. As she puts it: "I still don't feel like I know what's going on with our customers."
Their insights team couldn't read thousands of comments each month. Store teams had a feel for local feedback, but no coherent story emerged at the strategic level.
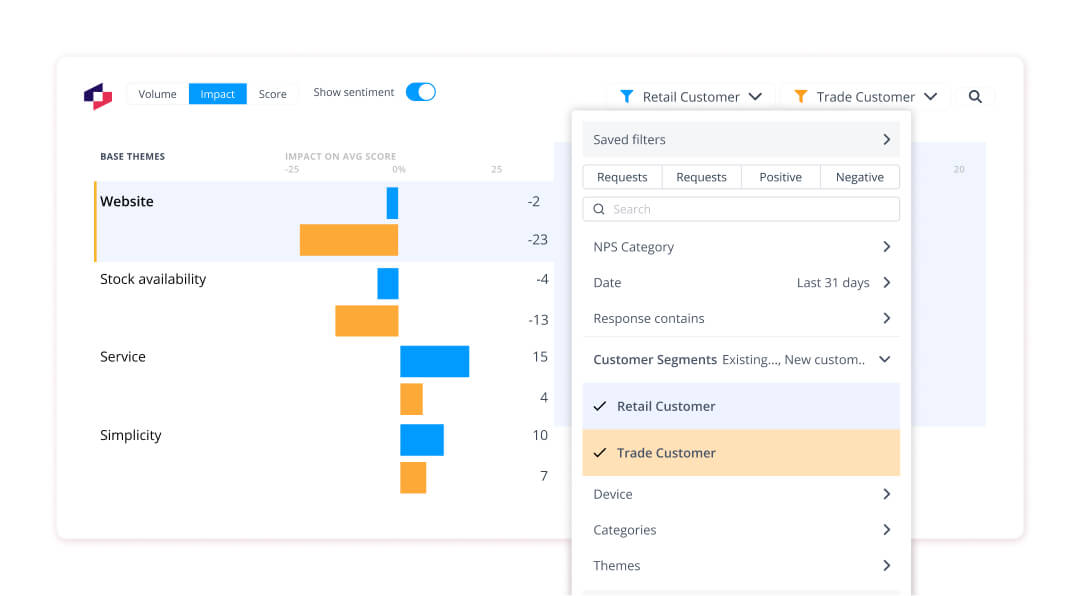
Once Thematic ran segment comparison analysis, the picture shifted:
The website was particularly problematic for builders constructing homes from scratch, their most valuable customer segment. For retail customers, the same website felt simple and easy to use, a clear strength to protect.
Stock availability cost half an NPS point overall, at the exact moment Mitre 10 was building a new trade strategy.
Stock availability wasn't just a noisy complaint. It was a strategic trade priority that supported a core commercial initiative.
"This insight helped us prioritize not just what to fix, but who we were fixing it for."
The lesson is simple: Your loudest segment complaint is not always your most important business problem.
The real cost of segment-blind analysis
Mitre 10's story is not unusual.
Across millions of feedback comments, we see the same pattern.
Teams treat all complaints the same way. A complaint from a $500 per month retail customer gets the same urgency as a complaint from a $50,000 per year trade account. Dashboards show aggregate themes and mention rates, but hide who is actually affected.
When you ignore segments, you see "product search issues: 8% mention rate" without realizing 95% of those comments come from your highest-value customers.
Before Thematic, their post-trip survey had 30-35 questions with long free-text responses. Manual feedback analysis took about 80% of one analyst's job and 3 hours to 3 days per cycle.
By the time results were compiled and shared, the data was already 3-4 weeks old. Station managers had no way to see issues that occurred outside 8 AM-5 PM office hours. As Matthew Schoolfield, Senior Customer Insights Analyst at Greyhound, explains:
"Previously, only one person, myself, would manually analyze the feedback. It was about 80% of my job, and would take me from 3 hours to 3 days. By the time we had manually compiled the results and sent them out, the data was already 3-4 weeks old."
After implementing Thematic's automated segmentation and dashboards, station managers in locations like New York can see comments for their station in near real time. They no longer need to email analysts or dig through 100-150 surveys per day to find issues.
Problems such as cleaning issues at specific terminals now surface within 2 minutes.
Schoolfield's summary is clear: "Thematic allows us to identify issues and distribute them to our station managers in real time. It's invaluable, as we can get the data into the hands of our employees easily."
This is what segment-aware, impact-aware analysis changes.
You stop acting on stale, aggregate data and start acting on live, segment-specific intelligence.
What makes segment analysis actually work
Once you understand the problem, the next question is obvious: How do you actually analyze segments in a way that leads to better decisions?
Most teams rely on three common methods.
Method 1: Manual spreadsheet segmentation
Export feedback into CSV. Manually tag by customer type. Build pivot tables and charts to spot patterns.
This usually takes 2-3 weeks and depends heavily on analyst capacity and spreadsheet skills.
By the time you have answers, the opportunity has often moved.
Method 2: Volume-based dashboards
Tools show mention rates and theme counts by segment. "Trade customers mention billing 23% of the time, retail customers mention it 18%."
This is a useful start, but volume alone does not tell you which complaints hurt NPS, revenue, or retention.
Method 3: Ad hoc consultant reports
You commission a one-off deep dive. The report arrives 4-6 weeks later. The team has already moved to new priorities, and the insights feel outdated.
All 3 methods have the same flaw: they treat analysis as a slow project, not a live system.
What actually works is different.
Automated segment comparison that links specific complaints to business metrics for each customer type, in near real time.
That is how enterprise teams move from "interesting themes" to critical priorities.
The 3-step enterprise vs SMB priority framework
Here is the simple 3-step approach our customers use to find their true priorities across enterprise and SMB segments.
Step 1: Automatic theme discovery by segment
Instead of manually categorizing thousands of comments, use AI to identify what each segment is actually talking about.
Mitre 10 imported feedback from multiple sources across its 84 stores.
Trade accounts (enterprise customers) focused on website functionality and stock availability. Retail DIY customers (SMB segment) focused on service, local presence, simplicity, and ease.
Without segment separation, these nuances would be buried in aggregate scores.
Leadership would see "website is fine overall" and miss the fact that builders, their highest LTV segment, were struggling to complete key tasks.
Step 2: Impact analysis within each segment
Once you know what each segment talks about, the next step is understanding what actually matters to your business outcomes.
This is where most teams fail.
They assume high-volume complaints equal high-priority problems.
Segment
Theme
Volume
Impact
Priority
Trade (enterprise, high LTV)
Website search
Lower mentions
Critical friction for builders trying to source products
High
Retail DIY (SMB)
Website search
Lower mentions
Minimal issues reported
Low
Trade (enterprise)
Stock availability
Frequently mentioned
Half an NPS point drag overall, higher for trade builders
High
Retail DIY (SMB)
Stock availability
Frequently mentioned
Noticeable, but less critical
Medium
Two important insights stand out.
Website search issues were critical for trade (enterprise), but the same feature worked acceptably for retail (SMB).
Stock availability affected both segments, yet the impact on trade customers tied directly to strategic growth plans.
After a system migration, dashboards showed a surge in generic service issues. It looked like the obvious focus.
Impact analysis told a different story.
Baggage handling was not the most frequently mentioned issue. It had a disproportionate negative impact on NPS and customer lifetime value. 80% of baggage-related problems were operationally fixable.
With this clarity, leadership shifted investment towards baggage handling improvements.
The results: 1.6-point NPS increase from baggage improvements alone, contributing to a 13% NPS increase overall. A measurable revenue boost from better retention and fewer negative experiences at a high-risk touchpoint.
OrionAir's insights team summed it up: "What's remarkable isn't just that we improved NPS. It's that we became more efficient in the process. Thematic helped us invest smarter, not just more."
The pattern is clear: The most frequent complaint and the most damaging complaint are rarely the same issue.
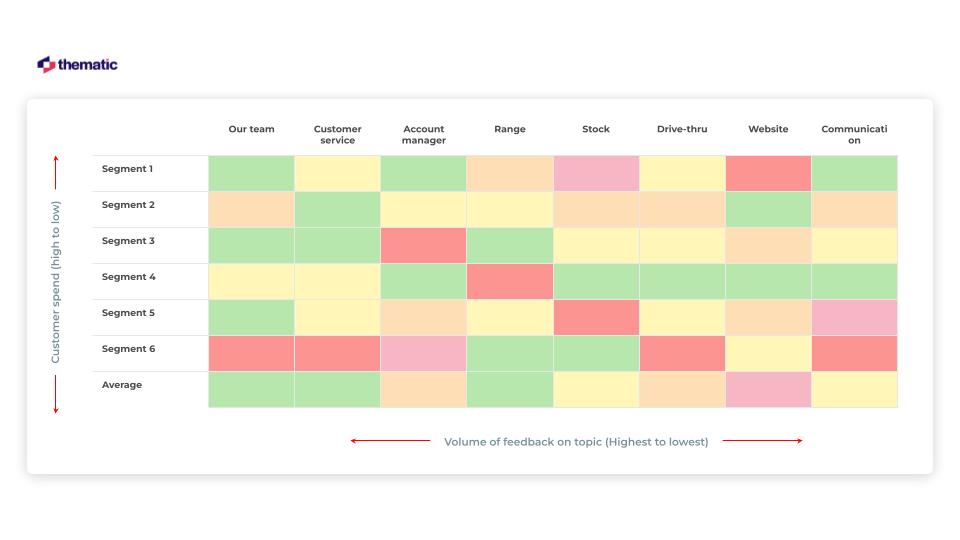
Step 3: Build the priority heatmap
Data alone does not move a roadmap.
Executives need to see priorities in a format that makes decisions obvious.
This is where a segment-by-theme priority heatmap works well.
Structure it like this:
X-axis: Customer segment (for example, Trade vs Retail, or Enterprise vs SMB)
Color: Impact score, not volume (Critical, High, Medium, Low)
Mitre 10's heatmap made the story clear:
Critical (red)
Trade customers: Website search functionality
Retail customers: None in the critical range
High priority (orange)
Trade customers: Stock availability
Retail customers: Service quality and local presence
Medium priority (yellow)
Trade customers: Service quality
Retail customers: Simplicity, ease, convenience
This visual did three things in one view.
Showed that trade complaints had outsized business impact, even when overall scores looked stable.
Protected strengths by making visible what both segments already loved.
Gave leaders a defensible case to reallocate resources toward trade-focused fixes.
The outcome:
Primary focus: Website search improvements for trade customers
Strategic priority: Stock availability improvements to support the new trade strategy
Maintain strengths: Simplicity and ease for both segments
Executives were not just told what to fix.
They could see who they were fixing it for, and why that sequence made sense.
What segment prioritization actually achieves
Segment-based impact analysis is not an abstract framework.
Across customers, we see consistent, measurable outcomes.
Mitre 10
Moved from "we still don't feel like we know what's going on with our customers" to a clear, segment-level story.
Identified that the website experience was particularly problematic for builders constructing homes from scratch, their highest LTV segment, while retail customers navigated the same system without major issues.
Used Thematic to support OKRs where customer experience is a top-level objective, linking high-level NPS targets to specific work-ons for agile teams.
Thematic has helped them humanize hardware, ensuring the voice of their customers informs every aspect of their business, from strategic planning to day-to-day operations.
Greyhound
Shortened surveys from 30-35 questions down to a compact format, supported by reliable verbatim analytics.
Replaced manual analysis that consumed 80% of one analyst's time with an AI-powered workflow.
Gained the ability to spot issues at specific stations within 2 minutes, instead of after 3-4 weeks. Freed up enough capacity to launch four new research projects that had been delayed for months.
Schoolfield's verdict: "Thematic is saving 50% of my time, it reduces my analytics time tenfold. This is the tool of the future for us."
OrionAir
Built a model linking NPS drivers directly to revenue and retention, so CX and commercial teams could prioritize initiatives with confidence.
Found that baggage handling, though not the top-volume complaint, delivered the biggest negative NPS impact, with most issues operationally fixable.
Implemented targeted operational changes that delivered a 1.6-point NPS increase from baggage improvements alone, supporting a 13% NPS increase overall driven by fewer delays, fewer cancellations, and better baggage reliability.
Across these examples, the pattern is consistent.
Segment-level impact analysis turns feedback from a noise problem into a priority system.
The enterprise vs SMB priority grid
To make segment prioritization systematic rather than ad hoc, you need a simple decision framework.
Use this two-axis grid to classify every issue:
Axis 1: Business impact (per theme within segment)
Critical: Impact greater than 10 NPS points or significant revenue risk
High: 5-10 point NPS impact
Medium: 2-5 point NPS impact
Low: Less than 2 point NPS impact
Axis 2: Segment value
Enterprise: High contract value, complex needs, higher expansion potential
Your enterprise and SMB customers do not experience your business the same way.
The same complaint from different segments can have completely different business consequences.
If you optimize for complaint volume alone, you overinvest in loud issues that have limited impact. You underinvest in quiet problems that silently erode your most valuable relationships.
A better approach: Stop optimizing for aggregate volume across all customers. Start prioritizing by impact within the segments that matter most to your business.
The most important issues are rarely the loudest ones.
Your biggest opportunities often sit inside feedback from your highest-value segment, hidden in low-volume but high-impact complaints.
Thematic has helped companies like Mitre 10, Greyhound, and OrionAir move from "we have data but no story" to segment-level, revenue-aware priorities backed by quotes, metrics, and clear methodology.
Request a demo of Thematic's Customer Intelligence Platform
Thematic turns fragmented feedback into one consistent source of customer truth — so every team acts on the same customer story. Up and running in days, not quarters.
Thank you! Your submission has been received!
Oops! Something went wrong while submitting the form.