Understanding your customers is the key to a better business. That’s what customer insights research is all about—collecting and analyzing feedback to uncover what people truly think, feel, and need. It helps you turn those insights into actions that improve your product, service, and overall customer experience.
So, how do you uncover these customer insights? Here are 10 proven methods to help you gather and apply customer feedback to make smarter, more data-driven decisions:
Surveys and questionnaires – Get structured feedback at scale.
Focus groups – Gain deeper insights through small group discussions.
Social listening – Monitor online chatter for real-time sentiment.
Net Promoter Score (NPS) – Measure loyalty and ask why.
Customer journey mapping – Visualize key moments in the customer experience.
Feedback analysis – Review support tickets, reviews, and chat logs.
Behavioral analytics – Understand what users do, not just what they say.
A/B testing – Test and validate changes before going all in.
AI and predictive analytics – Use smart tools to find patterns and forecast behavior.
Aligning insights with strategy – Use your findings to drive real business impact.
We’ll break down each method and show you how to use it with clear, real-world examples. By the end, you’ll be ready to turn feedback into powerful actions that drive growth.
1. Conducting Surveys and Questionnaires to Gather Structured Feedback
Surveys are one of the most popular ways to collect customer insights. They let you ask many people the same questions, so you can gather structured feedback at scale.
Think of a survey as a conversation where you get to ask customers about specific topics—from rating their satisfaction to giving suggestions. Because surveys produce quantitative data (like ratings on a 1–5 scale or multiple-choice answers), they make it easier to spot patterns and trends across your entire customer base.
Why Surveys Are Effective
They’re great for measuring things like customer satisfaction and identifying common pain points. For example, a restaurant might send a post-meal survey asking customers to rate the food, service, and ambiance. If 80% of respondents rate the service 5/5 but only 3/5 for ambiance, it’s a clear sign that the atmosphere (perhaps noise or decor) needs attention. Surveys help turn subjective feelings into data that you can act on.
Tips for Better Surveys
Keep them short and focused. Ask clear questions that your target audience will understand.
It’s often useful to include a mix of question types—some closed-ended (yes/no or rating scales) for easy analysis and some open-ended questions for richer insight.
For instance, after a multiple-choice question about overall satisfaction, you can ask “What’s one thing we could do better?” That open-ended follow-up lets customers explain their thoughts in their own words, revealing details and consumer insights you might have missed.
Modern survey tools and text analytics software can then help you analyze these free-form answers (using techniques like sentiment analysis or theme detection) to extract actionable insights.
Finally, remember to actually use the data! Survey results won’t help if they just sit in a spreadsheet. Share the findings with your team. If customers are unhappy with delivery times, for example, the operations team should know so they can work on improvements. Surveys give you a voice of customer at scale—making sure that the business decisions you make are grounded in real customer input.
2. Using Focus Groups to Uncover Deep Customer Perspectives and Opinions
While surveys give you broad data, focus groups go deeper. They let you sit down with a small group of customers (usually 5–10) and have a real conversation about your product, service, or idea. You get to hear people’s unfiltered thoughts, emotions, and even body language—all of which can be incredibly insightful.
Focus groups help you understand why people think and act the way they do. For example, imagine a software company holding a focus group and discovering that multiple participants found the app’s navigation confusing. You wouldn’t get that level of detail from a satisfaction score alone.
They’re especially helpful when exploring new ideas, testing product concepts, or digging into open-ended survey responses. Plus, hearing real customer stories can build empathy across your team.
Here’s how focus groups compare to surveys:
Less; participants complete at their convenience
More; requires scheduling and conducting group sessions
Depth of Insight
Broad; identifies trends and general patterns
Deep; explores motivations, attitudes, and perceptions in detail
Flexibility
Low; fixed questions limit exploration of unexpected topics
High; discussions can adapt based on participant responses
Anonymity
High; encourages honest and candid responses
Lower; social dynamics may influence participant openness
While focus groups don’t scale like surveys, they’re a powerful complement. You might survey 500 customers to spot a pattern, then use a focus group to understand the “why” behind it.
Just be sure to run them with a skilled facilitator and a clear goal. Done well, they can reveal insights you’d never catch with data alone.
3. Leveraging Social Listening to Analyze Real-Time Customer Sentiment
Not all feedback comes directly to you. With social listening, you monitor online conversations—on platforms like X, Reddit, and review sites—to see what customers are saying about your brand, products, or competitors. It’s a way to tune into the unfiltered voice of the customer in real time.
Customers often share opinions online that they might never put in a survey. If several people post about slow shipping or praise a feature, that’s valuable feedback you didn’t even have to ask for. And since it’s happening in public, it can influence how others see your brand, too.
What makes social listening so powerful is that you can:
Spot issues early (before they snowball)
Pick up on trends and emerging pain points
Learn how customers talk about your product (useful for marketing and messaging)
And it’s not just about tracking mentions. The real value comes from analyzing those conversations for patterns, themes, and sentiment. For example, a spike in negative tweets about your checkout process might reveal a bug—or confusion you need to fix.
The good news? You don’t have to comb through every post manually. Tools like Thematic automate analysis of social listening by using AI to surface recurring themes and analyze sentiment across social media, reviews, and forums. Thematic can help you quickly understand what customers love, where they’re frustrated, and what’s trending—so you can respond faster and smarter.
Social listening is like having a direct line to the customer’s uncensored thoughts. When combined with your survey and support data, it rounds out the picture—helping you make decisions based on what customers say when they think no one’s watching.
4. Applying Net Promoter Score (NPS) To Measure Customer Loyalty
You’ve probably seen this question: “How likely are you to recommend us to a friend?” That’s the Net Promoter Score (NPS) in action. Customers rate you on a scale from 0–10, and their answers fall into three categories:
Promoters (9–10): Loyal fans
Passives (7–8): Neutral
Detractors (0–6): Unhappy customers
Your NPS is the percentage of promoters minus detractors. It gives you a quick snapshot of overall loyalty—but the real magic lies in the follow-up question: “Why did you give that score?”
That’s where you get the customer feedback that matters most. Maybe someone rated you a 5 and said, “Shipping was slow and support didn’t respond.” Or a 10 with, “Super easy to use and your team is awesome.” These responses give you direct, actionable insights into what’s driving loyalty—or turning people away.
Want to take it a step further? Use text analytics software to analyze those open-ended comments at scale. Platforms like Thematic automatically surface themes, so you can spot issues like pricing concerns or feature requests and see how they impact your score.
Take Vodafone New Zealand, for example. They used Thematic to analyze thousands of NPS comments, quickly identifying key customer pain points. According to Tania Parangi, Vodafone’s NPS Manager, this approach was transformative:
“We’re on a mission at Vodafone to transform customer experience... to deliver experiences our customers really love, we need data and insights, which is where Thematic comes in. Thematic helps us identify themes in customer feedback and clearly show us the positive and negative impact of the changes we’re making, so we can adapt and refine in real time.”—Tania Parangi, Vodafone NZ
With Thematic, Vodafone could pinpoint specific pain points and address them quickly. In fact, after 9 months of using this insights-driven approach, they saw a significant increase in their NPS and a solid return on investment from improving the customer experience.
💡
Takeaway: Don’t just collect NPS scores—act on them. Reach out to detractors, thank promoters, and track how your changes impact the score over time. NPS gives you a simple metric to share, but it’s the comments behind the numbers that point you to what really needs improving.
5. Implementing Customer Journey Mapping to Identify Touchpoints and Pain Points
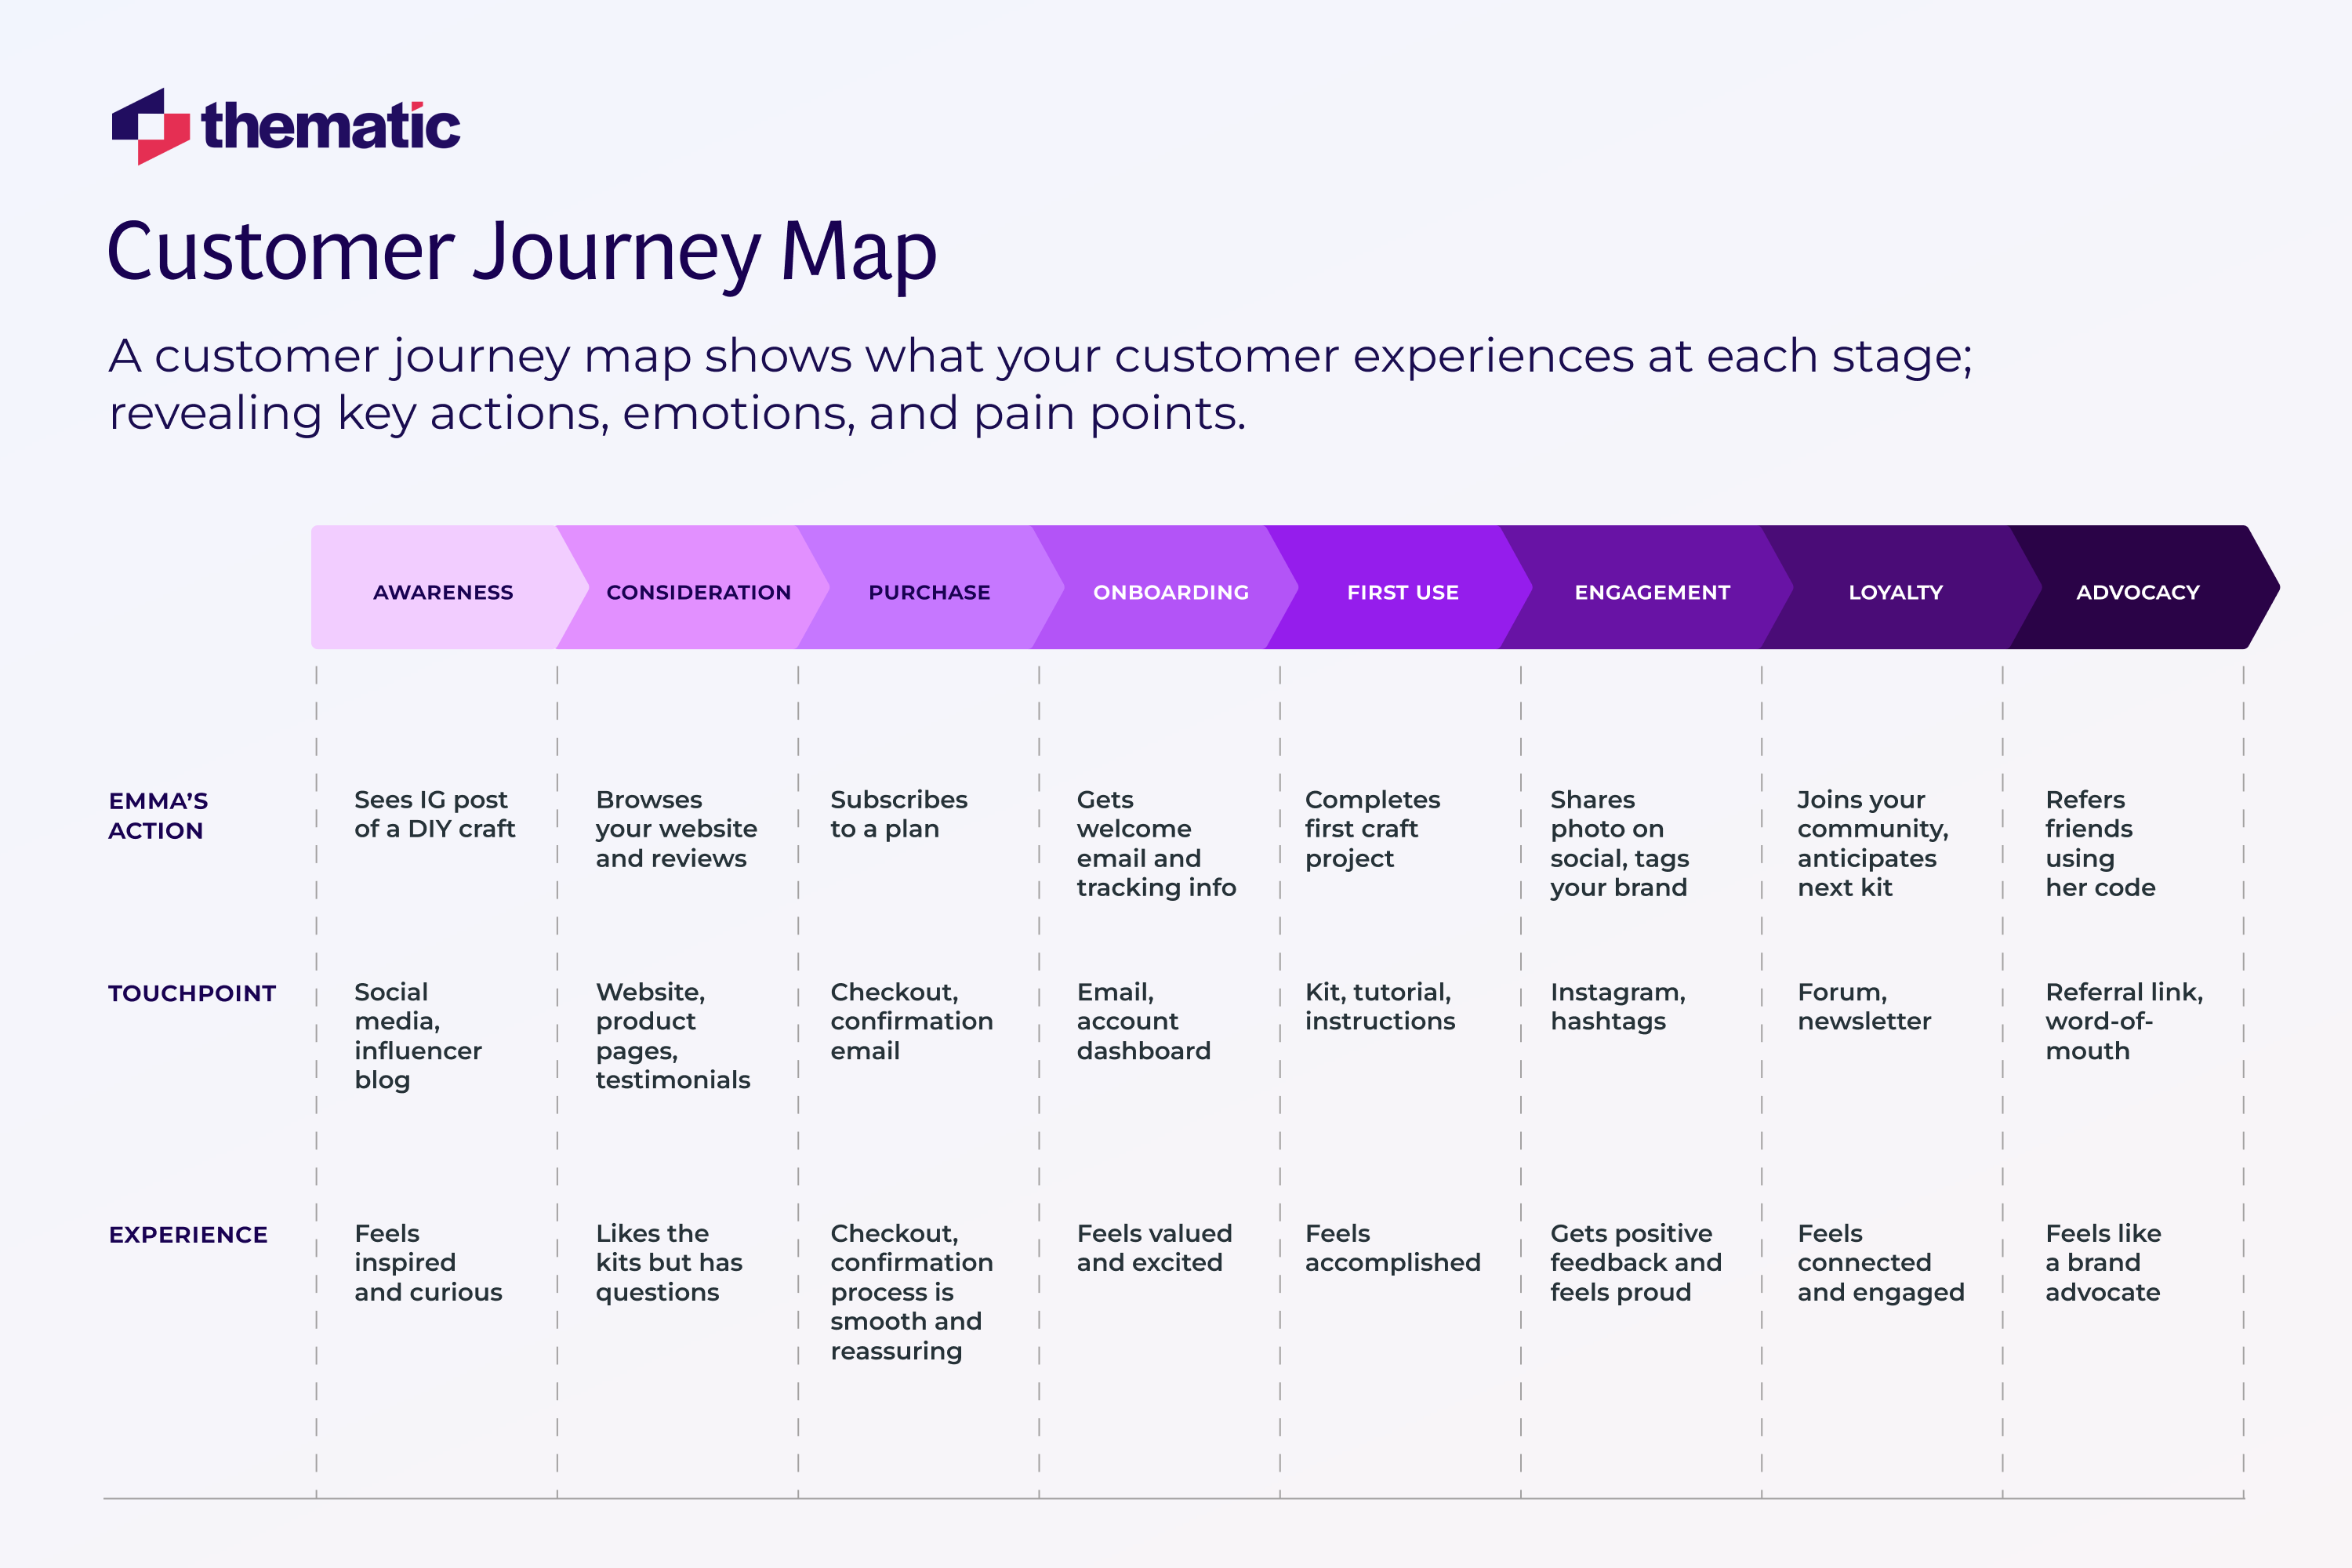
A customer journey map helps you step into your customer’s shoes and see every interaction they have with your business—from first discovering you to becoming a loyal advocate. It’s a visual tool that reveals what customers are thinking, doing, and feeling at each stage—and where they might hit pain points.
Why bother mapping the journey? Because it uncovers blind spots. You might think your sign-up process is smooth, but a journey map could show that customers often drop off because of a confusing form. It connects the dots across departments—what looks fine in isolation can feel clunky as a full experience.
How to Create a Journey Map (Simple Steps)
Creating a journey map doesn’t need to be complicated. Think of it as a timeline of your customer’s experience, highlighting key stages and how they feel at each step.
Here’s a simpler way to approach it:
Map the Key Stages: Identify major steps in your customer’s experience—like Awareness → Consideration → Purchase → Onboarding → Use → Support → Loyalty.
List Key Interactions: For each stage, note where and how the customer interacts with your brand (e.g., ad click, signup page, support email).
Capture Customer Experience: Add what they might be thinking or feeling—confused, excited, frustrated? Include any relevant feedback or drop-off data.
Highlight Pain Points: Look for friction—long wait times, confusing pages, missing info—and call those out.
Spot Moments That Work: Don’t forget what’s working well, like a smooth onboarding flow or a helpful chatbot. These can be scaled or repeated.
See the sample mapping below.
Once you’ve mapped it all, you’ll have a clearer view of where customers struggle and where they’re delighted—giving you a roadmap for improvement.
6. Analyzing Customer Feedback from Support Tickets, Reviews, and Chat Interactions
Support tickets, chat logs, and customer reviews—your support channels and review platforms are treasure troves of customer experience insights. Unlike surveys where you guide the questions, here, the customer drives the conversation—often revealing issues you didn’t think to ask about.
This kind of feedback gives you a real-world view of what’s working and what’s not. If dozens of customers write in about the same bug or post reviews mentioning a frustrating feature, that’s a clear signal. These are often direct reflections of pain points in your product or experience.
Here are a few feedback sources to watch:
Support tickets & chat logs: Reveal repeat issues and confusion.
Online reviews: Offer praise and criticism in public.
Community forums: Customers often surface workarounds or ideas here.
But reading every message and coding qualitative data manually? Not scalable. That’s where tools like Thematic and other customer insight platforms help. These tools use AI to group feedback into themes—like “billing confusion” or “app crashes”—so you can spot trends and volume.
A great example is Serato, a DJ software company. By analyzing Zendesk tickets using Thematic, they uncovered recurring complaints about a freezing feature and quickly fixed it—turning scattered complaints into a clear product improvement.
Now, take note: once you’ve identified the top issues and themes, loop them back to the right teams—product, support, design—so they can take action. And always follow up when you’ve made a fix. Let customers know you heard them—this is closing the feedback loop—and ask how they feel about the change as much as possible.
Remember, feedback that you gather after an update is raw, real, and often points directly to what you need to improve next. And when you track them over time, you can see if fixes are actually reducing complaints—proving the impact of listening.
Thematic
AI-powered software to transform qualitative data into powerful insights that drive decision making.
7. Using Behavioral Analytics to Track Customer Interactions and Preferences
Sometimes, what customers do tells you more than what they say. That’s the value of behavioral analytics—tracking actions like
What pages do they visit?
How long do they stay?
Which features do they use most in your app?
Where do they click? and
Where do they drop off?
By tracking and analyzing these behaviors, you gain insights into customer preferences and pain points based on their actual actions (rather than self-reported feedback).
Think of it this way: a visitor might say they love your website, but if your analytics show they only spent 10 seconds on it and bounced, their behavior tells a different story.
Conversely, a customer might not explicitly tell you which features they find most valuable, but if you see that 90% of active users engage with Feature A and barely touch Feature B, you’ve learned something crucial about what they value.
Here are common behaviors to track:
Website analytics: See where users go, how long they stay, and where they drop off.
Click heatmaps & scroll depth: Understand what grabs attention or gets missed.
Feature usage: Identify what customers love—and what they ignore.
Churn signals: Spot patterns that predict when users might leave.
One famous example of behavioral insights is how Netflix uses analytics. They track what you watch, skip, or rewatch to personalize your experience. Even if you’re not Netflix, you can apply the same logic—see what features drive engagement and what might need reworking.
Combining Behavior Data with Feedback
The real magic happens when you merge what people do with what they say. If you see a behavior (e.g., users dropping off at step 3 of a signup process), you can follow up with those users through a survey or interview to ask why they dropped off.
Maybe they’ll tell you the form was too long, or they got cold feet about pricing. Then, you have both the what and the why. Together, these provide a fuller understanding of customer actions and motivations.
Tools and Privacy
There are many tools (Mixpanel, Amplitude, Google Analytics, etc.) that provide robust behavioral tracking.
It’s important to be mindful of privacy and only track data in aggregate or as per your privacy policy. Modern consumers appreciate transparency, so be clear if you’re collecting usage data, and use it to genuinely improve their experience.
Taking Action
Insights from behavioral analytics should feed into UX design, product development, and marketing strategies.
If data shows users are ignoring a feature, perhaps it needs rethinking or better onboarding.
If a certain path in your website leads to high conversions, maybe drive more traffic there or replicate that model elsewhere.
If customers frequently use your service at a particular time or in a particular way, maybe tailor your support or features to that pattern (e.g., if a food delivery service sees a spike of use on Friday nights, they could ensure extra couriers or promote deals at that time).In short, behavioral analytics turns the implicit feedback (user actions) into explicit insights. It’s a bit like being able to watch over your customer’s shoulder (in a respectful, aggregated way) to see what delights or frustrates them.
8. Conducting A/B Testing to Measure the Impact of Changes on Customer Behavior
How do you know if a change you make is actually better for your customers?
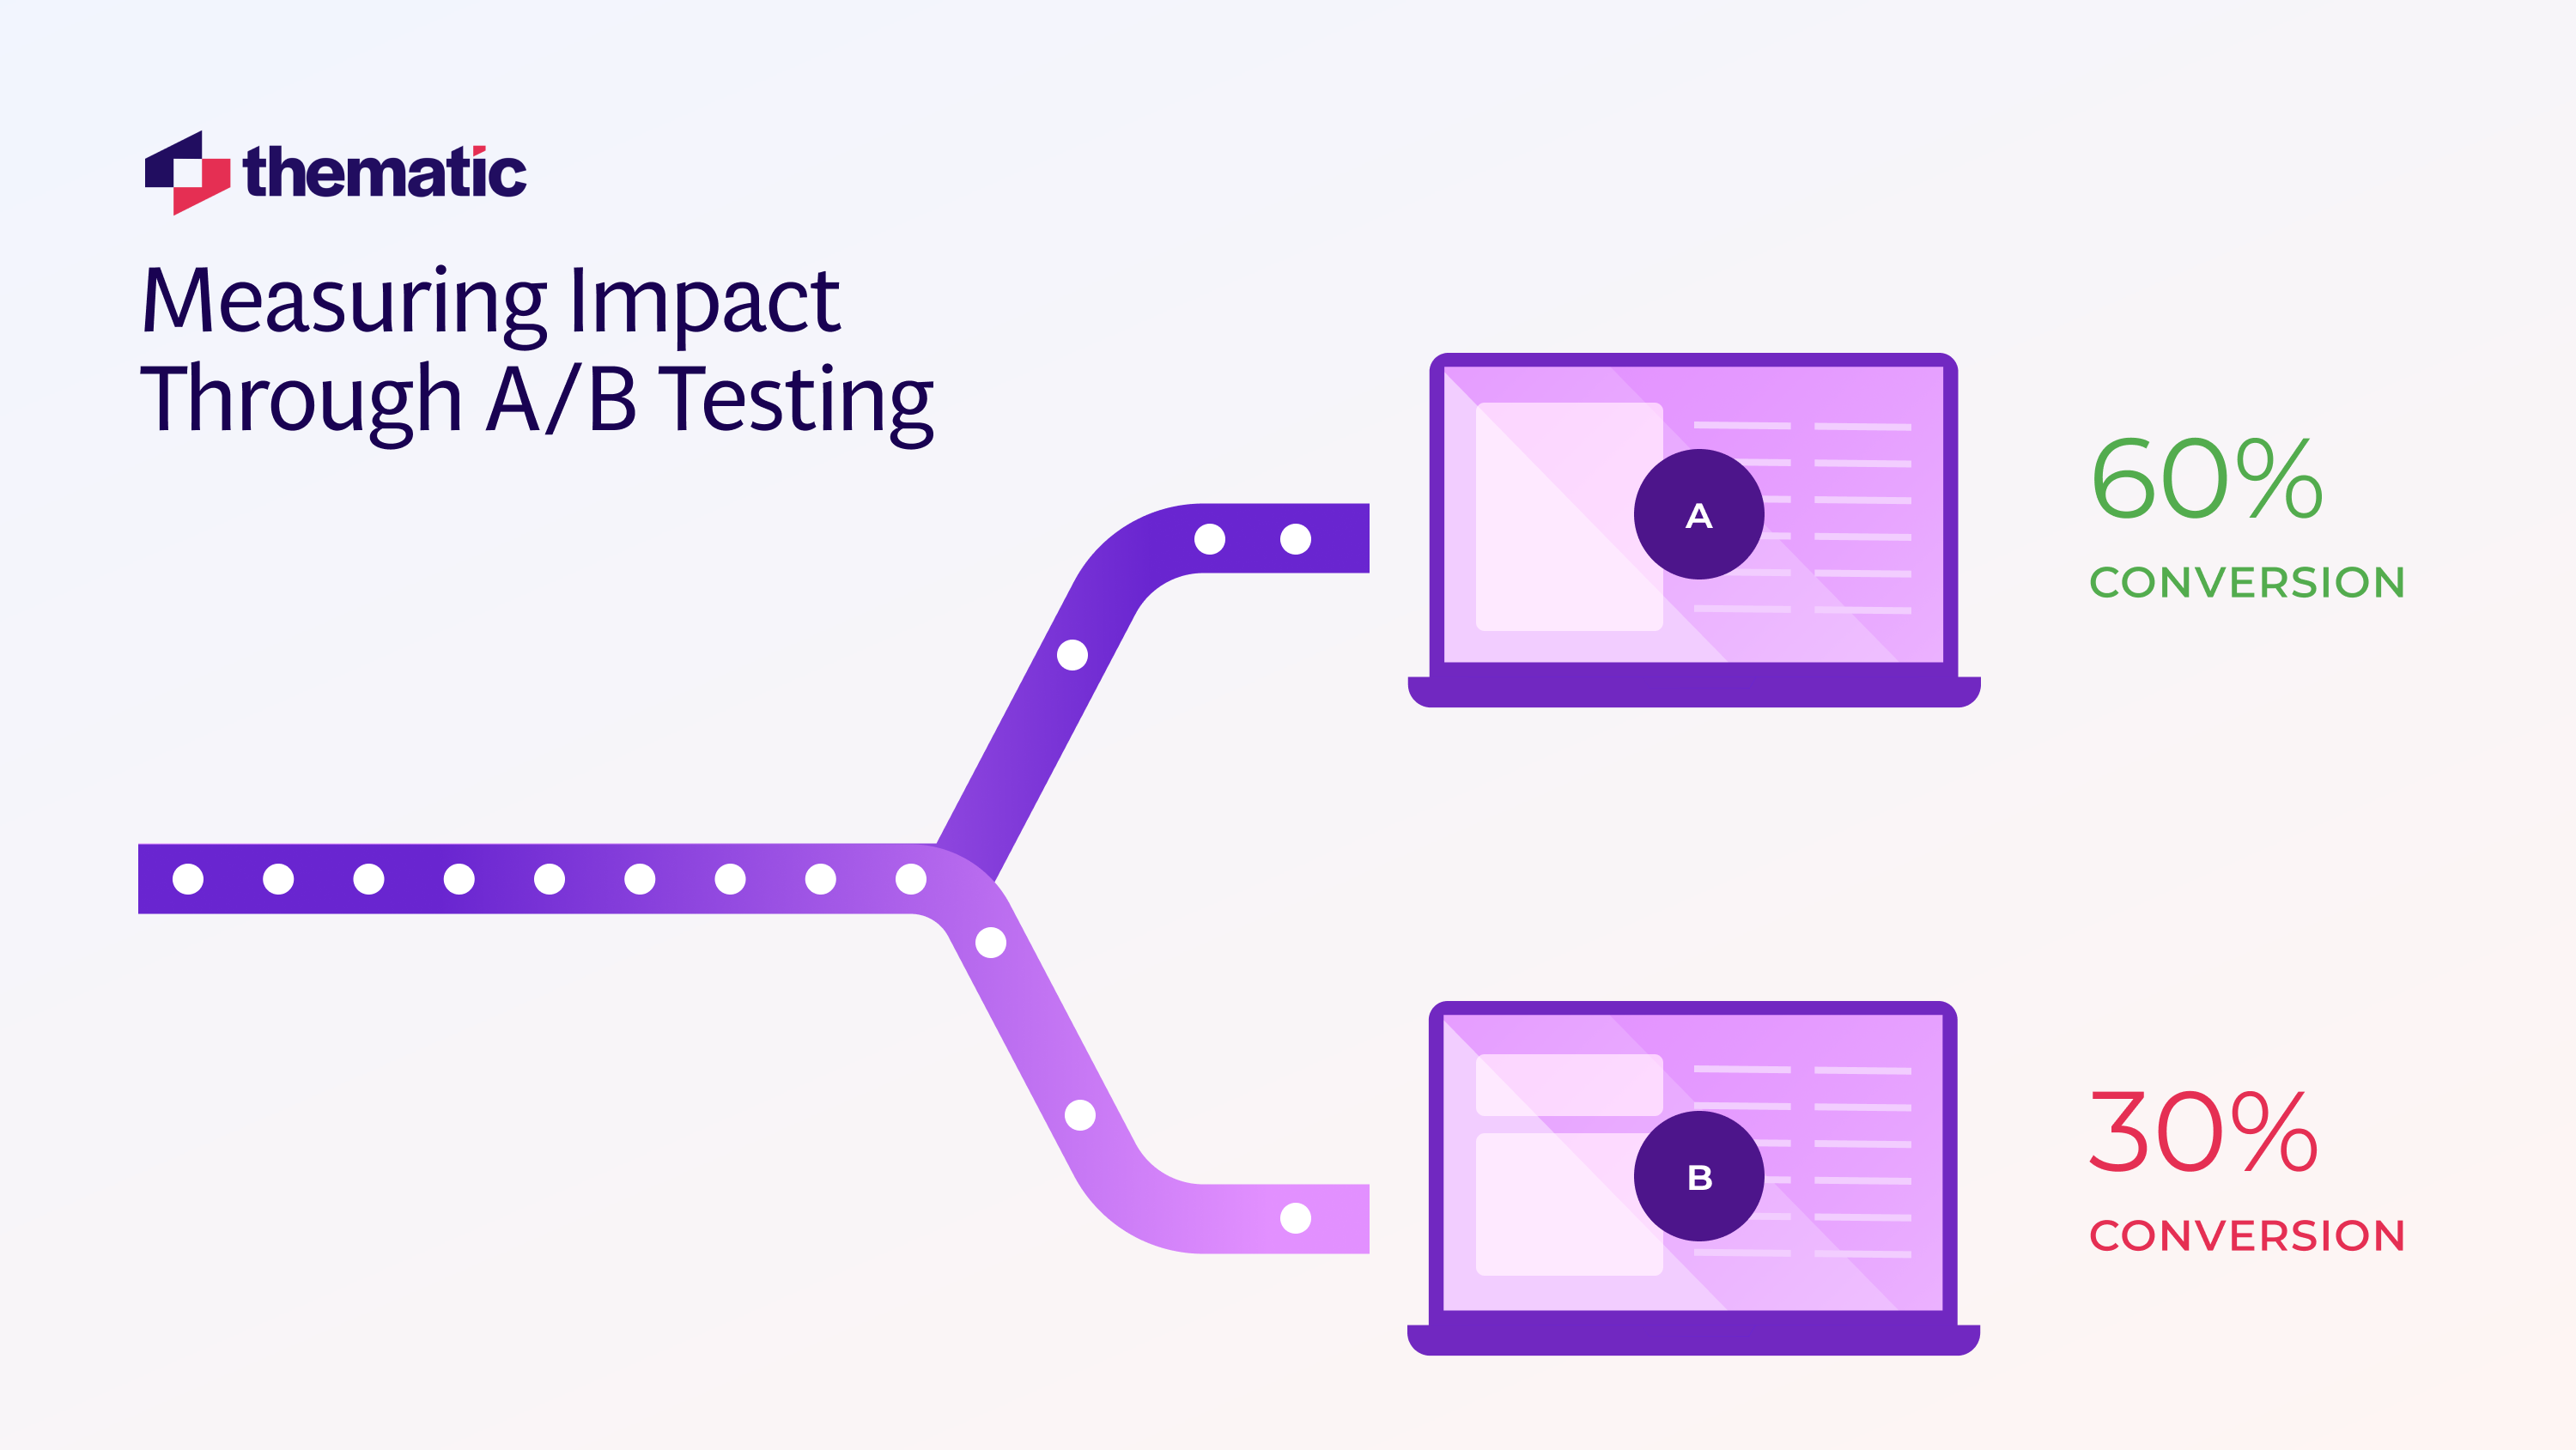
A/B testing (also known as split testing) is a method that lets you test this in a scientific way. The idea is simple:
You take two versions of something—A (the original or a variation) and B (another variation)—and you randomly split your audience so that one group experiences version A and another group experiences version B.
Then, you compare which version performs better on a key metric. It’s like a controlled experiment with your customers in real-world conditions.
In the digital context, A/B testing is mostly used on websites, apps, emails—areas where you can easily show different versions to different users.
A/B testing is one of the most reliable ways to see what actually works. Remember, our instincts aren’t always right—what seems like a small change can have a big impact. In fact, some of the biggest wins come from simple tweaks, like changing button text or layout.
It also encourages a test-and-learn culture. Instead of rolling out big changes blindly, you experiment on a smaller scale first. That way, you reduce risk and learn fast—without affecting everyone.
How A/B Testing Works (in Practice)
Pick one element to test: To get clear results, it’s best to test one thing at a time (e.g., the headline text, or the color of a button, or one feature change). Define what change you want to experiment with.
Define your success metric: This is what you’ll measure to declare a winner. It could be conversion rate (percent who purchase or sign up), click-through rate, time on page, etc. For instance, if you’re testing two signup page designs, your metric might be the “percentage of visitors who complete signup.” Split your audience randomly: Use an A/B testing tool or platform which will randomly show version A to half your users and version B to the other half simultaneously. The randomization and simultaneity are important to ensure any difference in outcome is due to the change, not due to timing or different audiences.
Run the test and collect data: Let it run for a sufficient time to gather enough data (depending on your traffic, this could be days or weeks—you need enough sample size to be confident). The tool will record the metric for each version.
Analyze the results: See which version performed better on your success metric. Statistical significance is a concept used here—basically, making sure the difference is real and not just due to chance.
Many tools will tell you when a result is significant. If version B significantly outperforms A (say, a 5% higher conversion rate with strong confidence), then congratulations—you likely have a better design or approach! If there’s no clear winner, that tells you the change didn’t make much difference (which is also a valuable insight—maybe that aspect isn’t as crucial as you thought).
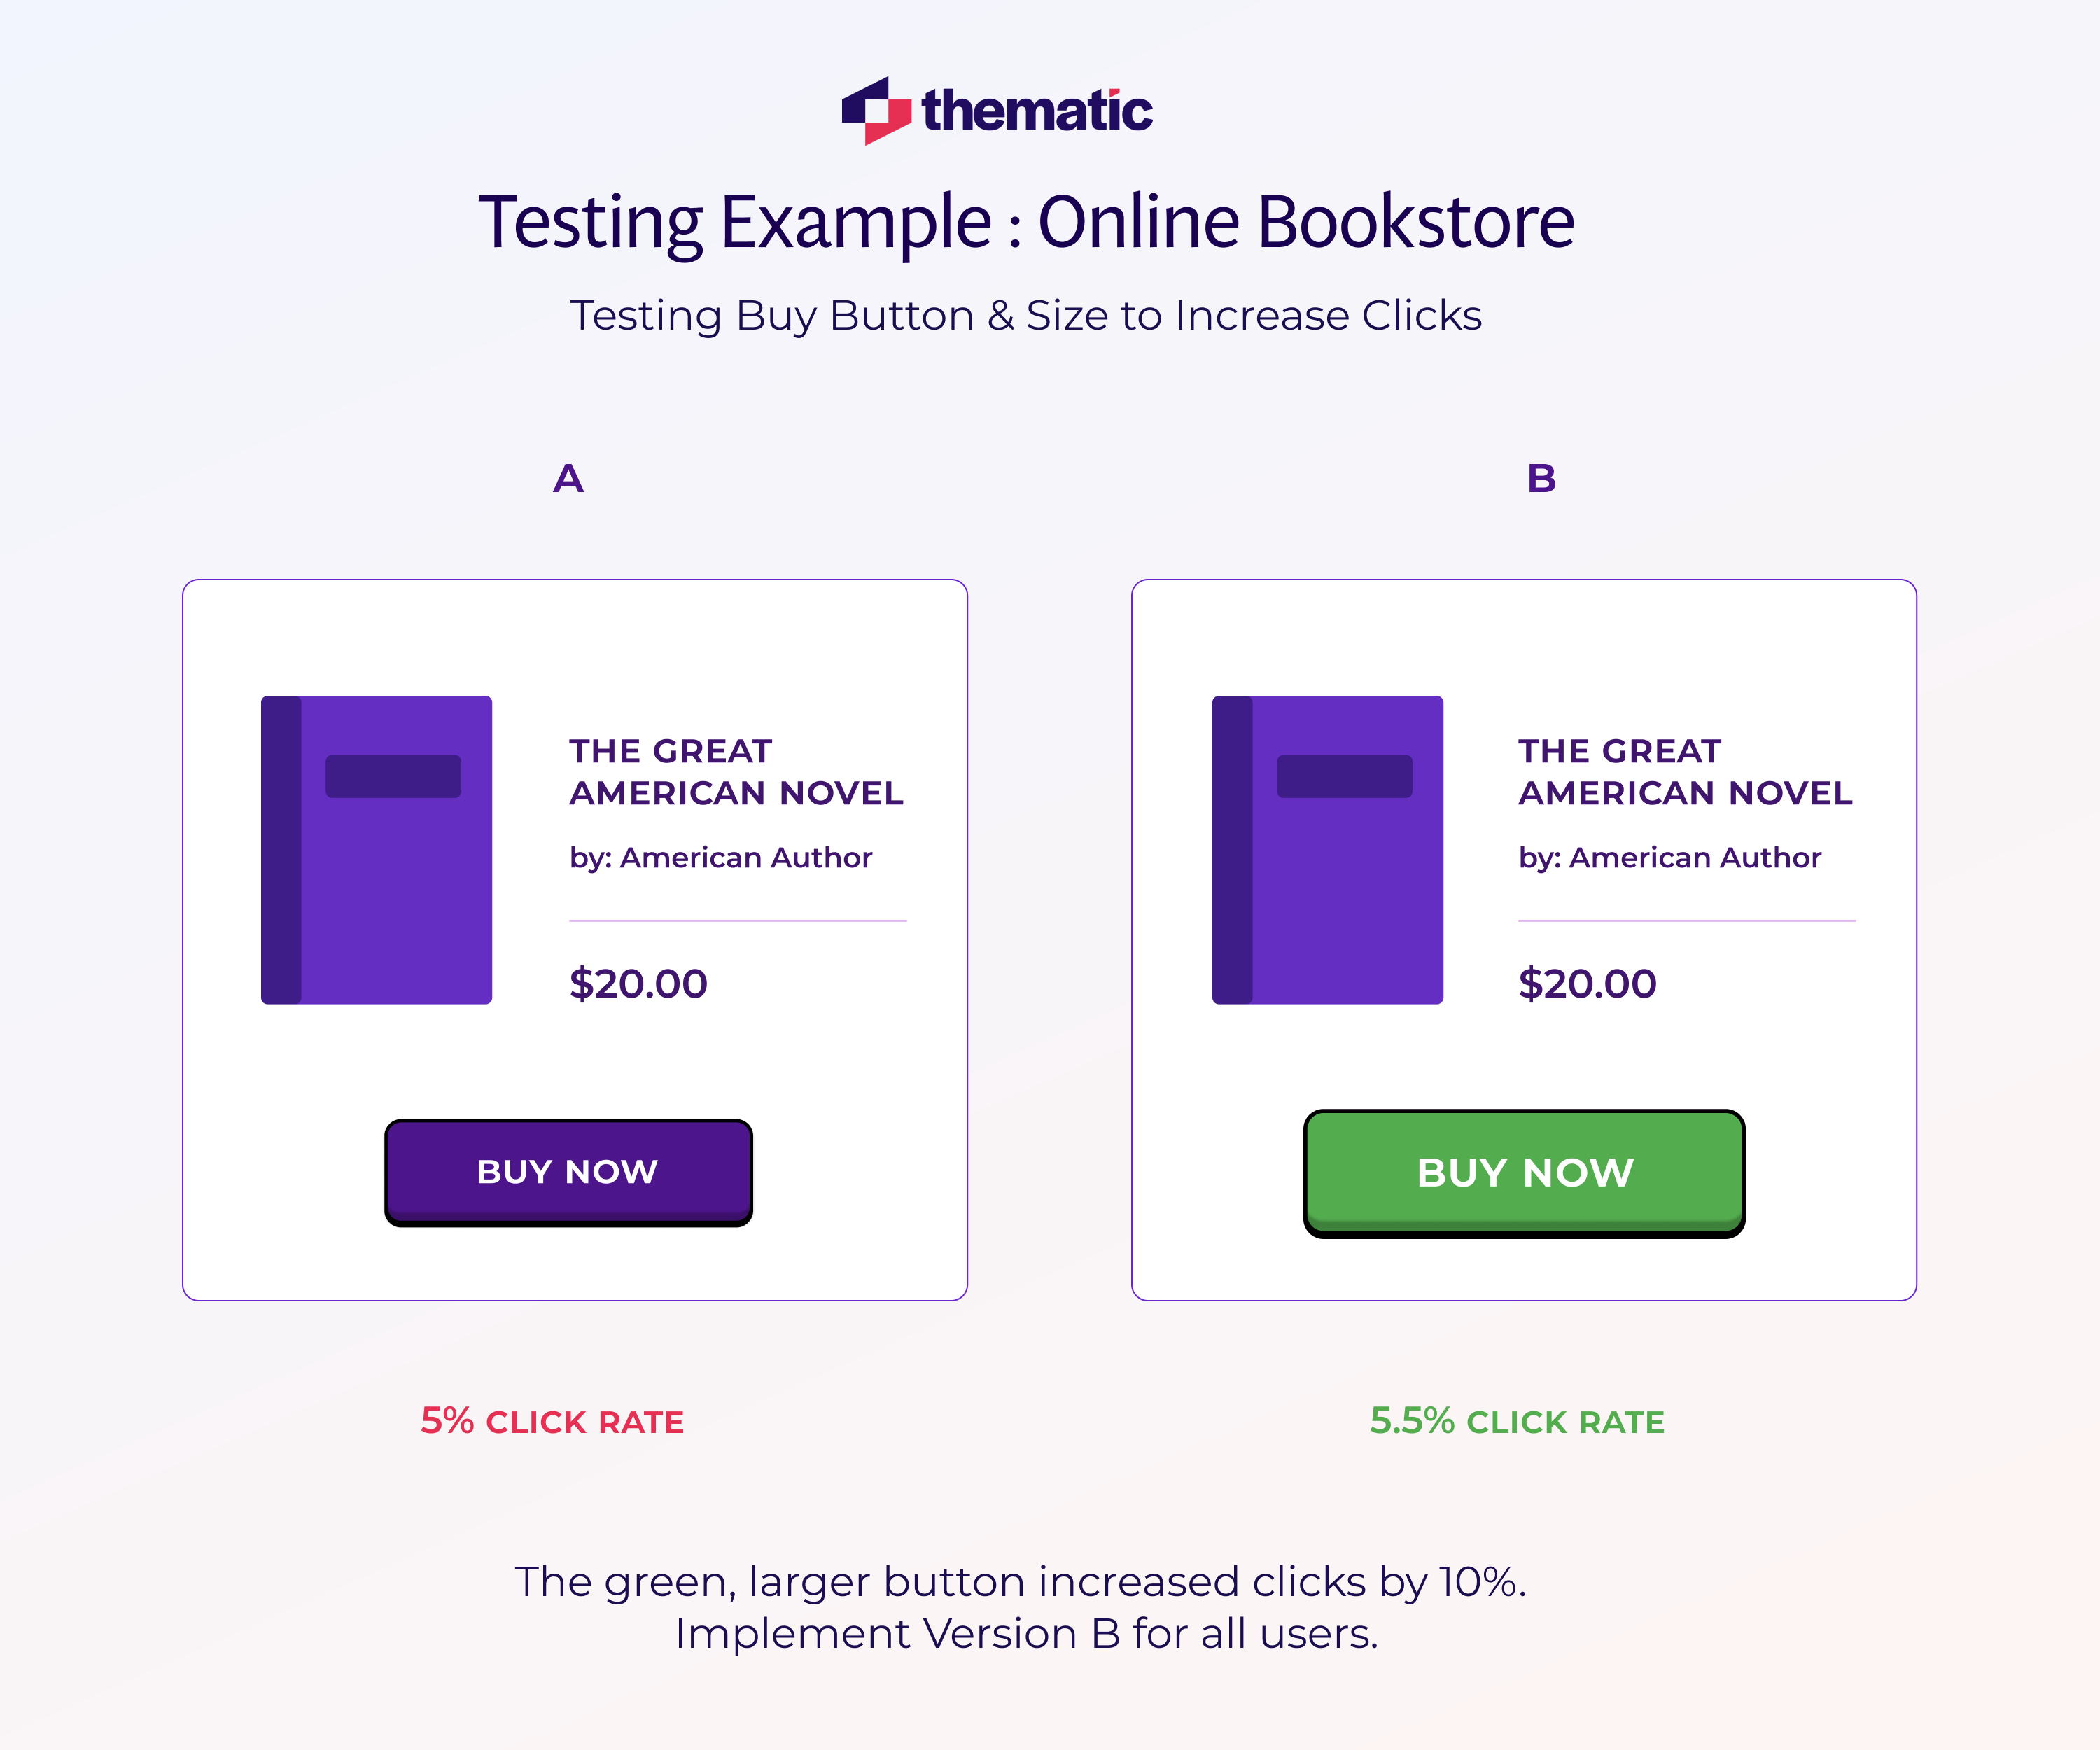
Here’s an example:
Let’s say an online bookstore wants more people to click the “Buy” button.
They create two versions of the product page: Version A has the buy button in blue, and Version B has it in green and slightly bigger.
After running an A/B test, they find Version B gets 10% more clicks on the buy button than Version A.
With that evidence, they roll out the green button to everyone—they’ve made an informed decision based on real customer behavior data.
The test removed the guesswork or internal debate (“which color is better?”) and let the customers “vote” with their actions.
💡
Be careful not to test too many changes at once, or across overlapping audiences, or you’ll muddy the results. Also, think about the user experience—if customers bounce between versions too often, it can be confusing (though most tests are short enough that this isn’t an issue). And if you have low traffic, A/B testing can take a long time to show meaningful results. In those cases, qualitative feedback or small-scale rollouts might be more effective.
9. Integrating AI and Predictive Analytics for More Advanced Customer Insights
Artificial intelligence (AI) and predictive analytics are game-changers for customer insights research. They take the heavy lifting of data analysis and supercharge it, allowing you to discover patterns and trends that would be hard for humans to spot unaided.
In essence, AI can sift through mountains of data (like thousands of survey responses or chat transcripts) in a fraction of the time, and predictive analytics can use historical data to forecast future customer behavior.
Meanwhile, with text analytics, AI can help identify themes and sentiments within your mountain of open-ended feedback (surveys, reviews, social media comments).
For example, Thematic uses AI to group feedback into themes automatically—it might tell a retailer that, out of 10,000 customer comments, “pricing” and “customer service” are two major themes and that 70% of the mentions of pricing are negative (customers feeling things are too expensive) while customer service insights came in largely positive.
You get this incredibly useful at lightning speed, so you can plan and apply changes as soon as possible.
Predictive Analytics
Predictive analytics goes a step further by using past data to forecast future behavior. For instance, you might learn that customers who skip onboarding emails and haven’t logged in for a week are more likely to churn. That lets you step in before they leave.
You can also use predictive models to:
Spot churn risks early
Forecast support volume
Personalize content and offers
Even if you’re not building AI models in-house, many platforms come with these features built in, like thematic analysis software solutions (like Thematic, IBM Watson NLP, etc.). Just remember, AI is a tool—not a magic solution. You’ll still need human judgment to interpret the findings and decide what to do next. That’s Thematic’s secret sauce—human-in-the-loop.
By combining AI with other research methods, you get faster insights, clearer priorities, and the ability to act in near real time—which means less guessing and more doing.
10. Aligning Research Findings With Marketing and Product Development Strategies
Collecting customer insights is only half the job—the other half is making sure they actually inform decisions across your business.
Start by sharing insights across teams. If you’ve uncovered that “ease of use” is a top reason customers stick around, marketing should highlight it, product should preserve it, and support should be ready to reinforce it. Regular updates, dashboards, or even a monthly “Customer Voice” summary can keep everyone aligned.
Better yet, involve teams in the process. Let product managers sit in on focus groups or invite marketers to review open-ended survey feedback. Hearing directly from customers builds empathy and helps turn insights into action.
Once you identify recurring feedback—like confusion during onboarding or demand for a new feature—log it and track what you do about it. For instance:
Insight: Many customers mention they want a way to save favorite items on our shopping site.
Action: Product team to scope a “wishlist” feature this quarter.
Insight: High-value customers (big spenders) often cite premium support as a reason they stay loyal.
Action: Marketing to emphasize our dedicated support in value prop; Customer Success to ensure we maintain that level of service.
Tie insights to goals. If your team wants to reduce churn or attract a younger audience, customer feedback should guide what to prioritize and how to talk about it.
And don’t forget to measure. After making a change, check if it had the desired effect—did complaints drop? Did satisfaction improve? This helps you refine what works and build a feedback loop of continuous improvement.
When everyone—from marketing to product—is on the same page with the customer, you move faster and build smarter. Insights become more than data—they become decisions.
💡
Remember: Companies that use data-driven customer insights for decision-making and customer-centric strategies outperform those that don’t. In fact, one study found that companies in the top tier of using data to guide decisions were about 5% more productive and 6% more profitable than their competitors.
The Bottom Line
By now, we’ve explored a range of methods—from surveys and focus groups to cutting-edge AI analytics—all aimed at helping you understand your customers better.
Whether you’re a marketer looking to fine-tune your message or a product manager aiming to build something users love, these approaches will guide you toward making informed decisions rooted in real customer insight.
The key takeaway is to always ask why and how from the customer’s perspective, and then let those answers drive your strategy.
Ready to turn your customer feedback into growth? Experience feedback analysis in action on your own data with a demo of Thematic.
Share
Link Copied!
Request a demo of Thematic's Customer Intelligence Platform
Thematic turns fragmented feedback into one consistent source of customer truth — so every team acts on the same customer story. Up and running in days, not quarters.
Thank you! Your submission has been received!
Oops! Something went wrong while submitting the form.


.webp)


