Numbers can only tell you what is happening, but not why. You might track customer experience (CX) metrics like satisfaction scores or NPS (Net Promoter Score) to gauge your success. But when a score dips or a trend shifts, do you know the reason?
Often, the answer lies hidden in customers’ own words. Open-text feedback, or those comments and survey responses in plain language, holds the story behind the metrics. Learning to unlock that story through qualitative data analysis is the key to deeper insight.
In this article, we’ll explore why qualitative data is important for boosting your CX KPIs, and how turning verbatim feedback into actionable insights can drive real improvements.
Why Numbers Need Stories: Why Is Qualitative Data Important?
Hard numbers are essential in any business. They show how many, how much, or how often. But why is qualitative data important alongside those numbers? Because the why behind a metric matters.
Quantitative and qualitative data serve different roles. Instead of choosing between them, the best results come from blending both. The numbers reveal what is happening, while open-ended comments and stories explain why it’s happening.
Imagine you run a customer survey and get a satisfaction score of 7/10. Useful, right? But the follow-up question —“Why did you give that score?”—uncovers the context. A well-designed qualitative survey question like that invites customers to share their feelings in detail. One customer might say, “The product works well, but support was slow.” Another might love the service but find the price too high. These stories turn a simple score into a clear roadmap for action.
This is why qualitative data is important: without it, you risk missing the story behind your numbers.
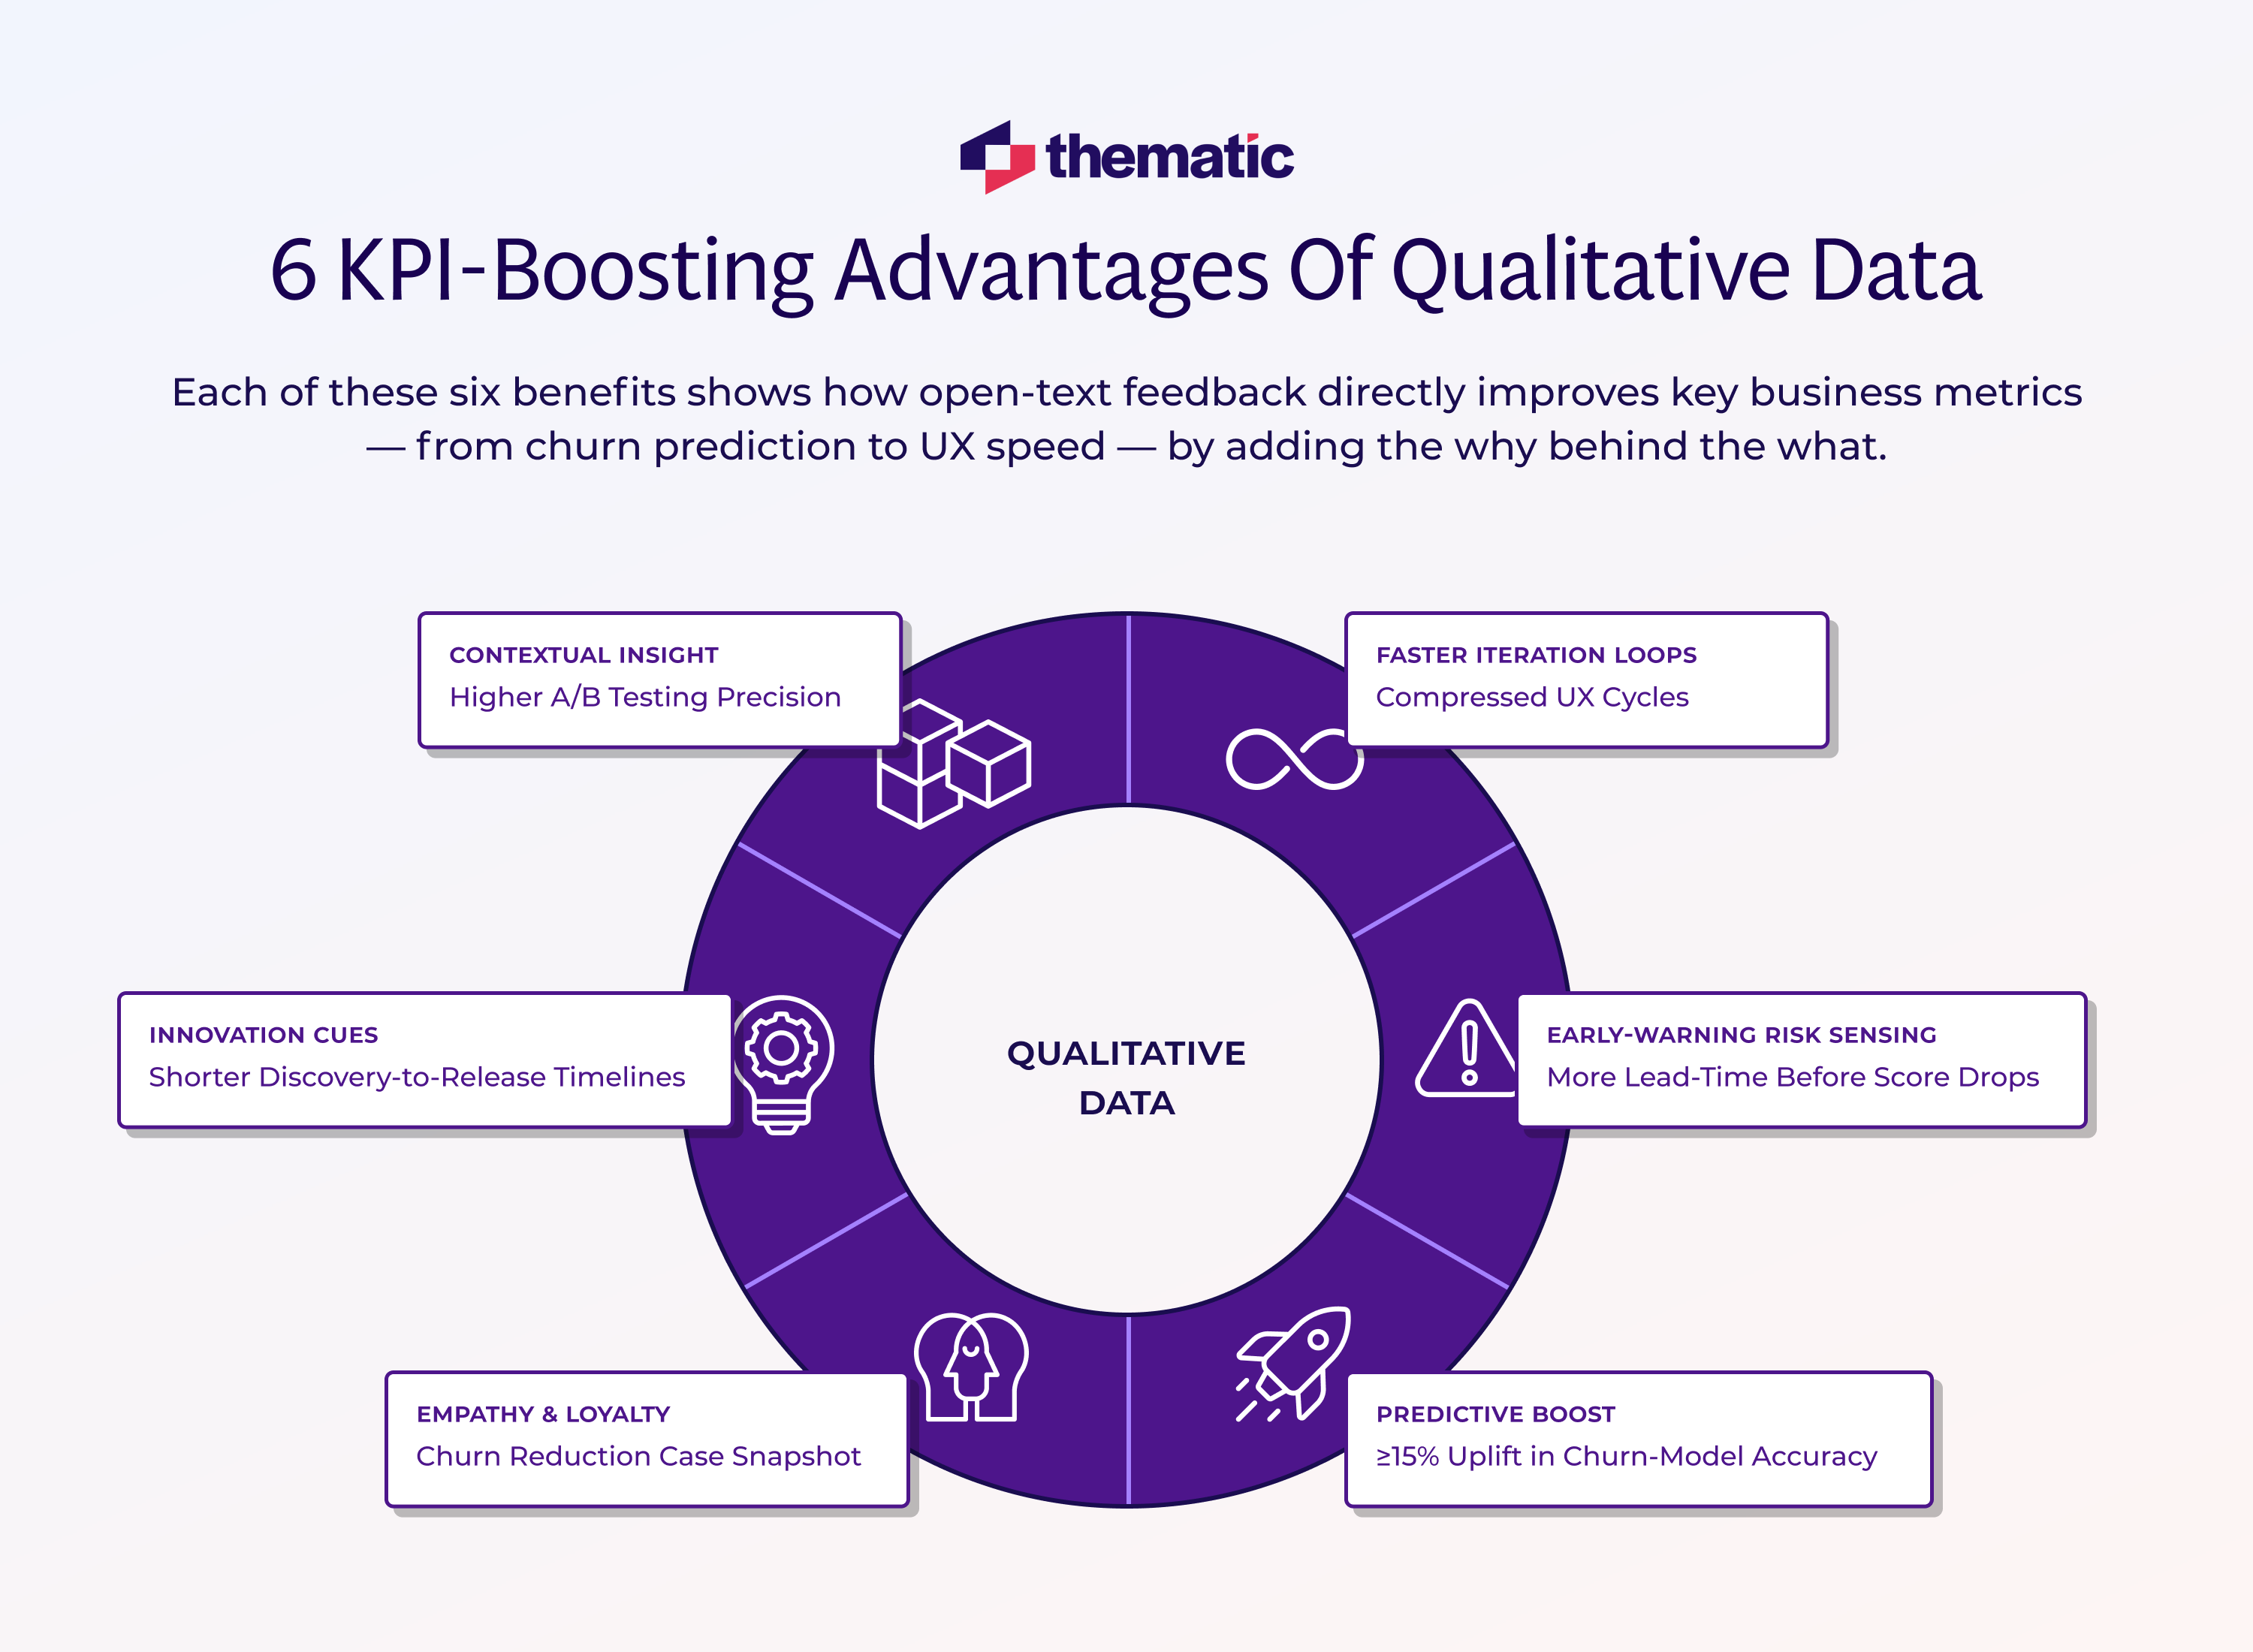
Six KPI-Boosting Advantages of Qualitative Data
So, how exactly can open-text feedback move the needle on your key performance indicators?
Let’s dive into six big advantages of qualitative data that directly impact your KPIs and drive better decision-making.
1. Contextual Insight: Higher A/B-Test Precision
Qualitative feedback provides context that makes your experiments and optimizations far more precise. Imagine running an A/B test on a website. Version A and B have different designs, and B edges out A with a 5% higher conversion rate. The numbers tell you B “won,” but why? This is where comments from users become gold. Perhaps users mention that Version B “felt simpler to navigate.” That insight tells you which element made the difference. With that context, your next test can zero in on refining navigation, rather than guessing blindly.
By analyzing open-text responses alongside test results, teams get higher A/B-test precision in understanding what truly impacts user behavior. Modern tools make this easier by quickly categorizing feedback from experiments. So, no need to keep scratching your head over a cryptic metric change; you’ll know exactly which tweaks matter, giving you more confidence in each experiment’s outcome.
Customers often leave clues about what they want next. Qualitative data is your ongoing suggestion box, full of ideas for improvement and innovation.
Reading through feedback, you might notice multiple users saying, “I wish this app had __ feature,” or “It would be great if ___.” These are innovation cues coming directly from your audience. If you act on them, you can shorten your discovery-to-release timelines for new features or fixes.
Why is that?
Because you’re not starting from scratch or making wild guesses, customers have already pointed you to what needs doing.
When applying robust methods of qualitative analysis to group and prioritize these suggestions, product teams can spot the most requested ideas at a glance. Maybe ten customers all asked for a simpler checkout step; that’s a clear sign to act.
When you build what people are already asking for, the development cycle speeds up. You move from identifying a need to releasing a solution faster than ever: you delight customers while staying ahead of competitors.
3. Empathy & Loyalty: Churn Reduction Case Snapshot
Stories create empathy. When you read a customer’s honest comment (e.g., "I love the service, but the new update is confusing"), it hits differently than a drop in a retention graph. Qualitative feedback humanizes your data. If you listen to customer pain points in their own words, your team can respond in a more personal and impactful way. This boost in empathy translates into loyalty and lower churn.
Here’s a quick snapshot:
A software company noticed its monthly churn rate creeping up despite solid overall satisfaction scores. Digging into the open-ended feedback, they discovered a pattern: several long-time users were frustrated by a recent UI change. With this insight, the team quickly rolled back the unpopular change and sent a personal note to affected users thanking them for the feedback.
The result?
Churn for that segment dropped, and many of those customers felt more valued and heard. They stayed, and some even became advocates.
Doesn’t that clearly answer the big question, “why is qualitative data important?”. You get to pinpoint issues and show customers you care, and consequently turn potential losses into loyalty gains.
4. Faster Iteration Loops: Compressed UX Cycles
Traditionally, collecting and interpreting qualitative feedback could take weeks or months. You’d run a study, manually sift through responses, and only then make changes. Today, that cycle is much faster. With the right tools and approach, you can gather feedback and iterate almost in real-time.
Shorter feedback loops mean compressed UX improvement cycles: you fix issues or refine features sooner, which boosts metrics like task completion rates and user satisfaction.
One reason for this acceleration is automation in coding and categorizing feedback. In the past, coding qualitative analysis (in other words, categorizing comments into themes) was a tedious manual job. Now, AI-driven platforms can tag common themes or sentiments across thousands of responses within minutes.
For example, after a feature launch, you might instantly see that 40% of comments mention “difficulty finding settings.” This insight can go straight to the design team that same week, instead of waiting for a lengthy research report.
Rapid insight means rapid action. When you can iterate faster based on what users are saying, you create a better experience in less time, giving your UX and product KPIs a healthy uptick.
5. Early-Warning Risk Sensing: More Lead-Time Before Score Drops
Ever wish you had a crystal ball for customer satisfaction? Qualitative data is about as close as it gets.
Open-text feedback often surfaces simmering issues long before they show up in your top-line metrics. Think of it as an early-warning system for customer experience risks. You might start seeing comments like, “The app keeps logging me out lately,” or “Customer support wait times are getting longer.”
Individually, these might seem minor. But if dozens of customers start voicing the same concern, you’ve got a trend that needs attention before your star ratings or NPS take a hit.
By monitoring feedback in real time, you gain lead time to fix problems ahead of a broad impact. It’s far better to catch a service bug or policy frustration when five people mention it in comments than to find out after your satisfaction score drops significantly in the next quarter.
In this way, qualitative data doesn’t just explain your KPIs; it helps protect them: you’ll see storms on the horizon and can act early, turning potential crises into non-events.
6. Predictive Boost: ≥15% Uplift in Churn-Model Accuracy
If you’re using data to predict customer behavior (like who might churn or which users might upgrade), don’t overlook the power of text. Including qualitative inputs can make your predictive models noticeably stronger. In fact, companies that enrich their churn prediction algorithms with sentiment and topic data from customer comments have seen model accuracy jump by 15% or more.
Why the big boost? Because you’re adding another dimension of insight. A churn model based only on click rates or login frequency might miss warning signs that live in written feedback. For example, a customer could be logging in daily (quantitatively that looks great) but also repeatedly writing things like “not finding value” or “thinking of switching” in support chats. An algorithm might flag them as happy if it only sees the login frequency, whereas the text tells a different story.
With sentiment analysis and topic trends from qualitative data embedded in your process, your predictions consider both what customers do and what they say. The result is a more holistic model that identifies at-risk customers more accurately, giving your retention efforts a precise target list and boosting overall model performance.
Thematic
AI-powered software to transform qualitative data into powerful insights that drive decision making.
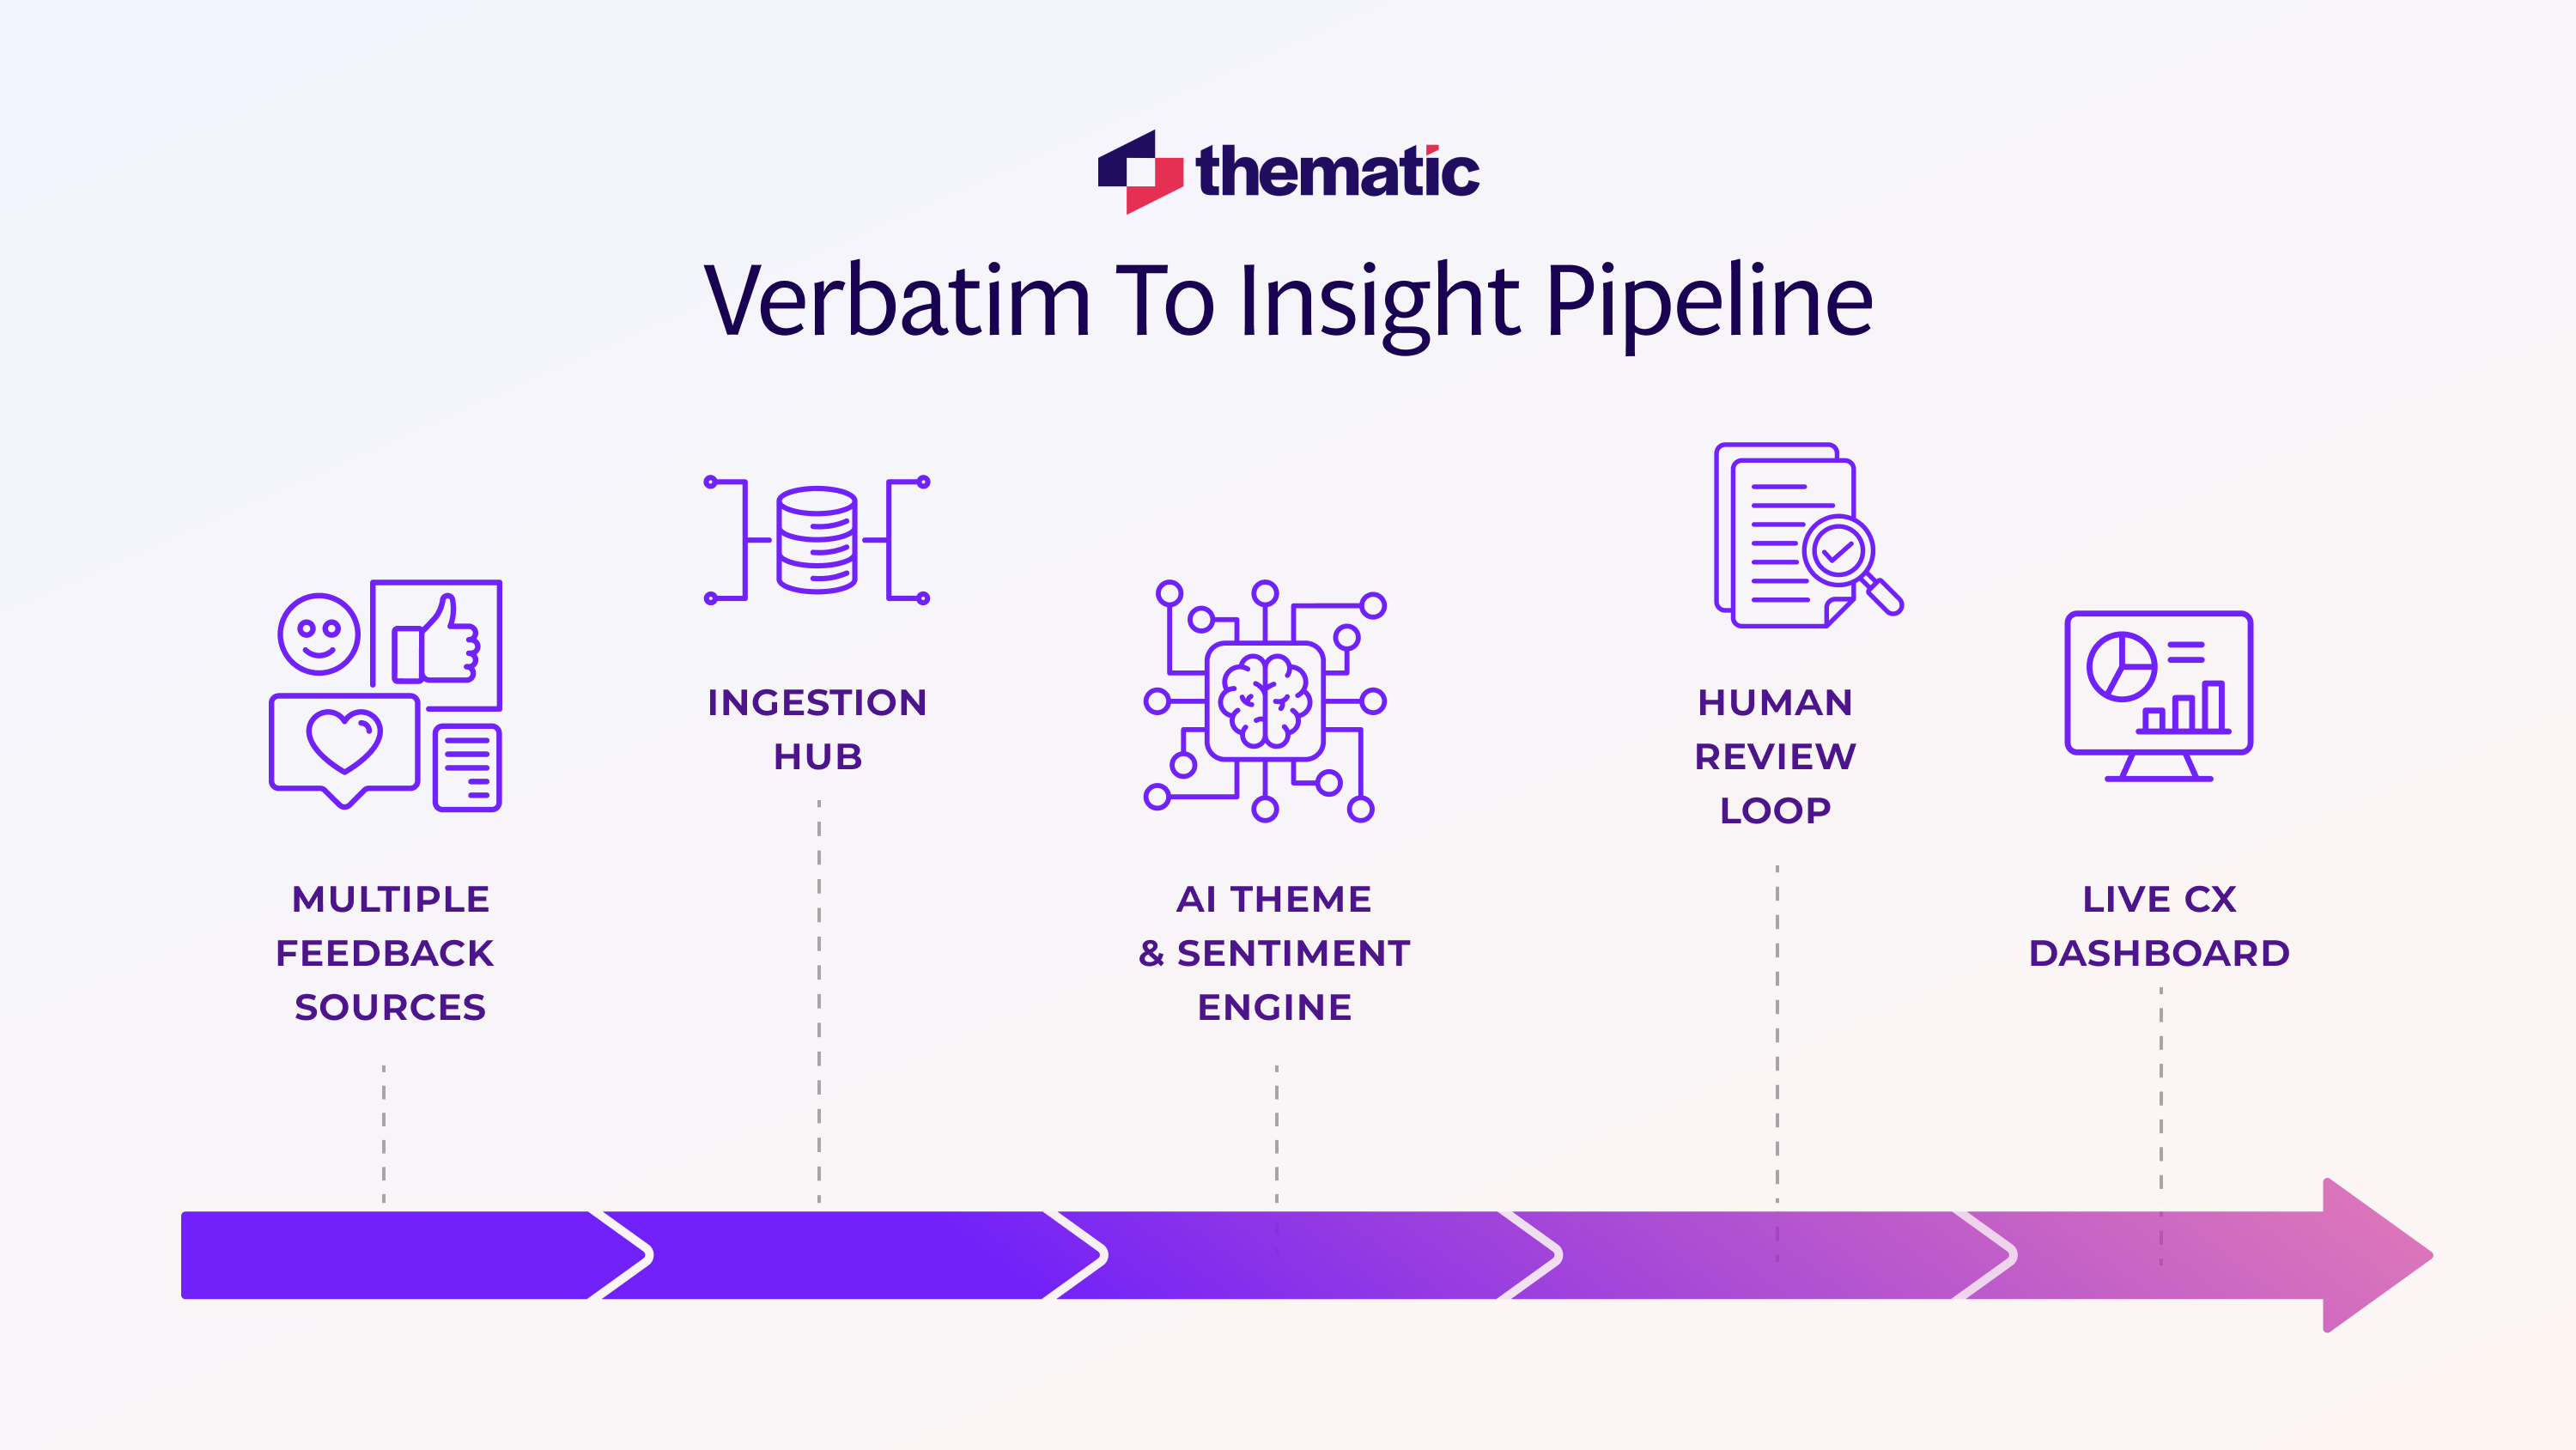
From Verbatim to Dashboard: The Automation Workflow
Gathering dozens, hundreds, or even millions of open-text responses might sound overwhelming. How can you possibly read and act on all that feedback? The answer lies in a smart automation workflow that takes verbatim comments and turns them into clear, visual insights on your dashboard.
Here’s how it works in practice:
First, you integrate your feedback sources into your feedback tool. Customer comments might be coming from surveys, support tickets, social media, app reviews, you name it. A platform with robust integrations pulls all these streams together so nothing gets missed.
💡
Thematic’s integrations let you connect all your customer feedback channels seamlessly, unifying open-text data for richer CX insights.
Next comes processing and analysis. Modern systems use AI-driven text analytics to read through raw text. They’ll group similar feedback into themes, detect sentiment (positive, negative, neutral), and even flag urgent issues. This is where classic legwork transforms into instant insight (no more hours spent manually coding responses).
Of course, human oversight is still crucial to ensure nuances are captured correctly, but much of the heavy lifting is automated.
💡
Thematic Science puts humans in the loop, letting experts fine-tune AI-generated themes to match every unique business context.
Then, those analyzed insights flow into your dashboard. Instead of a messy spreadsheet of comments, you see charts, trend lines, and word clouds highlighting what customers talk about most. Maybe “delivery time” complaints spiked this week, or “love the new feature” is trending positively. And this isn’t a one-and-done report; the dashboard updates continuously, so your team can watch customer experience unfold in real time.
💡
Thematic Workflows automate your qualitative insights pipeline from text collection to insight delivery with a customizable process.
This end-to-end pipeline—from verbatim feedback to a clear dashboard—means you can respond to issues and opportunities faster. It takes the guesswork and grunt work out of qualitative analysis, so you spend less time wrangling data and more time improving CX.
Executive Storytelling & Budget Justification
Qualitative data doesn’t just help your customer-facing metrics; it also strengthens your case in the boardroom. Executives love a good story, especially when it’s backed by data. Turning open-text feedback into compelling narratives can make a powerful impact when seeking buy-in or budget for customer experience initiatives.
Imagine presenting to your leadership team and not only sharing "Customer satisfaction improved by 10%" but also adding, "because we fixed the top complaint customers voiced: slow response times." You might even include a direct customer quote: "They solved my issue in minutes – I’m impressed!" That combination of hard numbers and real customer voice makes your results tangible and memorable. It’s the difference between dry statistics and a story that hits home.
When it’s budget season, being able to explain why qualitative data is important in dollars and cents changes the game. For instance, you can highlight how insights from open-text feedback led to a specific product fix that saved 100 customers from churning, translating to $X in retained revenue. That level of detail shows executives the ROI of investing in qualitative analysis (like expanding your team or adopting new tools).
On the whole, qualitative insights give you the narrative glue to connect customer experience improvements with business outcomes. It humanizes the impact, making it easier for decision-makers to see the value and say “yes” to future CX investments.
Common Pitfalls & Quick Fixes
Even with all these benefits, teams can stumble when working with qualitative data. Here are some common pitfalls and quick fixes:
1. Pitfall: Only tracking scores and ignoring written feedback.
Quick Fix: Always pair key metrics with at least one open-ended question. This ensures you never have a number without a story.
2. Pitfall: Getting overwhelmed by too much feedback.
Quick Fix: Focus on high-frequency themes first. Identify the top recurring issues (automation helps here) instead of trying to tackle everything at once.
3. Pitfall: Inconsistent coding of comments leading to confusion.
Quick Fix: Establish clear guidelines or use best practices for coding qualitative data so everyone analyzes feedback the same way, or leverage an AI tool to standardize it.
4. Pitfall: Failing to act on what customers say.
Quick Fix: Close the loop. Share insights with relevant teams and let customers know you’re listening by making visible improvements. A small acknowledgment can turn feedback into loyalty.
Next Steps
Now that you’ve seen why qualitative data matters so much for customer experience, it’s time to put it into action.
Start by evaluating where you’re collecting open-text feedback today, and where you might be missing it. Are you asking the “why” questions in your surveys and support interactions?
Once you have that raw feedback, ensure you have a process (or platform) to transform it into insights. That might mean adopting a new approach or trying out an AI-powered CX analytics tool.
Remember, why is qualitative data important? Because it turns anonymous numbers into voices and faces you can understand. When you treat customer comments as seriously as you treat the graphs on your dashboard, amazing things happen: products improve, customers feel heard, and your KPIs start climbing.
The next step is yours: embrace those open-text insights, and watch your customer experience reach new heights.
Request a demo of Thematic now and try it on your own data to find out how it can make your qualitative data analysis much easier.
Share
Link Copied!
Request a demo of Thematic's Customer Intelligence Platform
Thematic turns fragmented feedback into one consistent source of customer truth — so every team acts on the same customer story. Up and running in days, not quarters.
Thank you! Your submission has been received!
Oops! Something went wrong while submitting the form.