From Ignored to Indispensable: The Proven, Step-by-Step CX Insights Mastery Blueprint in < 6 Days!
This free, 6-day email course walks through a proven process to turn customer feedback into career growth, strategic influence, and a seat at the executive table in 30 days.
Word clouds measure what customers say most. But it does not reveal the true root causes behind changes in scores.
Stop chasing frequency and start quantifying what actually drives loyalty, churn, and revenue.
The biggest word in your word cloud is often the wrong priority. In fact, word clouds are often misleading full stop.
Take this scenario: You've got a word cloud ready for tomorrow's leadership meeting. "Stock," "service," and "delivery" dominate. Clear priorities, right? According to the word cloud, they are.
So, you recommend focusing resources there. Six months later, NPS hasn't budged. Worse, your highest-value customers are quietly churning. What happened?
The word cloud showed you what customers mentioned most. It didn't show you what actually drove their scores.
Word clouds measure frequency, not impact.
On the other hand, AI text analysis reveals what actually drives your scores by:
Quantifing exact NPS/CSAT impact for every theme
Building theme hierarchies that expose root causes hidden under vague keywords
Builds customer Ssegments to show which customer groups feel it most
Word clouds are everywhere in customer experience reporting.
They're quick to generate, easy to paste into a board deck, and visually persuasive. The bigger the word, the more important it looks.
But that's the problem.
They highlight what customers say most often, not what actually drives loyalty, adoption, churn, score changes, or any of those other good or bad things. That distinction is where most teams go wrong.
In our experience, the overlap between "most mentioned" and "biggest business driver" is often small.
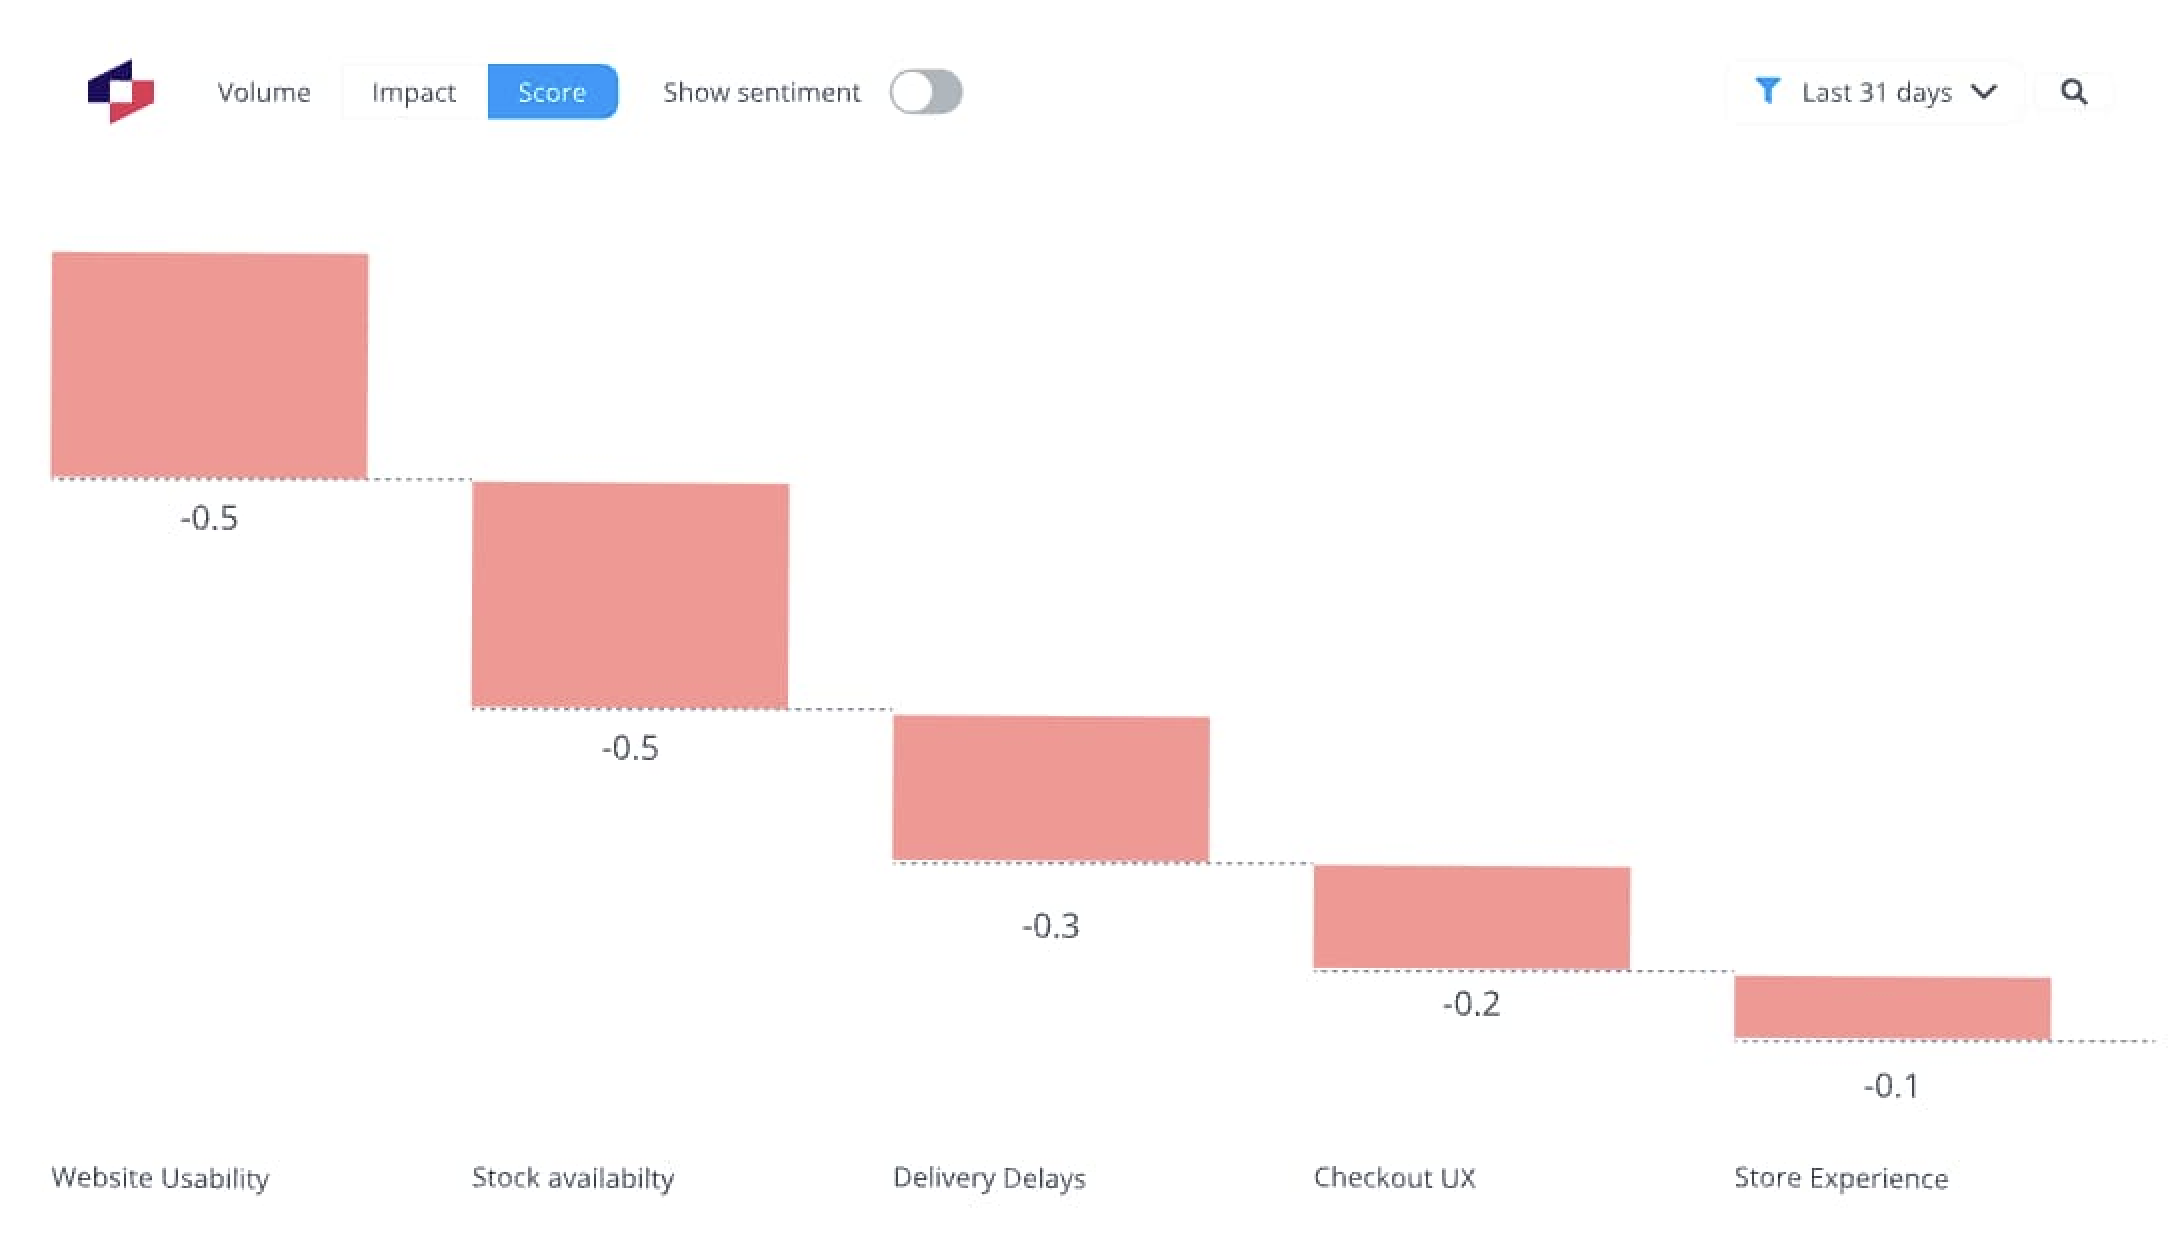
Figure 1: An impact analysis showing thevolume-impact disconnect. Themes mentioned by just 4% of customers can drive equal NPS impact (-0.5 points) as themes mentioned by 23%. Word clouds hide this completely.
Instead of only counting the volume of words, AI text analysis themes feedback, quantifies their effect on NPS or CSAT, and shows which segments are most at risk.
It can transform raw verbatim into evidence you can act on, not just a picture you can point to.
This pattern repeats across industries. Issues that only make up a small share of overall volume can damage scores severely. Issues that make up a large share of the overall volume might have actually have a more manageable impact than expected.
At scale, that insight is the difference between fixing the wrong thing and protecting your most valuable customers.
Theme hierarchies matter more than keyword clouds
AI text analysis provides crucial context word clouds miss. Chasing frequency without context is the flaw in word clouds.
They tally how many times "delivery," "payment," or "support" appear and assume that's enough to guide action.
But as we are showing, It isn't. The flaw is structural. Single phrases as used in word clouds hide the context behind the original comments.
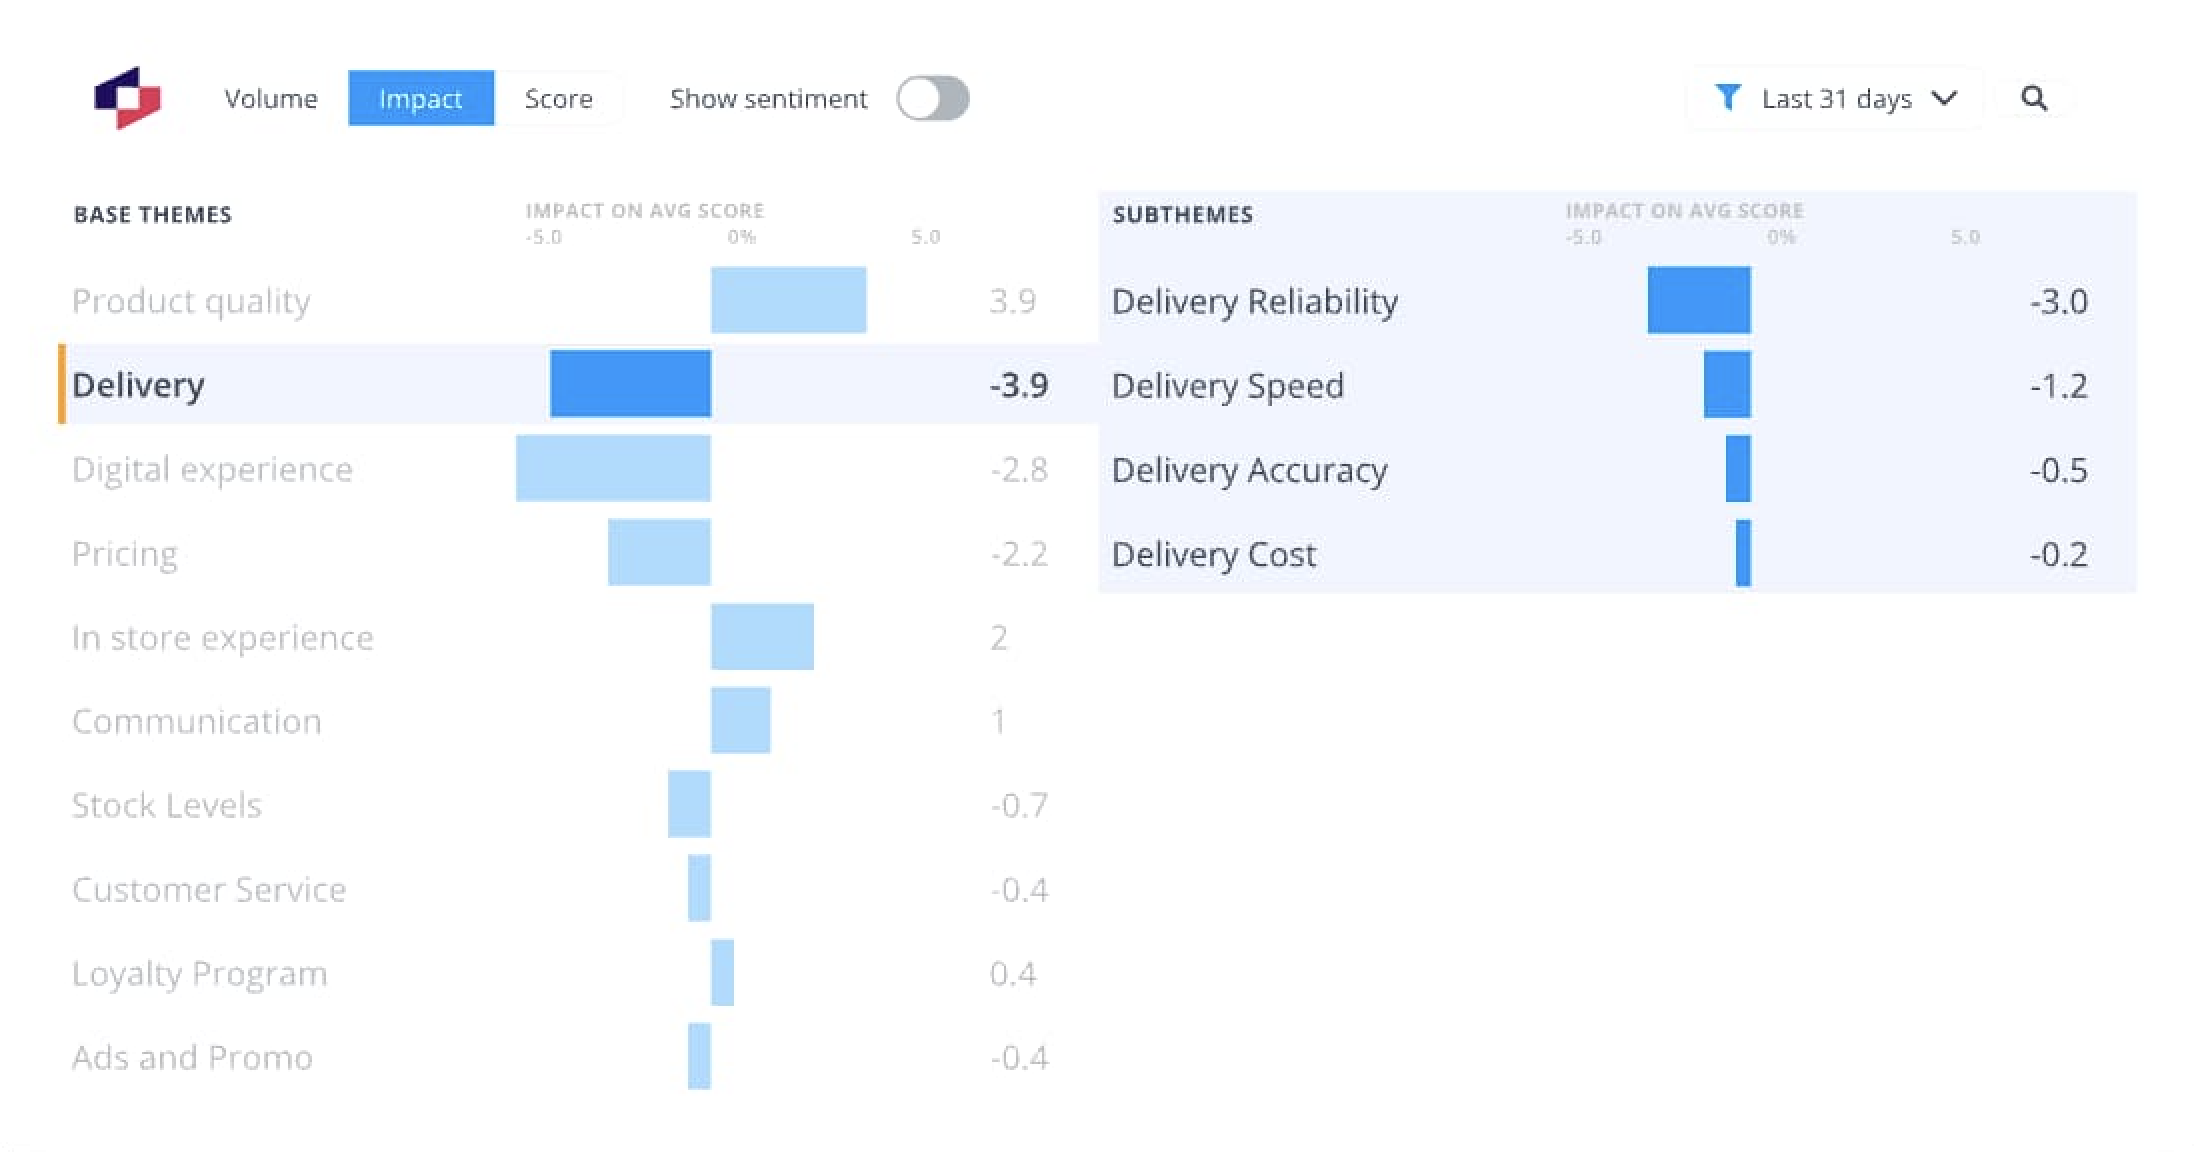
Take a base theme, "delivery", in this case. In raw counts, it looks like one issue.
In reality, it's four distinct problems with vastly different impacts:
Delivery reliability (missed time slots, no-shows): -3.0 NPS points
Delivery speed (late arrivals): -1.2 NPS points
Delivery accuracy (wrong items): -0.5 NPS points
Delivery cost (unexpected fees): -0.2 NPS points
Figure 2: Theme hierarchy shows how a single keyword (base theme) masks distinct problems with different business impacts. Reliability issues drive 2.5x more NPS damage than speed issues, but flat keyword counting treats them identically.
In this example, reliability causes 15x more damage than cost issues. But without building a hierarchy of themes that drills down deeper into the issue, a simple world cloud volume count treats them identically.
Treating all of these as "delivery" is like a doctor diagnosing "pain" without knowing if it's in the chest or the knee. You know something's wrong, but you can't prescribe a fix.
This is where AI text analysis pulls ahead.
Instead of a flat list, it builds hierarchies. It breaks themes into parent/child subthemes.
Instead of a flat "delivery" keyword, you see exactly which aspect is dragging scores down, for whom, and by how much.
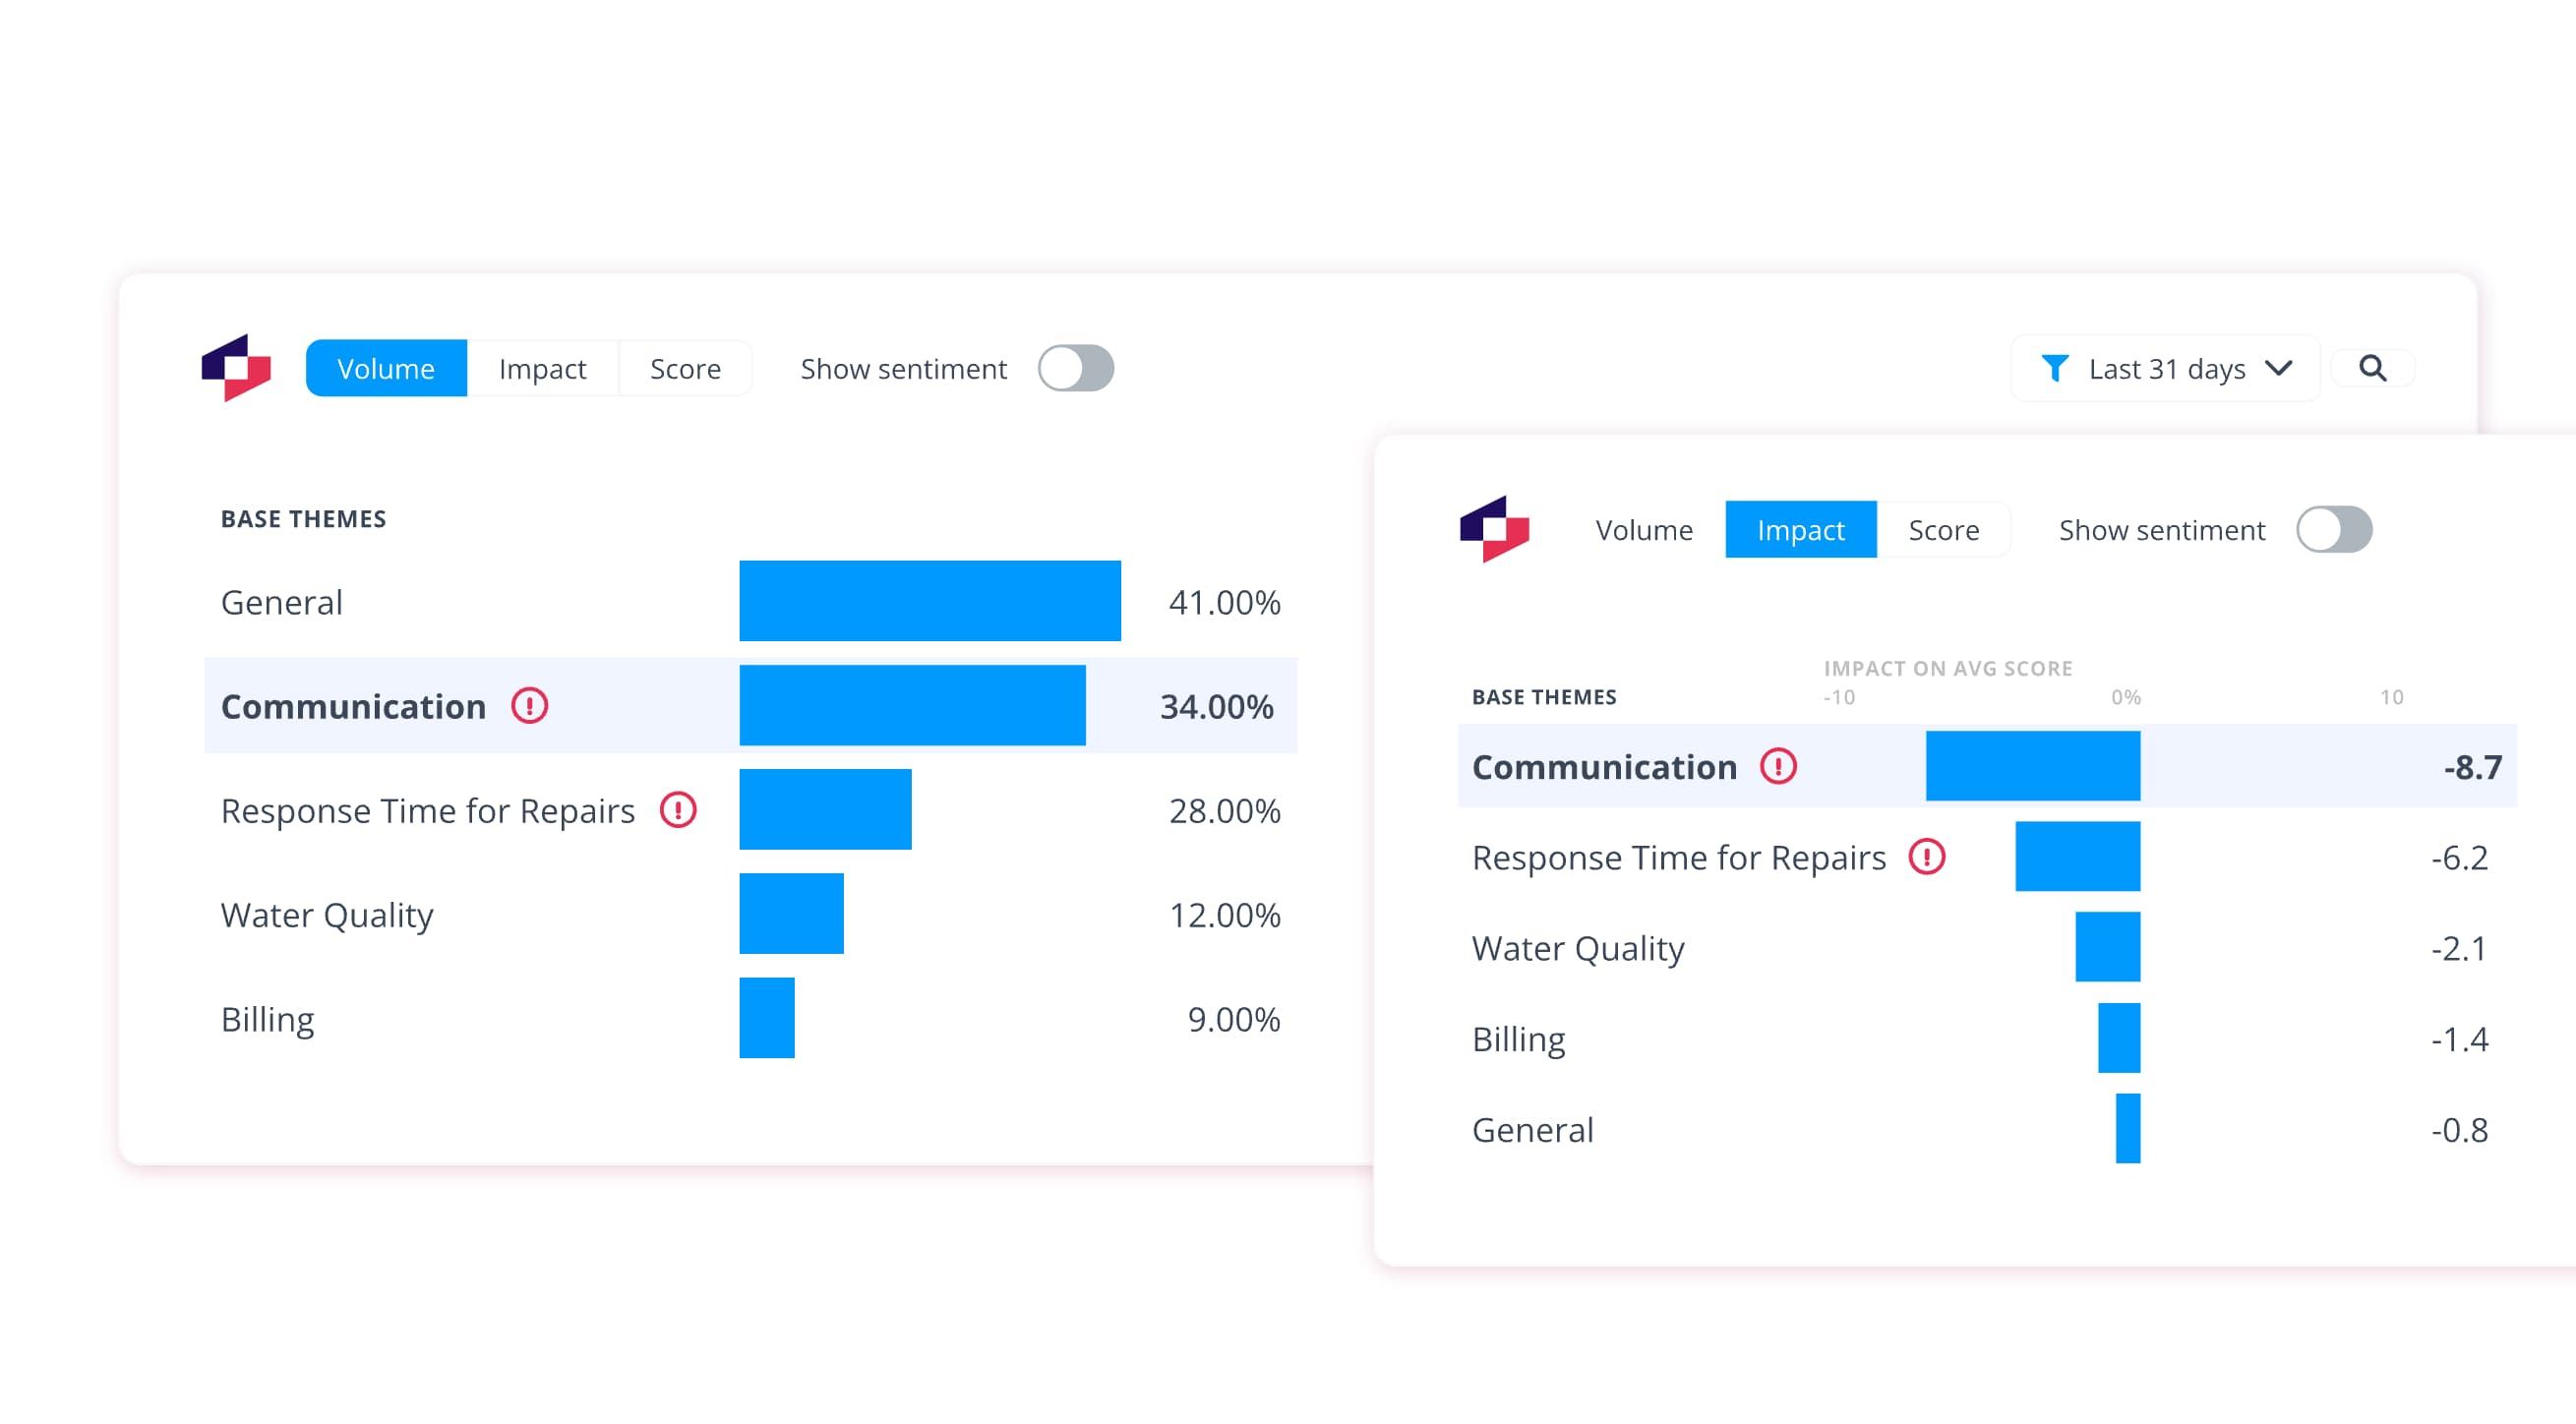
Consider a utilities company during a major service disruption. Thousands of complaints flood the support center overnight. Burst mains, outages, service failures everywhere.
A word cloud would light up with "water" and "service." Both are too vague to guide crisis response.
Impact analysis reveals the real drivers: communication during outages and response time for repairs.
These specific subthemes enable teams to form cross-functional task forces, shift from reactive firefighting to proactive problem-solving, and return to benchmark service levels faster.
Figure 3: Crisis triage through impact analysis. During high-volume events, teams need to distinguish between themes mentioned frequently (General: 41% volume) and themes driving severe score damage. Volume-based triage misses critical issues.
This is why we treat hierarchy as a governance tool, not just an analytic layer.
It routes the right issue to the right team, prevents wasted budget on vague fixes, and builds executive trust because each subtheme links to an owner, a metric, and an outcome.
Flat keyword counts create noise. AI text analysis creates structure that drills down into root causes, "impact".
And structure is what turns feedback into decisions leaders can stand behind.
Word clouds hide the real story customers are trying to tell you
Word clouds show you keyword volume. Dashboard scores show you averages. Neither reveals what's actually happening in your business.
Here's the trap: both flatten reality into something comfortingly simple.
We see this pattern constantly. Leaders spot "pricing" appearing frequently in feedback and assume it's a universal issue. It isn't.
Take feedback from a telecom provider. Their word cloud prominently featured "pricing" (high volume). Their overall sentiment score showed it as a moderate concern. Both suggested the same thing: an issue worth monitoring, but not urgent.
AI-powered segment analysis revealed the truth:
Retail customers: -2 NPS points (minor friction)
Trade customers: -23 NPS points (churn risk)
Figure 4 shows the breakdown. Same theme. Same timeframe. An 11.5x difference in impact, completely invisible in the overall score.
Trade customers spending $1,000+ annually were hemorrhaging satisfaction while retail customers barely noticed. Package pricing showed the same pattern: -13 points for trade, -4 for retail.
The word cloud onlyshowed "pricing" was mentioned frequently. The overall score showed moderate negativity. AI text analysis platforms like Thematic revealed the company's highest-value segment was slipping away.
This is why keyword frequency and averages mislead. Modern text analysis doesn't just count words or calculate averages. It connects feedback to business outcomes and reveals which customer segments actually drive your metrics.
Without that depth, you're protecting the wrong priorities while revenue quietly disappears.
Moving past word cloud illusions to measurable impact
By now, we've made it clear: word clouds don't just miss the mark, they can actively mislead.
Word clouds create the illusion of understanding while hiding the very drivers leaders need to act on.
To be blunt, word clouds look persuasive in a boardroom with big fonts and bigger words, but they rarely lead to action.
Word clouds stop at surface-level frequency, leaving leaders to guess what actually moves the needle.
AI text-analysis like Thematic delivers layers of evidence like:
Impact quantification: Calculate exactly how much each theme drags (or lifts) NPS/CSAT
Hierarchy mapping: Split parent/child themes so root causes aren't hidden under vague keywords
Segment layering: Reveal which customer groups feel it most and where revenue risk concentrates
The difference is tangible. When Melodics, a music learning platform, needed to build their product roadmap, they evaluated traditional survey tools first.
The verdict?
"Other survey platforms have reports or word clouds, but they don't provide anything substantial or meaningful," says Sam Stokes, Head of Customer Experience.
When they analyzed their NPS feedback with impact analysis instead, leadership conversations changed overnight.
"We could also see that lots of people wanted more lessons in the app, but, interestingly, lessons are not that important to the actual score," the team discovered. Meanwhile, "lag in the app does in fact make a big impact on the NPS score."
Armed with that evidence, the team knew exactly where to focus development resources: fix the lag that actually moved scores, not the feature requests that dominated mentions.
"With Thematic, we can set up our product roadmap better with clearer information about what people want," says Stokes.
ROI doesn't come from prettier visuals. It comes from traceable, prioritized fixes.
From word clouds to strategic decisions
Word clouds make leaders feel like they're "seeing the voice of the customer." But the reality is they're hearing noise: frequency without impact, averages without context, and visuals without action.
AI text analysis tools like Thematic quantify each theme's impact on scores, with high granularity.
That's the difference between having a word cloud and walking into your next board meeting with evidence leaders can act on, and most importantly, trust.
Ready to see what your feedback is actually telling you?
Request a demo of Thematic's Customer Intelligence Platform
Thematic turns fragmented feedback into one consistent source of customer truth — so every team acts on the same customer story. Up and running in days, not quarters.
Thank you! Your submission has been received!
Oops! Something went wrong while submitting the form.