Here, we go through important factors to consider when using insights from your voice of customer (VOC) programme, looking at customer lifetime value, in particular, to motivate your internal stakeholders to take action. These factors can also be helpful for prioritizing which tasks to act upon first using your VOC insights.
This is part 2 of our blog series from our webinar “5 practical ways to influence managers for VOC success”, by myself and Dr. Alyona Medelyan. For the background story, check out the first post here.
This blog series is all about how to make a strong case internally in your business to get buy-in from your stakeholders for your VOC programme.
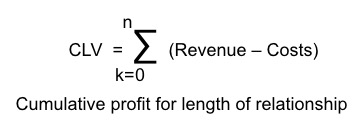
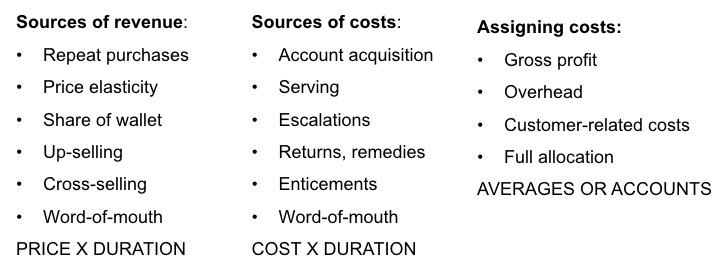
As you know, when looking at customer lifetime value, sources of revenue are things such as repeat purchases, up-sell and cross-sell etc – pretty straightforward. But to create a sense of urgency, let’s look at what costs your customers can incur – and why this is important.
- Firstly, look at how much it costs to acquire customers in the first place. Costs to consider are sales collateral, conversations and all of the efforts around getting customers onboard.
- Consider what it costs to serve your customers, including daily management of their orders and delivery as well as tech support and customer support.
- CX professionals often forget taking into account escalations. There are certain customer segments or accounts that have more escalations than others and that’s something to consider for how valuable certain customers in relation to others.
- Next, we have returns and remedies that are needed for those particular situations. Also, we need to consider enticements such as the loyalty program or volume discounts and warranty extensions that we invoke to maintain certain customers or to attract others, or to make up for any operational discrepancies.
- Finally, there’s negative word-of-mouth, which can be a huge cost. Certain customers might hold a grudge or have experienced something can be a further cost that we don’t usually quantify or keep track of.
Anything in your VOC insights that might impact these cost sources can be a good idea for you to quantify as risk elements that your data represent. And yet another reason for managers in your company (your stakeholders) to take action using your VOC insights.
How to assign costs to customers?
If we look at customer value, the tricky part of defining accurate customer lifetime value is assigning accurate costs to customers. We’ll need to consider gross profit and visible costs and as well as costs that are spread out across different sets of customers, and don’t forget the hidden costs. Getting down to the penny of what everybody is actually costing becomes tricky.
I recommend doing this calculation in a “quick-and-dirty” way and not worry about assigning costs too much. For example: “This group of customers represented by this answer to VOC questions had X and Y number of escalations last year”.
Anything that you can correlate like such, would be a good use of lifetime value and help to convey a story about your customer insights, and yet again a reason for managers to pay attention.
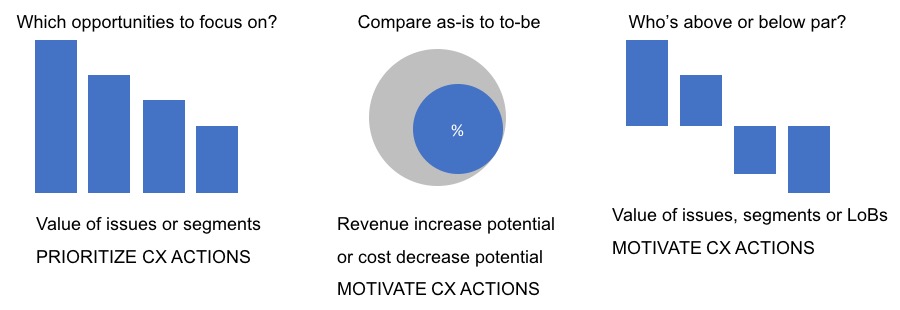
Another way you can take the monetization of your customer insights is to compare the as-is to the to-be.
For example, (in the middle visual in the diagram above) right now the dark blue is the current state but if we made a change, for example, X number of customers were happy or unhappy, we could change it to the larger circle.
Or vice versa. Another way of conveying this pictorially is by having a horizontal line that is your baseline and then you have bars going above the horizontal line which shows its above par or bars going below means it’s below par.
I’ve found that for B2B in particular, a directional process is certainly sufficient. Of course, in market research and for VOC, people do want to see the statistical validity and a confidence level. But, once you get beyond the fact that your survey data is, in fact, accurate and representative of the entire customer base, then you can take some liberties with quantifying the lifetime value or the monetary implications.
As long as you have been transparent in whatever assumptions that you’re using behind those numbers, these kinds of visual representations are very effective in getting peoples’ attention and action.
What about how to demonstrate strategic ROI for customer experience value?
Financial ROI is simply the equation of the growth from an investment, minus the cost divided by the cost.
As you can see in the example below, as an example say you can get $500 from an investment and the investment cost $400 to acquire. So you would get $100 over $400 for 25% gain.
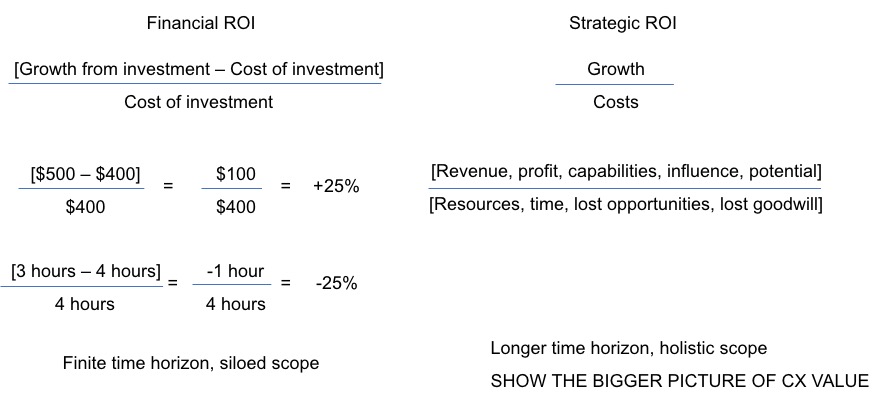
Or, something is going to be 3 hours but it used to be 4 hours so this is a one-hour saving or a 25% reduction.
For financial ROI the main point is that you have a finite time horizon and you are only looking at it for a particular period of time (this quarter, for example), so it’s a “siloed” scope. It doesn’t necessarily take into account any other implications around it.
In real life, you have many factors that come into play. Strategic ROI takes into account the broader picture of your overall growth and cost. It’s not always cut-and-dry quantified in a specific number such “positive 25%” or “negative 25%”. It’s usually more of a story.
You may be able to show exact quantities, but you’re bringing to your managers’ attention that not only is there a specific immediate financial implication, also there’s a longer-term play here with specific implications– which is what’s important to demonstrate strategic ROI.
There are some peripheral advantages or disadvantages to either the status quo or the potential change that we’re planning to make. It can be useful talking to higher level executives about the upside and the downside to specific courses of action implied by voice of the customer insights.


.jpg)
.jpg)


